

Prognostic analyses of genes associated with anoikis in breast cancer
- PMID: 37842046
- PMCID: PMC10576492
- DOI: 10.7717/peerj.15475
Prognostic analyses of genes associated with anoikis in breast cancer
Abstract
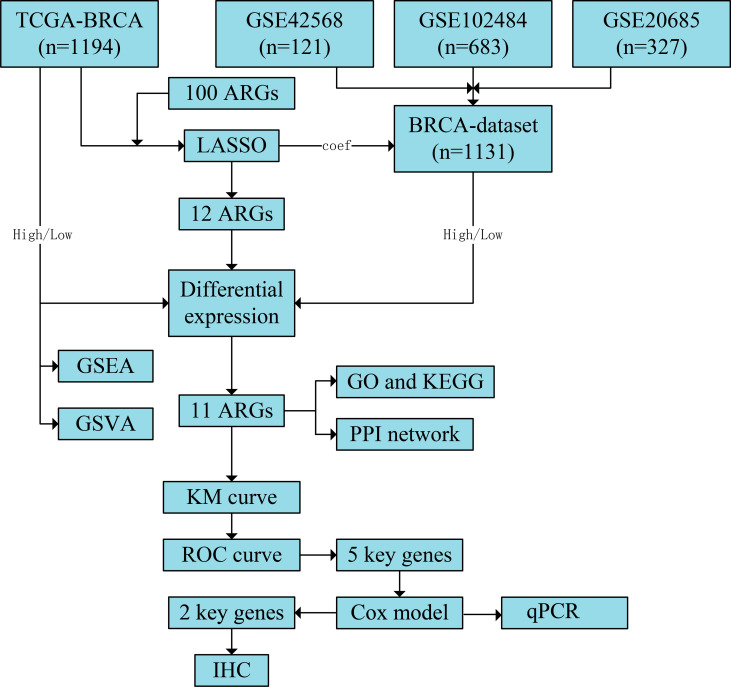
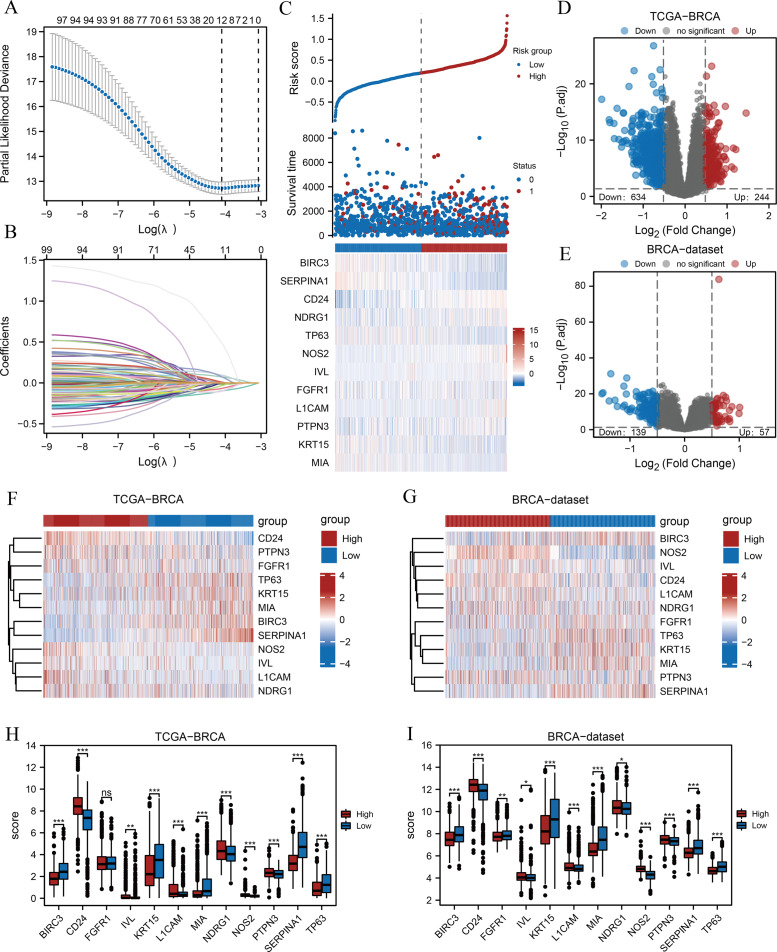
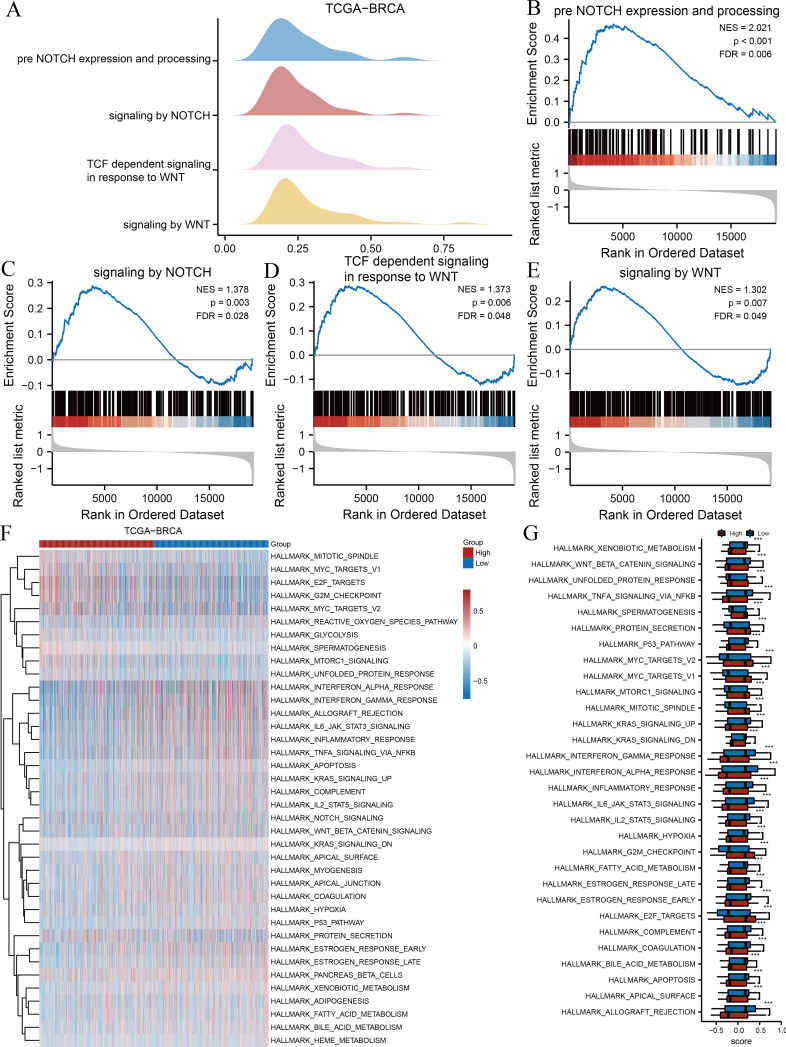
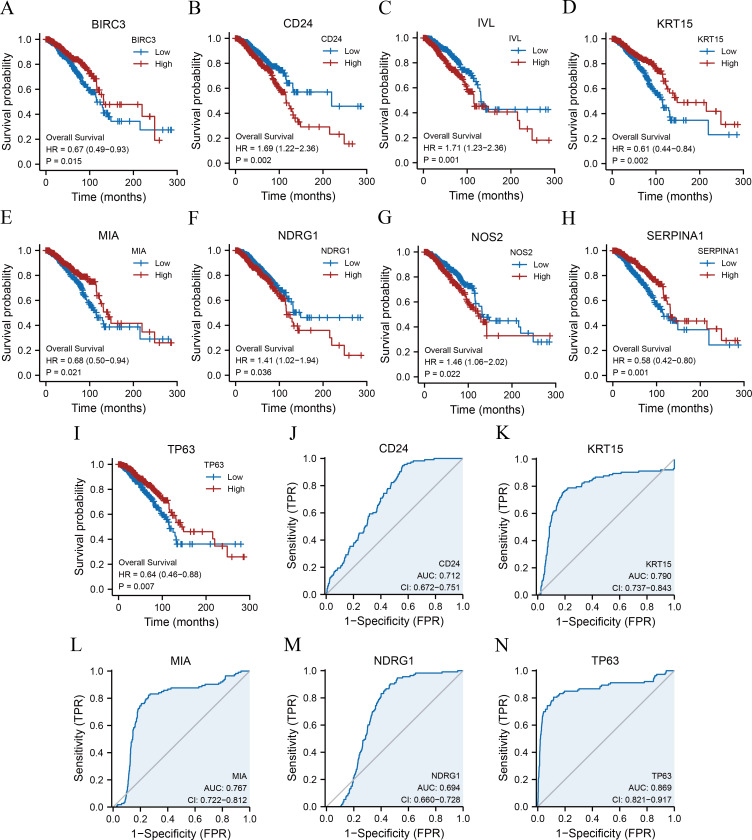
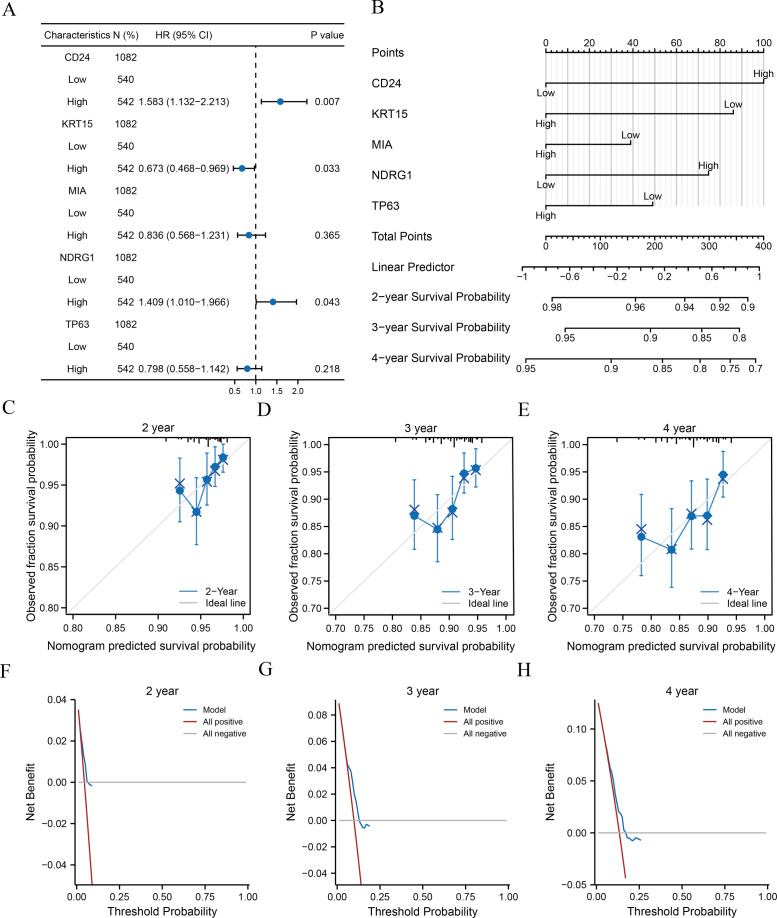
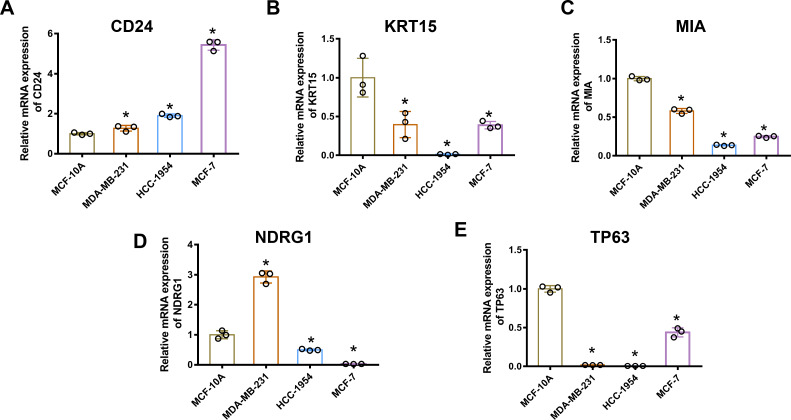
Breast cancer (BRCA) is the most diagnosed cancer worldwide and is responsible for the highest cancer-associated mortality among women. It is evident that anoikis resistance contributes to tumour cell metastasis, and this is the primary cause of treatment failure for BRCA. However, anoikis-related gene (ARG) expression profiles and their prognostic value in BRCA remain unclear. In this study, a prognostic model of ARGs based on The Cancer Genome Atlas (TCGA) database was established using a least absolute shrinkage and selection operator analysis to evaluate the prognostic value of ARGs in BRCA. The risk factor graph demonstrated that the low-risk group had longer survival than the high-risk group, implying that the prognostic model had a good performance. We identified 11 ARGs that exhibited differential expression between the two risk groups in TCGA and Gene Expression Omnibus databases. Through Gene Ontology and Kyoto Encyclopaedia of Genes and Genomes enrichment analyses, we revealed that the screened ARGs were associated with tumour progression and metastasis. In addition, a protein-protein interaction network showed potential interactions among these ARGs. Furthermore, gene set enrichment analysis suggested that the Notch and Wnt signalling pathways were overexpressed in the high-risk group, and gene set variation analysis revealed that 38 hallmark genes differed between the two groups. Moreover, Kaplan-Meier survival curves and receiver operating characteristic curves were used to identify five ARGs (CD24, KRT15, MIA, NDRG1, TP63), and quantitative polymerase chain reaction was employed to assess the differential expression of these ARGs. Univariate and multivariate Cox regression analyses were then performed for the key ARGs, with the best prediction of 3 year survival. In conclusion, ARGs might play a crucial role in tumour progression and serve as indicators of prognosis in BRCA.
Keywords: Anoikis; Breast cancer; CD24; NDRG1; Prognosis.
©2023 Cao et al.
Conflict of interest statement
The authors declare there are no competing interests.
Figures
Similar articles
-
Anoikis-related genes in breast cancer patients: reliable biomarker of prognosis.BMC Cancer. 2024 Sep 19;24(1):1163. doi: 10.1186/s12885-024-12830-5. BMC Cancer. 2024. PMID: 39300389 Free PMC article.
-
Identification of Novel Anoikis-Related Gene Signatures to Predict the Prognosis, Immune Microenvironment, and Drug Sensitivity of Breast Cancer Patients.Cancer Control. 2024 Jan-Dec;31:10732748241288118. doi: 10.1177/10732748241288118. Cancer Control. 2024. PMID: 39340434 Free PMC article.
-
Development of a prognostic model to predict BLCA based on anoikis-related gene signature: preliminary findings.BMC Urol. 2023 Dec 4;23(1):199. doi: 10.1186/s12894-023-01382-8. BMC Urol. 2023. PMID: 38049825 Free PMC article.
-
Construction of a gene signature associated with anoikis to evaluate the prognosis and immune infiltration in patients with colorectal cancer.Transl Cancer Res. 2024 Apr 30;13(4):1904-1923. doi: 10.21037/tcr-23-1221. Epub 2024 Apr 25. Transl Cancer Res. 2024. PMID: 38737694 Free PMC article.
-
A signature based on anoikis-related genes for the evaluation of prognosis, immunoinfiltration, mutation, and therapeutic response in ovarian cancer.Front Endocrinol (Lausanne). 2023 Jun 13;14:1193622. doi: 10.3389/fendo.2023.1193622. eCollection 2023. Front Endocrinol (Lausanne). 2023. PMID: 37383389 Free PMC article.
Cited by
-
A novel gene signature associated with anoikis predicts prognosis and unveils immune infiltration in breast cancer patients.Discov Oncol. 2025 Apr 2;16(1):447. doi: 10.1007/s12672-025-02213-y. Discov Oncol. 2025. PMID: 40172726 Free PMC article.
-
Unraveling the relationship between anoikis-related genes and cancer-associated fibroblasts in liver hepatocellular carcinoma.Heliyon. 2024 Jul 29;10(15):e35306. doi: 10.1016/j.heliyon.2024.e35306. eCollection 2024 Aug 15. Heliyon. 2024. PMID: 39165997 Free PMC article.
References
-
- Barrett T, Wilhite SE, Ledoux P, Evangelista C, Kim IF, Tomashevsky M, Marshall KA, Phillippy KH, Sherman PM, Holko M, Yefanov A, Lee H, Zhang N, Robertson CL, Serova N, Davis S, Soboleva A. NCBI GEO: archive for functional genomics data sets–update. Nucleic Acids Research. 2013;41:D991–D995. doi: 10.1093/nar/gks1193. - DOI - PMC - PubMed
Publication types
MeSH terms
Associated data
LinkOut - more resources
Full Text Sources
Medical
Research Materials
Miscellaneous
