. 2023 Sep 29:11:1219218.
doi: 10.3389/fcell.2023.1219218. eCollection 2023.

Mimicking lipolytic, adipogenic, and secretory capacities of human subcutaneous adipose tissue by spheroids from distinct subpopulations of adipose stromal/stem cells

Affiliations

Mimicking lipolytic, adipogenic, and secretory capacities of human subcutaneous adipose tissue by spheroids from distinct subpopulations of adipose stromal/stem cells

Isis Côrtes et al. Front Cell Dev Biol. .

Abstract

Background: Adipose tissue engineering may provide 3D models for the understanding of diseases such as obesity and type II diabetes. Recently, distinct adipose stem/stromal cell (ASC) subpopulations were identified from subcutaneous adipose tissue (SAT): superficial (sSAT), deep (dSAT), and the superficial retinacula cutis (sRC). This study aimed to test these subpopulations ASCs in 3D spheroid culture induced for adipogenesis under a pro-inflammatory stimulus with lipopolysaccharide (LPS). Methods: The samples of abdominal human subcutaneous adipose tissue were obtained during plastic aesthetic surgery (Protocol 145/09). Results: ASC spheroids showed high response to adipogenic induction in sSAT. All ASC spheroids increased their capacity to lipolysis under LPS. However, spheroids from dSAT were higher than from sSAT (p = 0.0045) and sRC (p = 0.0005). Newly formed spheroids and spheroids under LPS stimulus from sSAT showed the highest levels of fatty acid-binding protein 4 (FABP4) and CCAAT/enhancer-binding protein-α (C/EBPα) mRNA expression compared with dSAT and sRC (p < 0.0001). ASC spheroids from sRC showed the highest synthesis of angiogenic cytokines such as vascular endothelial growth factor (VEGF) compared with dSAT (p < 0.0228). Under LPS stimulus, ASC spheroids from sRC showed the highest synthesis of pro-inflammatory cytokines such as IL-6 compared with dSAT (p < 0.0092). Conclusion: Distinct physiological properties of SAT can be recapitulated in ASC spheroids. In summary, the ASC spheroid from dSAT showed the greatest lipolytic capacity, from sSAT the greatest adipogenic induction, and sRC showed greater secretory capacity when compared to the dSAT. Together, all these capacities form a true mimicry of SAT and hold the potential to contribute for a deeper understanding of cellular and molecular mechanisms in healthy and unhealthy adipose tissue scenarios or in response to pharmacological interventions.

Keywords: adipogenesis; adipokines; adipose stromal/stem cells; deep subcutaneous adipose tissue; spheroids; subcutaneous adipose tissue; superficial retinacula cutis; superficial subcutaneous adipose tissue.


Conflict of interest statement

The authors declare that the research was conducted in the absence of any commercial or financial relationships that could be construed as a potential conflict of interest.

Figures

FIGURE 1
FIGURE 1
Induced ASC spheroids in the presence or absence of LPS stimulus showed lipid-accumulating cells migrating outside spheroids. Illustrative scheme of the stages of cell seeding and adipogenic induction (A–C). Newly formed spheroids from sSAT presented lateralized morphology, distinct from sRC and dSAT (D,J,P). Induced ASC spheroids and induced ASC spheroids under LPS stimulus at week 5 from sSAT, sRC, and dSAT showed a cell population migrating outside spheroids, resulting in a protuberance in their structure (E,K,Q,F,L,R). Nile red staining revealed the presence of lipid droplets in this cell population (insets). Induced ASC spheroids in the presence or absence of LPS stimulus from sSAT, sRC, and dSAT showed similar values for this test. Two independent analyses were evaluated with a total of 324 spheroids of each sample obtained from four independent experiments. The graph measuring the diameter of the spheroids of sSAT (G), sRC (M), and dSAT (S). Graph of the ratio between the minor and major diameters of the sSAT (H), sRC (N), and dSAT (T). Induced ASC spheroids from sSAT, sRC, and dSAT showed similar levels of LDH in the absence or presence of LPS (I,O,U), revealing no cytotoxic effects for this pro-inflammatory stimulus. (*p < 0.05; **p < 0.001; ***p < 0.001; ****p < 0.0001). SAT, Subcutaneous adipose tissue; ASC, Stem/stromal cells from adipose tissue. Bar size: 50 μm.
FIGURE 2
FIGURE 2
Induced ASC spheroids from sSAT showed the highest adipogenic capacity and from dSAT the highest lipolytic capacity. Induced ASC spheroids from sSAT showed a more evident presence of unilocular cells in the center of the spheroids (arrow) and more elongated cells in the periphery (arrowhead) (A,B). Induced ASC spheroids from sSAT under LPS showed no difference in cell morphology (C,D). Induced ASC spheroids from sRC (E,F) and dSAT (I,J) and under LPS from sRC (G,H) and dSAT (K,L) showed similar lipid accumulation. Nile red and Hoechst nuclei staining. Bar size: 50 μm. The ANOVA test evaluated the difference between the sSAT, sRC, and dSAT spheroids within each group: adipogenic induction in the absence or presence of LPS (M). Three independent analyses in triplicate were evaluated with a total of 81 spheroids of each condition of each sample obtained from three independent experiments. Dashed lines indicate post-test analyses under both conditions. Solid lines indicate t-test analyses, which were performed to verify the statistical difference between induced ASC spheroids in the absence and in the presence of LPS from sSAT, sRC, and dSAT. Asterisks indicate p-values obtained in the post-test and in the t-test (*p < 0.05; **p < 0.001; *** p < 0.001). SAT, subcutaneous adipose tissue; LPS, lipopolysaccharide; ASC, stem/stromal cells from adipose tissue.
FIGURE 3
FIGURE 3
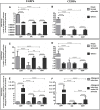
Analysis of FABP4 and CEBPα revealed that the ASC spheroids from sSAT showed higher expression of both genes from the newly formed spheroids and induced spheroids for the adipogenic pathway under LPS stimulus when compared to sRC and dSAT. Graph of the relativization of the newly formed spheroids in relation to spheroids with 1 week of adipogenic induction (Fold change 1 week of adipogenic induction vs. newly formed spheroids) of FABP4 gene expression (A) and CEBPα gene expression (B). Graph of the relativization of the newly formed spheroids in relation to spheroids with 5 weeks of adipogenic induction (Fold change 5 week of adipogenic induction vs. newly formed spheroids) of FABP4 gene expression (C) and CEBPα gene expression (D). Graph of the relativization of spheroids induced by the adipogenic pathway in relation to the spheroids induced by the adipogenic pathway under LPS stimulation at week 5 (Fold change 5 weeks of adipogenic induction vs. 5 weeks of adipogenic induction under LPS stimulus) of FABP4 gene expression (E). CEBPα gene expression (F). Two independent analyses were evaluated in triplicate for each gene. RNA samples were isolated from 162 spheroids of each sample obtained from two independent experiments. The two-way ANOVA test followed by the Tukey multiple comparison analysis evaluated the difference between the evaluated conditions and between the sSAT, sRC, and dSAT. (*p < 0.05; **p < 0.001; ***p < 0.001; **** p < 0.0001). SAT, subcutaneous adipose tissue; LPS, lipopolysaccharide; ASC, stem/stromal cells from adipose tissue; FABP4, fatty acid-binding protein 4; C/EBPα, CCAAT/enhancer-binding protein-α.
FIGURE 4
FIGURE 4
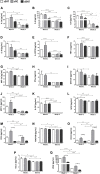
ASC spheroids from sRC showed higher secretion of CCL5, CCL10, and VEGF after week 5 of adipogenic induction compared to sSAT and dSAT. Secretion of IL-1α (A), IL-6 (B), IL-8 (C), IL-10 (D), IL-12p70 (E), TNF-α (F), MIP-1α (G), IFN-γ (H), GM-CSF (I), MCP-1 (J) G-CSF (K), bFGF (L), CCL5 (M), PDGF-BB (N), CCL10 (O), CCL11 (P), and E VEGF (Q) of ASC spheroids in weeks 1 and 5 of adipogenic induction from sSAT, sRC, and dSAT. One independent analysis was evaluated in quadruplicate from 162 spheroids of each sample obtained from four independent experiments. Data are expressed as mean ± SD. The ANOVA test evaluated the difference between ASC spheroids from sSAT, sRC, and dSAT within each group: weeks 1 and 5 of adipogenic induction. Dashed lines indicate post-test analyses under both conditions. Solid lines indicate t-test analyses, which were performed to verify the statistical difference between week 1 of adipogenic induction and week 5 of adipogenic induction from sSAT, sRC, and dSAT. Asterisks indicate p values obtained in the post-test and in the t-test (* p < 0.05; **p < 0.001; ***p < 0.001; **** p < 0.0001). SAT, subcutaneous adipose tissue; ASC, stem/stromal cells from adipose tissue; IL, interleukin; IL-6, interleukin-6; IL-8, interleukin-8; IL-10, interleukin-10; IL-12p70, interleukin-12; IL-15, interleukin-15; IFN-γ, interferon-γ; MCP-1, monocyte chemoattractant protein-1; bFGF, basic fibroblast growth factor; VEGF, vascular endothelial growth factor; GM-CSF, granulocyte-macrophage colony-stimulating factor; G-CSF, granulocyte colony-stimulating factor; PDGF-BB, platelet-derived growth factor; and CCL, CC chemokine ligand.
FIGURE 5
FIGURE 5
ASC spheroids from sRC were more responsive to LPS stimulus compared with sSAT and dSAT. Secretion of IL-6 (A), IL-8 (B), IL-10 (C), IL12p70 (D), MCP-1 (E), VEGF (F) CCL5 (G), CCL10 (H), and CCL11 (I) of induced spheroids for the adipogenic pathway under LPS stimulus from sSAT, sRC, and dSAT. One independent analysis was evaluated in quadruplicate from 162 spheroids of each sample obtained from four independent experiments. Data are expressed as mean ± SD. The ANOVA test evaluated the difference between ASC spheroids from sSATl, sRC, and dSAT within each group: induced spheroids for the adipogenic pathway under LPS stimulus. Dashed lines indicate post-test analyses under both conditions. Solid lines indicate t-test analyses, which were performed to verify the statistical difference between induced spheroids for the adipogenic pathway under LPS stimulus from sSAT, sRC, and dSAT. Asterisks indicate p values obtained in the post-test and in the t-test (*p < 0.05; **p < 0.001; ***p < 0.001; **** p < 0.0001). SAT, subcutaneous adipose tissue; LPS, lipopolysaccharide; ASC, stem/stromal cells from adipose tissue; IL, interleukin; IL-6, interleukin-6; IL-8, interleukin-8; IL-10, interleukin-10; IL-12p70, interleukin-12; IL-15, interleukin-15; IFN-γ, interferon-γ; MCP-1, monocyte chemoattractant protein-1; bFGF, basic fibroblast growth factor; VEGF, vascular endothelial growth factor; GM-CSF, granulocyte-macrophage colonyQ18 stimulating factor; G-CSF, granulocyte colony stimulating factor; PDGF-BB, platelet-derived growth factor; CCL, CC chemokine ligand.

Similar articles

Cited by

References

    1. Bachelerie F., Graham G. J., Locati M., Mantovani A., Murphy P. M., Nibbs R., et al. (2014). New nomenclature for atypical chemokine receptors. Nat. Immunol. 15 (3), 207–208. 10.1038/ni.2812 - DOI - PubMed
    1. Bao B., Jiang J., Yanase T., Nishi Y., Morgan J. R. (2011). Connexon-mediated cell adhesion drives microtissue self-assembly. FASEB J. 25 (1), 255–264. 10.1096/fj.10-155291 - DOI - PMC - PubMed
    1. Baptista L. S., Côrtes I., Montenegro B., Claudio-da-Silva C., Bouschbacher M., Jobeili L., et al. (2021). A novel conjunctive microenvironment derived from human subcutaneous adipose tissue contributes to physiology of its superficial layer. Stem Cell Res. Ther. 12 (1), 480. 10.1186/s13287-021-02554-9 - DOI - PMC - PubMed
    1. Baptista L. S., Silva K. R., Borojevic R. (2015). Obesity and weight loss could alter the properties of adipose stem cells? World J. Stem Cells 7 (1), 165–173. 10.4252/wjsc.v7.i1.165 - DOI - PMC - PubMed
    1. Bender R., Bender R., McCarthy M., McCarthy M., Brown T., Bukowska J., et al. (2020). Human adipose derived cells in two- and three-dimensional cultures: functional validation of an in vitro fat construct. Stem Cells Int. 2020, 4242130. 10.1155/2020/4242130 - DOI - PMC - PubMed