. 2023 Sep 26:15:1240971.
doi: 10.3389/fnagi.2023.1240971. eCollection 2023.

Multifactorial assessment of Parkinson's disease course and outcomes using trajectory modeling in a multiethnic, multisite cohort - extension of the LONG-PD study

Affiliations

Multifactorial assessment of Parkinson's disease course and outcomes using trajectory modeling in a multiethnic, multisite cohort - extension of the LONG-PD study

Bruce A Chase et al. Front Aging Neurosci. .

Abstract

Background: The severity, progression, and outcomes of motor and non-motor symptoms in Parkinson's disease (PD) are quite variable. Following PD cohorts holds promise for identifying predictors of disease severity and progression.

Methods: PD patients (N = 871) were enrolled at five sites. Enrollment occurred within 5 years of initial motor symptom onset. Disease progression was assessed annually for 2-to-10 years after onset. Group-based trajectory modeling was used to identify groups differing in disease progression. Models were developed for UPDRS-III scores, UPDRS-III tremor and bradykinesia-rigidity subscores, Hoehn & Yahr (H&Y) stage, Mini-Mental Status Exam (MMSE) scores, and UPDRS-III, H&Y and MMSE scores considered together. Predictors of trajectory-group membership were modeled simultaneously with the trajectories. Kaplan-Meier survival analysis evaluated survival free of PD outcomes.

Results: The best fitting models identified three groups. One showed a relatively benign, slowly progressing trajectory (Group 1), a second showed a moderate, intermediately progressing trajectory (Group 2), and a third showed a more severe, rapidly progressing trajectory (Group 3). Stable trajectory-group membership occurred relatively early in the disease course, 5 years after initial motor symptom. Predictors of intermediate and more severe trajectory-group membership varied across the single variable models and the multivariable model jointly considering UPDRS-III, H&Y and MMSE scores. In the multivariable model, membership in Group 2 (28.4% of patients), relative to Group 1 (50.5%), was associated with male sex, younger age-at-onset, fewer education-years, pesticide exposure, absence of reported head injury, and akinetic/rigid subtype at initial presentation. Membership in Group 3 (21.3%), relative to Group 1, was associated with older age-at-onset, fewer education-years, pesticide exposure, and the absence of a tremor-predominant subtype at initial presentation. Persistent freezing, persistent falls, and cognitive impairment occurred earliest and more frequently in Group 3, later and less frequently in Group 2, and latest and least frequently in Group 1. Furthermore, autonomic complications, dysphagia, and psychosis occurred more frequently in Groups 2 and 3 than in Group 1.

Conclusion: Modeling disease course using multiple objective assessments over an extended follow-up duration identified groups that more accurately reflect differences in PD course, prognosis, and outcomes than assessing single parameters over shorter intervals.

Keywords: Parkinson’s disease; disease outcomes; group-based-trajectory model; longitudinal monitoring; motor symptoms; non-motor symptoms.


Conflict of interest statement

The authors declare that the research was conducted in the absence of any commercial or financial relationships that could be construed as a potential conflict of interest.

Figures
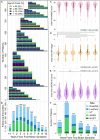
Figure 1
Figure 1
Characteristics of the LONG-PD cohort. Panels (A) and (B) show follow-up of LONG-PD participants by disease duration (years from initial motor symptom) and age at first motor symptom. Patients assessed in this analysis had motor symptom onset within 5 years of the initial clinical encounter and were followed for up to 10 years after the onset of the initial motor symptom. Panel (A) shows the duration of follow-up, color coded by age at onset. Panel (B) shows the total number of encounters per year, color coded by site. The <1 coordinate on the x-axis, which is jointly used by panels (A) and (B), corresponds to initial clinical encounters that occurred within a year of the appearance of the initial motor symptom. To facilitate comparison of data in panels (A) and (B), thin gray vertical lines demarcate clinical encounters that occurred in subsequent years. Each patient’s follow-up is depicted by a thin, horizontal line extending from when the initial encounter occurred relative to the initial motor symptom (left end) to the last year of follow-up (right end). Lines are colored by age group at onset (legend top left). Thick bars result from the merged lines of patients in the same age groups who were followed for the same length of time. (B) Bar chart illustrating the total number of patient encounters at each year of disease duration, color-coded by site [legend in panel (F)]. Violin plots (box plots modified with overlaid plots of the estimated kernel density) show the distribution of (C) MMSE scores, (D) Hoehn and Yahr (H&Y) stages and (E) UPDRS-III scores at the initial clinical encounter, by disease duration. In each violin plot, the white dot identifies the median, the black rectangle the interquartile range, and the spikes extend to the upper- and lower-adjacent values. The results of one-way ANOVAs for MMSE scores, H&Y stages, and UPDRS-III scores by disease duration are noted. Horizontal lines identify differences between disease-duration groups that were significant after Bonferroni correction for multiple testing. Hoehn & Yahr stage differed at the initial clinical encounter between patients with durations of either <1 yr. or 1 yr. and 3-, 4-, or 5- yrs (***p ≤ 0.002). UPDRS-III scores differed at the initial clinical encounter between patients with <1-yr and 3-yr duration (**p = 0.005). Panel (F) shows the total number of initial encounters by year from the initial motor symptom, color-coded by site. Panels (C)(F) use the same X-axis. Thin gray vertical lines demarcate clinical encounters for each year.
Figure 2
Figure 2
Trajectories seen in the LONG-PD cohort when three assessments are modeled jointly. Group-based trajectory modeling using UPDRS-III score, Hoehn and Yahr (H&Y) Stage and Mini-Mental Status Exam (MMSE) score identified three groups (A). Assignment to group-membership trajectories converge (B) with <5% misclassification (C) (dashed teal line) by about 5 years after the onset of the initial motor symptom. Trajectories were modeled jointly with the predictors: sex, age at motor-symptom onset, education-years, pesticide exposure, head injury, diabetes, REM-behavior sleep disorder, family history (Parkinson’s disease, dementia, or tremor), and initial presentation (tremor-predominant, akinetic/rigid predominant).
Figure 3
Figure 3
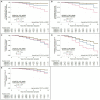
Survival free of clinically significant milestones in the groups identified when three assessments are modeled jointly. Kaplan–Meier analyses for survival free of (A) persistent freezing, (B) persistent falls, (C) dysphagia, (D) cognitive impairment, and (E) psychosis in trajectory-groups identified using group-based trajectory models simultaneously considering UPDRS-III total score, Hoehn & Yahr (H&Y) stage, and Mini-Mental Status Exam (MMSE) score. Trajectories were modeled jointly with the predictors: sex, age at motor-symptom onset, education-years, pesticide exposure, head injury, diabetes, REM-behavior sleep disorder, family history (Parkinson’s disease, dementia, or tremor), and initial presentation (tremor-predominant, akinetic/rigid predominant). The at-risk table beneath each plot shows the number at-risk at each time point, with the number of failed (outcome reached) events listed in parentheses. Log-rank test results are shown. Asterisks identify pairs of trajectory-groups where outcomes differ in pairwise log-rank tests with a Bonferroni-corrected p < 0.05 (*), p < 0.01 (**), or p < 0.001 (***). The outcomes of persistent freezing, persistent falls, and cognitive impairment are poorest in Group 3, which show the most severe trajectories, and less poor in Group 2, which show intermediate trajectories, compared to Group 1, which shows trajectories that are more benign. The outcomes of dysphagia and psychosis are similar in Groups 2 and 3, but poorer than in Group 1.
Figure 4
Figure 4
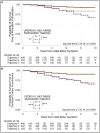
Survival free of autonomic symptoms in the groups identified when three assessments are modeled jointly. Kaplan–Meier analyses for survival free of (A) persistent orthostatism and (B) persistent urinary incontinence in trajectory-groups identified using group-based trajectory models simultaneously considering UPDRS-III total score, Hoehn & Yahr (H&Y) stage, and Mini-Mental Status Exam (MMSE) score. Trajectories were modeled jointly with the predictors: sex, age at motor-symptom onset, education-years, pesticide exposure, head injury, diabetes, REM-behavior sleep disorder, family history (Parkinson’s disease, dementia, or tremor), and initial presentation (tremor-predominant, akinetic/rigid predominant). The at-risk table beneath each plot shows the number at-risk at each time point, with the number of failed (outcome reached) events listed in parentheses. Log-rank test results are shown. Asterisks identify pairs of trajectory-groups where outcomes differ in pairwise log-rank tests with a Bonferroni-corrected p < 0.05 (*), p < 0.01 (**), or p < 0.001 (***). All outcomes are similar in Groups 2 and 3, which show intermediate and severe trajectories, respectively, but poorer than Group 1, which shows trajectories that are more benign.

References

    1. Aleksovski D., Miljkovic D., Bravi D., Antonini A. (2018). Disease progression in Parkinson subtypes: the PPMI dataset. Neurol. Sci. 39, 1971–1976. doi: 10.1007/s10072-018-3522-z - DOI - PubMed
    1. Bartl M., Dakna M., Schade S., Wicke T., Lang E., Ebentheuer J., et al. (2022). Longitudinal change and progression indicators using the movement disorder society-unified Parkinson's disease rating scale in two independent cohorts with early Parkinson's disease. J. Parkinsons Dis. 12, 437–452. doi: 10.3233/JPD-212860 - DOI - PubMed
    1. Berg D., Borghammer P., Fereshtehnejad S. M., Heinzel S., Horsager J., Schaeffer E., et al. (2021). Prodromal Parkinson disease subtypes – key to understanding heterogeneity. Nat. Rev. Neurol. 17, 349–361. doi: 10.1038/s41582-021-00486-9 - DOI - PubMed
    1. Borghammer P. (2023). The brain-first vs. body-first model of Parkinson's disease with comparison to alternative models. J. Neural Transm. (Vienna) 130, 737–753. doi: 10.1007/s00702-023-02633-6 - DOI - PubMed
    1. Bower J. H., Maraganore D. M., McDonnell S. K., Rocca W. A. (2000). Influence of strict, intermediate, and broad diagnostic criteria on the age- and sex-specific incidence of Parkinson's disease. Mov. Disord. 15, 819–825. doi: 10.1002/1531-8257(200009)15:5<819::aid-mds1009>3.0.co;2-p - DOI - PubMed

LinkOut - more resources