. 2023 Sep 29:14:1226615.
doi: 10.3389/fendo.2023.1226615. eCollection 2023.

Transcriptional signature of islet neogenesis-associated protein peptide-treated rat pancreatic islets reveals induction of novel long non-coding RNAs

Affiliations

Transcriptional signature of islet neogenesis-associated protein peptide-treated rat pancreatic islets reveals induction of novel long non-coding RNAs

Agustín Romero et al. Front Endocrinol (Lausanne). .

Abstract

Background: Diabetes mellitus is characterized by chronic hyperglycemia with loss of β-cell function and mass. An attractive therapeutic approach to treat patients with diabetes in a non-invasive way is to harness the innate regenerative potential of the pancreas. The Islet Neogenesis-Associated Protein pentadecapeptide (INGAP-PP) has been shown to induce β-cell regeneration and improve their function in rodents. To investigate its possible mechanism of action, we report here the global transcriptional effects induced by the short-term INGAP-PP in vitro treatment of adult rat pancreatic islets.

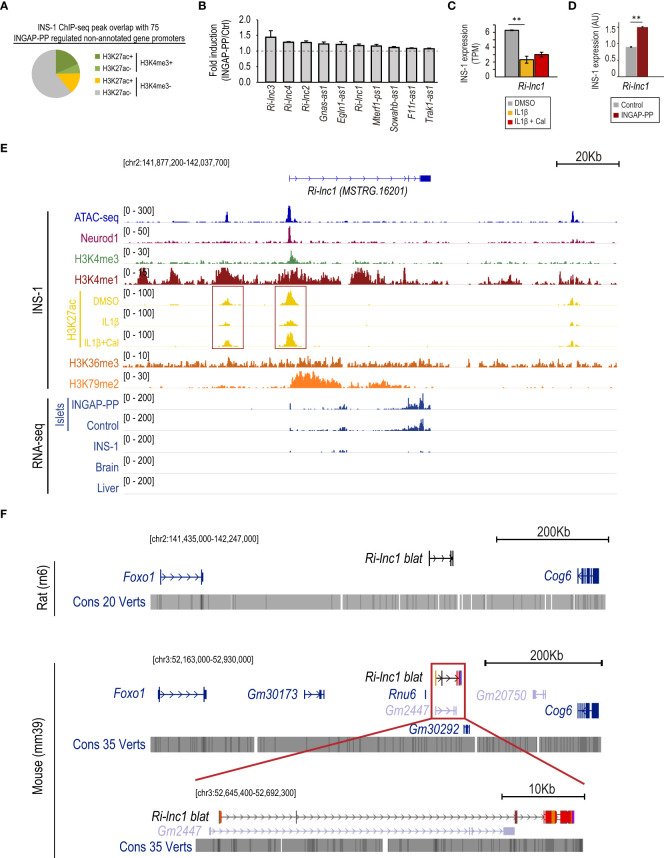
Methods and findings: Rat pancreatic islets were cultured in vitro in the presence of INGAP-PP for 4 days, and RNA-seq was generated from triplicate treated and control islet samples. We performed a de novo rat gene annotation based on the alignment of RNA-seq reads. The list of INGAP-PP-regulated genes was integrated with epigenomic data. Using the new gene annotation generated in this work, we quantified RNA-seq data profiled in INS-1 cells treated with IL1β, IL1β+Calcipotriol (a vitamin D agonist) or vehicle, and single-cell RNA-seq data profiled in rat pancreatic islets. We found 1,669 differentially expressed genes by INGAP-PP treatment, including dozens of previously unannotated rat transcripts. Genes differentially expressed by the INGAP-PP treatment included a subset of upregulated transcripts that are associated with vitamin D receptor activation. Supported by epigenomic and single-cell RNA-seq data, we identified 9 previously unannotated long noncoding RNAs (lncRNAs) upregulated by INGAP-PP, some of which are also differentially regulated by IL1β and vitamin D in β-cells. These include Ri-lnc1, which is enriched in mature β-cells.

Conclusions: Our results reveal the transcriptional program that could explain the enhancement of INGAP-PP-mediated physiological effects on β-cell mass and function. We identified novel lncRNAs that are induced by INGAP-PP in rat islets, some of which are selectively expressed in pancreatic β-cells and downregulated by IL1β treatment of INS-1 cells. Our results suggest a relevant function for Ri-lnc1 in β-cells. These findings are expected to provide the basis for a deeper understanding of islet translational results from rodents to humans, with the ultimate goal of designing new therapies for people with diabetes.

Keywords: INGAP; Ri-lnc1; beta cell (β-cell); islet; long noncoding RNA (IncRNA); pancreas; rat; regeneration.


Conflict of interest statement

The authors declare that the research was conducted in the absence of any commercial or financial relationships that could be construed as a potential conflict of interest.

Figures

Figure 1
Figure 1
Analysis of the pancreatic islet transcriptional response to the INGAP-PP treatment. (A) Experimental design. (B) Insulin secretion in response to 3.3 and 16.7 mM glucose after in vitro INGAP-PP treatment of rat pancreatic islets. Insulin released into the incubation media was measured by RIA in biological triplicates and it was expressed as ng of insulin per µgDNA/1 h. Bars represent means ± SEM from three independent measurements made for each treatment replicate using medium samples obtained from different islet aliquots. *p<0.05; NS, Not significant. (C) Functional annotation of the INGAP-PP-regulated genes. p<0.05 for all categories shown. (D) Circus plot showing the association of genes with its corresponding functional annotations. (E) Average gene expression fold enrichment for top enriched genes in selected annotations shown in (C) Bars represent means ± SEM. (F) Selected Gene Set Enrichment Analysis (GSEA) results. All results presented are significant, considering a p<0.05 and FDR< 0.25. (G) Heatmap depicting the Leading Edge Analysis of the top enriched GSEA categories related to the expression of ECM proteins reveals a large overlap in the genes associated with these categories.
Figure 2
Figure 2
Integrated analysis of the INGAP-PP-regulated genes with epigenomic data profiled in INS-1. (A) INS-1 H3K4me3 ChIP-seq peak overlaps with promoters of the 1,669 INGAP-PP-regulated genes. (B) Schematic depicting enhancer association to their closest gene promoters. (C) Clustered heatmap showing normalized H3K4me3, H3K4me1 and H3K27ac ChIP-seq signals in untreated INS-1 cells within a 6Kb window centered at the ATAC-seq summits of the potential INGAP-PP enhancer effectors. (D) Aggregation plots showing H3K4me3, H3K4me1 and H3K27ac ChIP-seq signal enrichments centered (+/- 3Kb) at the INS-1 ATAC-seq summits for active (high), active (low) and poised INS-1 enhancers associated to the promoters of INGAP-PP-regulated genes. (E) Selected top de novo-motifs recovered from active (high), active (low) and poised INS-1 enhancers shown in (C). (F) Average gene expression fold enrichment in rat pancreatic islets for genes coding for the transcription factors shown in (E). Bars represent means ± SEM. Data taken from RNA-seq TPM profiles. *p<0.05, ***p<1E-12 calculated using a linear mixed effect model (F) or with HOMER (E).
Figure 3
Figure 3
INGAP-PP upregulates a subset of genes associated with the β-cell protective effects of vitamin D against IL1β-induced stress. (A) INGAP-PP-regulated genes with H3K4me3 signal in INS-1 overlap with transcripts that are upregulated by the IL1β+calcipotriol (Cal) treatment. (B, C) Expression pattern of the genes upregulated by the IL1β+Cal treatment in INS-1 cells in: (B) INS-1 cells treated with either IL1β, IL1β+Cal, or control (DMSO), and (C) INGAP-PP-treated rat pancreatic islet replicates. The boxes show the IQR of RNA levels, whiskers extend to 1.5 times the IQR or extreme values and notches indicate 95% confidence intervals of the median. (D) Aggregation plots showing H3K27ac ChIP-seq signal enrichments, profiled in INS-1 cells treated with either IL1β, IL1β+Cal, or control (DMSO), centered (+/- 3Kb) at the “INGAP-PP enhancer effectors” associated with the gene subset defined as in (A). (E) Mlxipl and Notch1 expression is downregulated by IL1β in INS-1 cells, but its expression is restored by the IL1β+ Cal treatment. (F) Integrative Genomic Viewer screenshot showing the epigenomic profile at the Mlxipl loci. The genomic region visualized is shown in square brackets. Red boxes indicate the gene promoter and potential enhancer regions. (G) Mlxipl and Notch1 expression is upregulated in INS-1 by INGAP-PP treatment. RT-qPCR data is normalized to Actin gene expression (n=4 biological replicates). Unless otherwise specified, data are expressed as mean ± SEM. *p<0.05, **p<0.01 by Wilcoxon rank-sum test (B, C), EdgeR (E) or t-test (G).
Figure 4
Figure 4
INGAP-PP induces the expression of genes previously unannotated in the rat genome. (A) INS-1 H3K4me3 and H3K27ac ChIP-seq peak overlap with the promoters of non-annotated genes regulated by the INGAP-PP treatment in rat pancreatic islets. (B) Average gene expression fold enrichment in rat pancreatic islets for selected previously unannotated genes regulated by INGAP-PP. Data taken from RNA-seq TPM profiles. (C) Ri-lnc1 expression is downregulated by IL1β in INS-1 cells, and its expression is not restored by the IL1β+Cal treatment. The data is presented as the average plus standard error of TPM values derived from the duplicate RNA-seq samples analyzed in this study. (D) Ri-lnc1 expression is upregulated in INS-1 cells following INGAP-PP treatment. The RT-qPCR data is normalized to Actin gene expression and expressed in arbitrary units (AU), representing the average plus standard error calculated from biological replicates (n=4). (E) Integrative Genomic Viewer screenshot showing the epigenomic profile (in untreated INS-1 cells) and the RNA-seq pile-up signal for islet, brain and liver samples analyzed in this study. Most of the non-annotated transcripts with active promoters in INS-1 also show H3K36me3 and H3K79me2 enrichments along the gene bodies, consistently with actively transcribed genes. Red boxes indicate the gene promoter and potential enhancer regions. (F) UCSC Genome Browser screenshots of the MSTRG.16201 (Ri-lnc1) locus showing the neighbor genes identified in the NCBI Rattus Norvegicus Annotation Release 106 and the NCBI Mus musculus Annotation Release 109. The location of MSTRG.16201, mapped by the Blat tool of the Genome Browser, is shown in black (in contrast to the validated or predicted genes, shown in blue or light blue, respectively). Dark red regions within the MSTRG.16201 blat results projected in the mouse genome indicate non-conserved nucleotide sequences. The genomic regions visualized in panels (D, E) are shown in square brackets. Unless otherwise specified, data are expressed as mean ± SEM. **p<0.01 by EdgeR (C) or t-test (D).
Figure 5
Figure 5
Ri-lnc1 is associated with the subset of mature β-cells. (A) UMAP plot of 37,769 single cell transcriptomes profiled from oleate (Ol), palmitate (Pal) or vehicle (Veh) treated rat pancreatic islets (37). Colors in the UMAP highlight clustering into the main islet cell subtypes. (B) Dot plot showing the expression of key endocrine, mesenchymal or immune cell type markers used to name clusters in (A). Color intensity indicates mean expression (normalized) in a cluster, and dot size indicates the proportion of cells in a cluster expressing the gene. (C) Feature plots showing enriched expression of Ins2, Gcg and Sst in the β, α and δ cell clusters, respectively. Ri-lnc1 is also enriched in the β-cell cluster. (D) UMAP plot of 28,894 single-cell transcriptomes taken from the β-cell subset in (A). Colors in the UMAP highlight clustering into 3 different levels of Ri-lnc1 expression. (E) Dot plot showing the expression of selected markers enriched in each cluster. Color intensity indicates mean expression (normalized) in a cluster, dot size indicates the proportion of cells in a cluster expressing the gene. (F) Violin plots showing expression for well-known mature β-cell markers Ucn3, Slc2a2 and Mafa, as well as Ri-lnc1, in β-cells clustered as in (D). # indicates that this gene is a differential marker between the Ri-lnc1 High and Low clusters. (G) Functional annotation of the marker genes for Ri-lnc1 high and low range expression clusters. (H) Percentage of each β-cell cluster over the total β-cells for each islet treatment condition. *p<0.05, **p<0.01, calculated by t-test. NS, not significant.

Similar articles

References

    1. Skyler JS, Bakris GL, Bonifacio E, Darsow T, Eckel RH, Groop L, et al. . Differentiation of diabetes by pathophysiology, natural history, and prognosis. Diabetes (2017) 66:241–55. doi: 10.2337/db16-0806 - DOI - PMC - PubMed
    1. Gruessner RW, Gruessner AC. The current state of pancreas transplantation. Nat Rev Endocrinol (2013) 9:555–62. doi: 10.1038/nrendo.2013.138 - DOI - PubMed
    1. Zhou Q, Melton DA. Pancreas regeneration. Nature (2018) 557:351–8. doi: 10.1038/s41586-018-0088-0 - DOI - PMC - PubMed
    1. Nair GG, Tzanakakis ES, Hebrok M. Emerging routes to the generation of functional β-cells for diabetes mellitus cell therapy. Nat Rev Endocrinol (2021) 16:506–18. doi: 10.1038/s41574-020-0375-3 - DOI - PMC - PubMed
    1. Aguayo-Mazzucato C, Bonner-Weir S. Pancreatic beta cell regeneration as a possible therapy for diabetes. Cell Metab (2018) 27:57–67. doi: 10.1016/j.cmet.2017.08.007 - DOI - PMC - PubMed

MeSH terms