

Diagnostic Accuracy of Corneal and Epithelial Thickness Map Parameters to Detect Keratoconus and Suspect Keratoconus
- PMID: 37842327
- PMCID: PMC10575749
- DOI: 10.1155/2023/6677932
Diagnostic Accuracy of Corneal and Epithelial Thickness Map Parameters to Detect Keratoconus and Suspect Keratoconus
Abstract
Aim: To establish the diagnostic accuracy of corneal and epithelial thickness measurements obtained by spectral-domain optical coherence tomography (SD-OCT) in detecting keratoconus (KC) and suspect keratoconus (SKC).
Methods: This retrospective study reviewed the data of 144 eyes separated into three groups by the Sirius automated corneal classification software: normal (N) (n = 65), SKC (n = 43), and KC (n = 36). Corneal thickness (CT) and epithelial thickness (ET) in the central (0-2 mm) and paracentral (2-5 mm) zones were obtained with the Cirrus high-definition OCT. Areas under the curve (AUC) of receiver operator characteristic (ROC) curves were compared across groups to estimate their discrimination capacity.
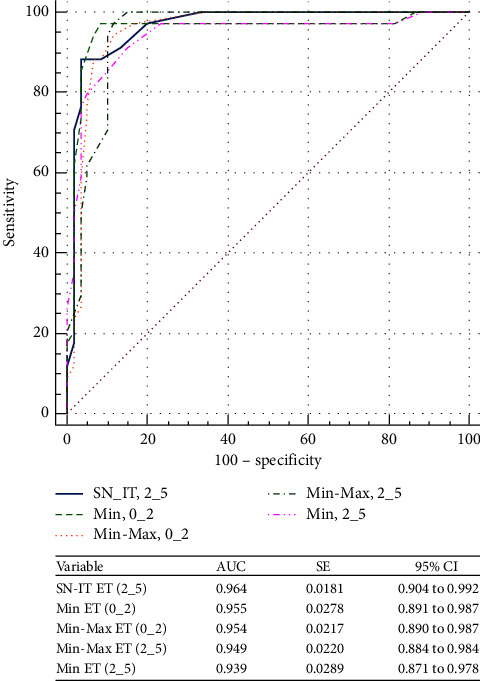
Results: ROC curve analysis revealed excellent predictive ability for ET variables: minimum (Min) ET (0_2), minimum-maximum (Min-Max) ET (0_2), superonasal-inferotemporal (SN-IT) ET (2_5), Min-Max ET (2_5), and Min ET (2_5) to detect keratoconus (AUC > 0.9, all). Min-Max CT (0_2) was the only CT parameter with excellent ability to discriminate between KC and N eyes (AUC = 0.94; cutoff = ≤-32 μm). However, both ET and CT variables were not strong enough (AUC < 0.8, all) to differentiate between SKC and N eyes, with the highest diagnostic power for Min-Max ET (2_5) (AUC = 0.71; cutoff = ≤-9 μm) and central corneal thickness (CCT) (AUC = 0.76; cutoff = ≤533 μm).
Conclusion: These results demonstrate that OCT-derived CT and ET are able to differentiate between KC and N eyes, with a high level of certainty. However, Min-Max ET (2_5) was the parameter with the highest ability to detect suspect keratoconus.
Copyright © 2023 Abdelrahman Salman et al.
Conflict of interest statement
The authors declare that they have no conflicts of interest.
Figures


Similar articles
-
The Combined Utilization of Epithelial Thickness and Tomographic Parameters in Keratoconus Detection.J Ophthalmol. 2025 Mar 18;2025:6647993. doi: 10.1155/joph/6647993. eCollection 2025. J Ophthalmol. 2025. PMID: 40134610 Free PMC article.
-
[The study of corneal epithelial change in keratoconic eyes with Fourier-domain optical coherence tomographic pachymetry].Zhonghua Yan Ke Za Zhi. 2014 Sep;50(9):665-70. Zhonghua Yan Ke Za Zhi. 2014. PMID: 25533557 Chinese.
-
Evaluation of Anterior and Posterior Corneal Higher Order Aberrations for the Detection of Keratoconus and Suspect Keratoconus.Tomography. 2022 Dec 2;8(6):2864-2873. doi: 10.3390/tomography8060240. Tomography. 2022. PMID: 36548532 Free PMC article.
-
Corneal epithelial thickness mapping by Fourier-domain optical coherence tomography in normal and keratoconic eyes.Ophthalmology. 2012 Dec;119(12):2425-33. doi: 10.1016/j.ophtha.2012.06.023. Epub 2012 Aug 20. Ophthalmology. 2012. PMID: 22917888 Free PMC article.
-
Epithelial Mapping Efficacy for Subclinical Keratoconus Identification.Am J Ophthalmol. 2025 Jun;274:209-220. doi: 10.1016/j.ajo.2025.02.042. Epub 2025 Mar 6. Am J Ophthalmol. 2025. PMID: 40057010
Cited by
-
The Combined Utilization of Epithelial Thickness and Tomographic Parameters in Keratoconus Detection.J Ophthalmol. 2025 Mar 18;2025:6647993. doi: 10.1155/joph/6647993. eCollection 2025. J Ophthalmol. 2025. PMID: 40134610 Free PMC article.
-
Safety and efficacy of simultaneous photorefractive keratectomy and corneal cross-linking in managing suspected keratoconus.Indian J Ophthalmol. 2025 Jul 1;73(7):959-965. doi: 10.4103/IJO.IJO_1941_24. Epub 2025 Apr 17. Indian J Ophthalmol. 2025. PMID: 40243075 Free PMC article.
-
Effects and safety of combined corneal collagen crosslinking and intrastromal corneal ring segment treatment in patients with keratoconus: a retrospective study.BMC Ophthalmol. 2024 Oct 30;24(1):473. doi: 10.1186/s12886-024-03745-7. BMC Ophthalmol. 2024. PMID: 39478495 Free PMC article.
-
Repeatability of Corneal Epithelial Thickness Map Using Anterior-Segment Optical Coherence Tomography in Normal and Corneal Disease Patients.Korean J Ophthalmol. 2024 Dec;38(6):496-506. doi: 10.3341/kjo.2024.0115. Epub 2024 Oct 22. Korean J Ophthalmol. 2024. PMID: 39434576 Free PMC article.
-
Multi-modal imaging for the detection of early keratoconus: a narrative review.Eye Vis (Lond). 2024 May 11;11(1):18. doi: 10.1186/s40662-024-00386-1. Eye Vis (Lond). 2024. PMID: 38730479 Free PMC article. Review.
References
LinkOut - more resources
Full Text Sources
