. 2023 Nov 27;51(21):11584-11599.
doi: 10.1093/nar/gkad858.

Hypoxia-induced transcriptional stress is mediated by ROS-induced R-loops

Affiliations

Hypoxia-induced transcriptional stress is mediated by ROS-induced R-loops

Tiffany S Ma et al. Nucleic Acids Res. .

Abstract

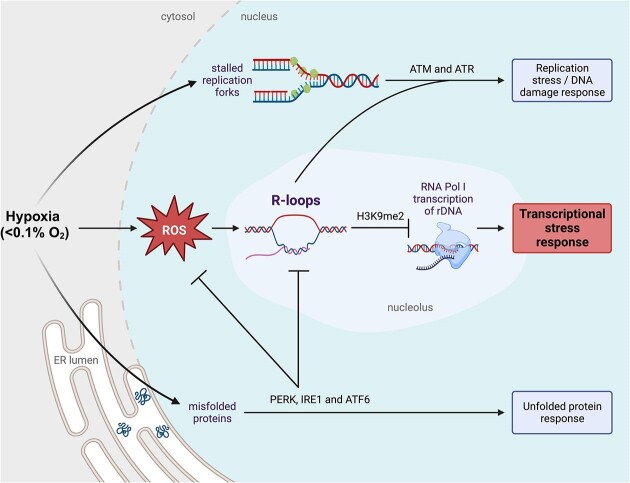
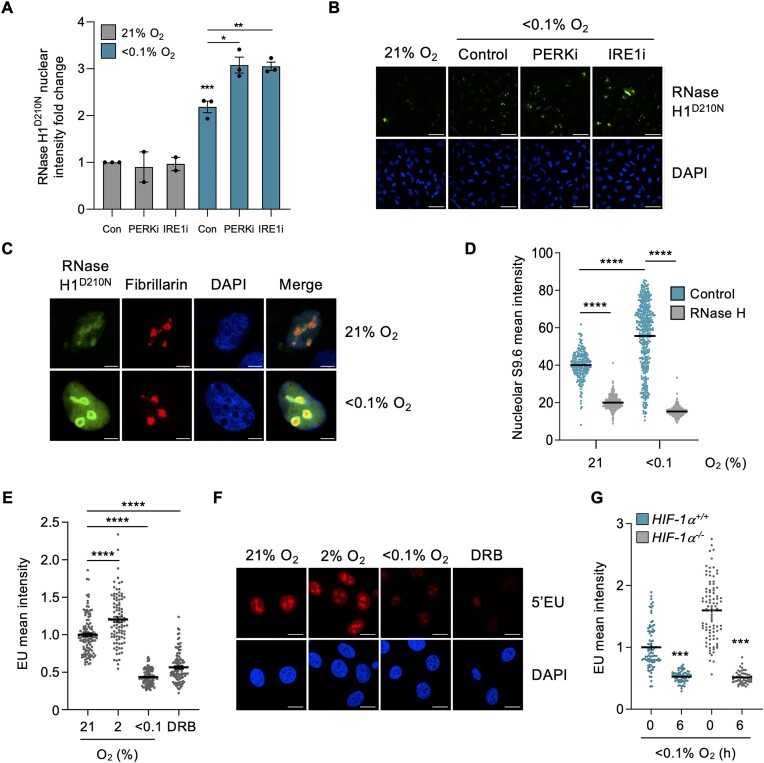
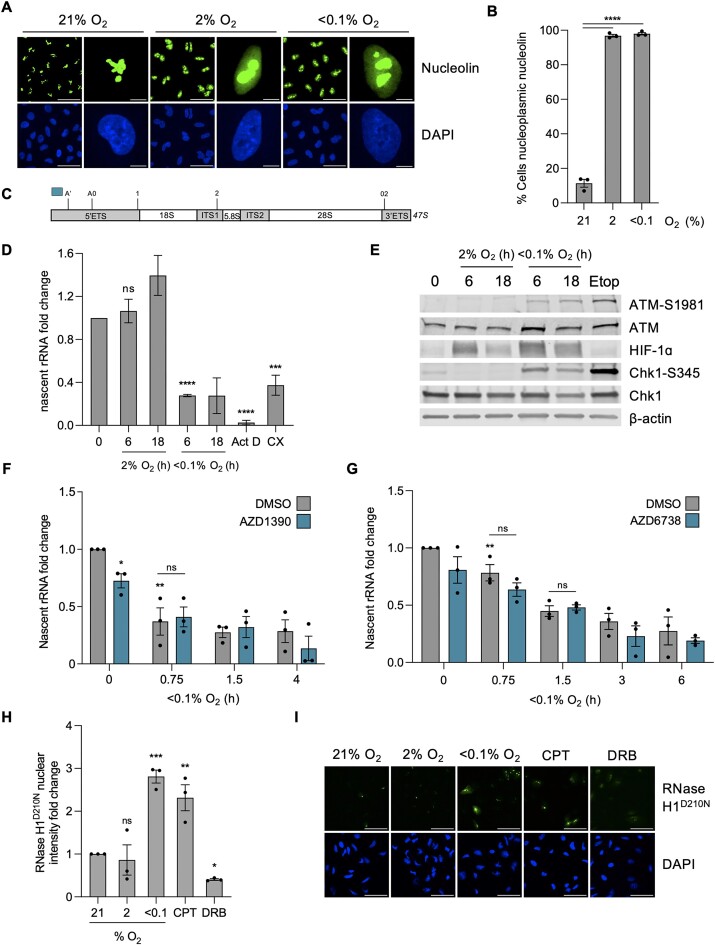
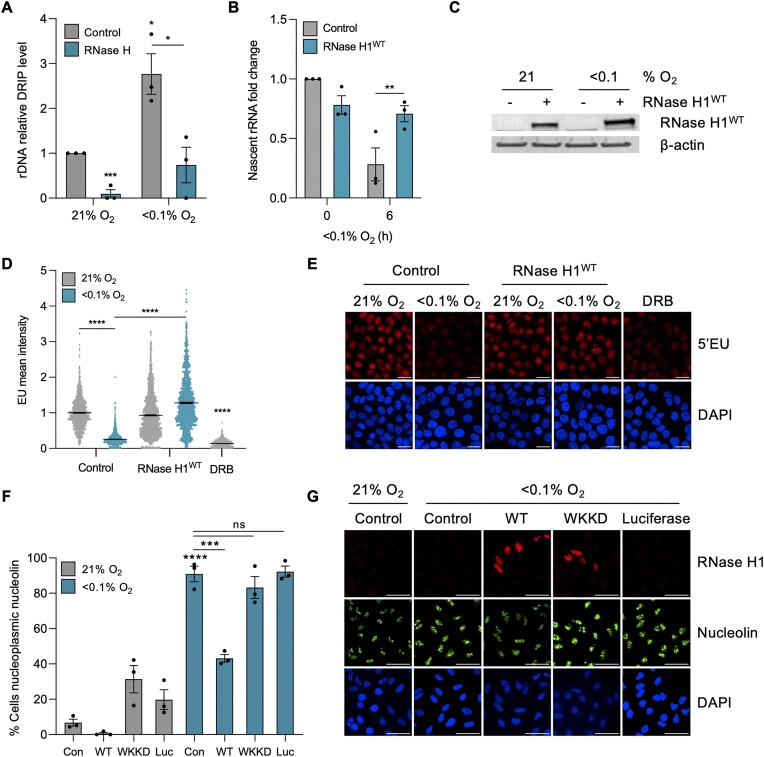
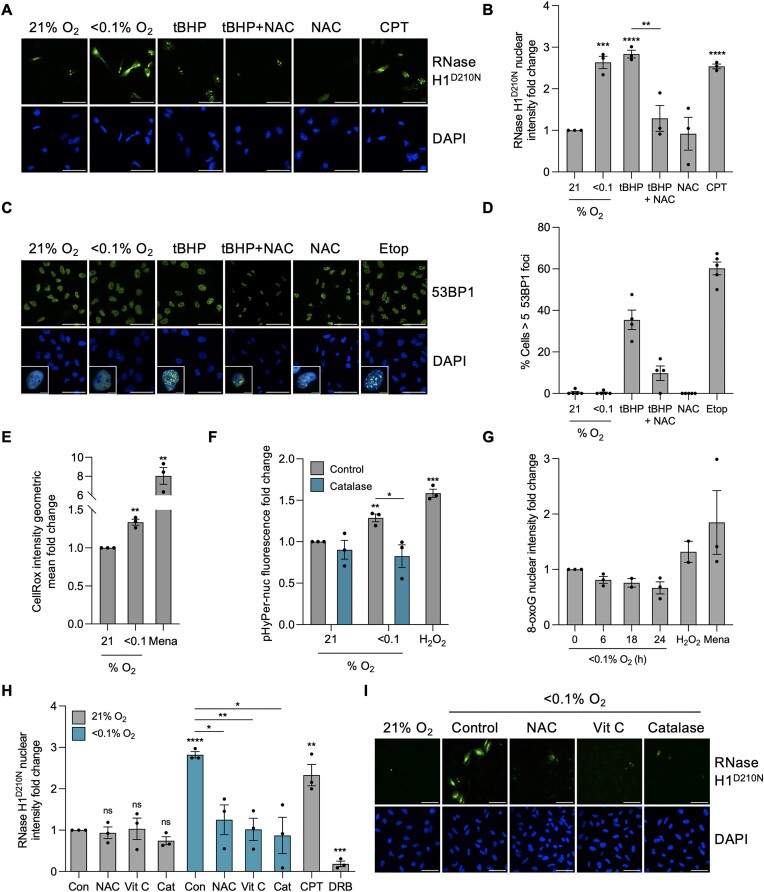
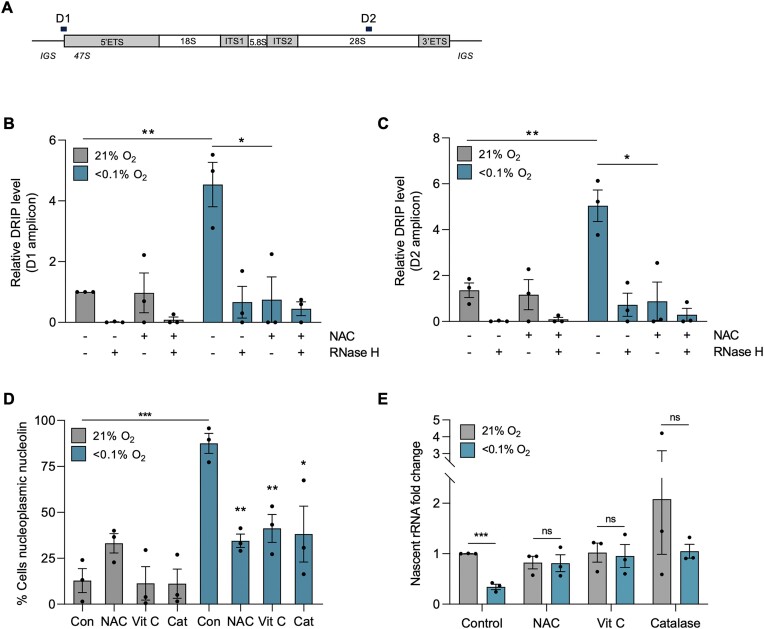
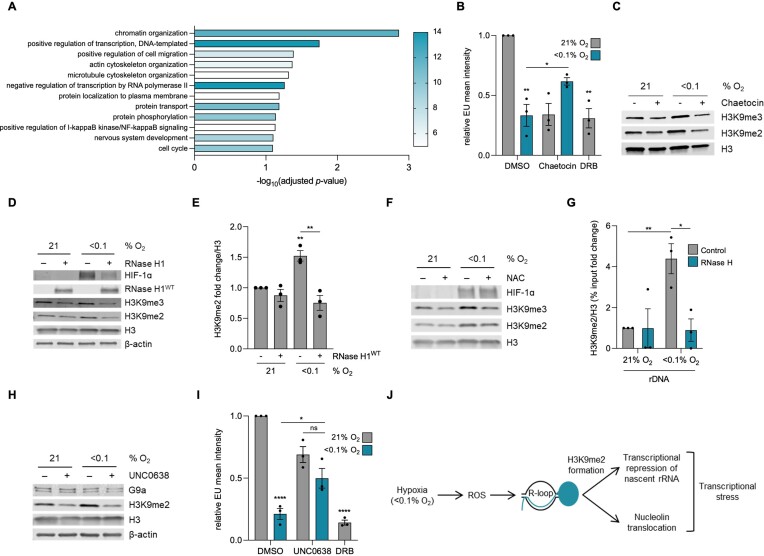
Hypoxia is a common feature of solid tumors and is associated with poor patient prognosis, therapy resistance and metastasis. Radiobiological hypoxia (<0.1% O2) is one of the few physiologically relevant stresses that activates both the replication stress/DNA damage response and the unfolded protein response. Recently, we found that hypoxia also leads to the robust accumulation of R-loops, which led us to question here both the mechanism and consequence of hypoxia-induced R-loops. Interestingly, we found that the mechanism of R-loop accumulation in hypoxia is dependent on non-DNA damaging levels of reactive oxygen species. We show that hypoxia-induced R-loops play a critical role in the transcriptional stress response, evidenced by the repression of ribosomal RNA synthesis and the translocation of nucleolin from the nucleolus into the nucleoplasm. Upon depletion of R-loops, we observed a rescue of both rRNA transcription and nucleolin translocation in hypoxia. Mechanistically, R-loops accumulate on the rDNA in hypoxia and promote the deposition of heterochromatic H3K9me2 which leads to the inhibition of Pol I-mediated transcription of rRNA. These data highlight a novel mechanistic insight into the hypoxia-induced transcriptional stress response through the ROS-R-loop-H3K9me2 axis. Overall, this study highlights the contribution of transcriptional stress to hypoxia-mediated tumorigenesis.


Figures

Graphical Abstract
Graphical Abstract
Figure 1.
Figure 1.
R-loops accumulate in the nucleoli of hypoxic cells despite reduced transcription rates. (A) A549 cells were transfected with V5-tagged RNase H1D210N and exposed to 21 or <0.1% O2 (6 h) with or without a UPR inhibitor: PERK inhibitor (AMG PERK 44, 20 μM) or IRE1α inhibitor (4μ8c, 20 μM). Staining for V5 was carried out and nuclear intensity determined. Each data point represents the average from one of three biological repeats. (B) Representative images from part A. Scale bar represents 50 μM. (C) A549 cells were transfected with V5-tagged RNase H1D210N and exposed to 21 or <0.1% O2 (6 h). Cells were fixed and co-stained for V5 (green), the nucleolar marker fibrillarin (red) and DAPI (blue). Scale bar represents 5 μM. n= 1 Images of a field of view shown in Supplementary Figure S1E. (D) HCT116 cells were exposed to 21 or <0.1% O2 (1.5 h), fixed and co-stained for nucleolin and R-loops using the S9.6 antibody. Where indicated, coverslips were treated with recombinant RNase H. The mean nucleolar intensity of S9.6 staining per cell was determined. Representative images are shown in Supplementary Figure S1F. (E) HCT116 cells were exposed to 21, 2 or <0.1% O2 (6 h) and labeled with 5′EU (0.5 mM). The mean nuclear intensity of 5′EU per cell was quantified. DRB (100 μM, 6 h), a global transcriptional inhibitor, was used as a control. (F) Representative images from part E. Scale bar represents 10 μM. (G) HCT116 and HCT116HIF-1α-/- cells were exposed to 21 or <0.1% O2 (6 h) and labeled with 5′EU (0.5 mM). The mean nuclear intensity of 5′EU per cell was quantified. HIF-1α knockout was confirmed in Supplementary Figure S1I. (A–G) Data from three independent experiments (n= 3), mean ± standard error of the mean (SEM) are displayed unless otherwise indicated. * P < 0.05, ** P < 0.01, *** P < 0.001, **** P < 0.0001, ns (non-significant) P > 0.05. Unless otherwise indicated statistical significance refers to comparison to the normoxic control. In parts (D, E and G), each dot represents a cell. A minimum of 100 cells was imaged per condition in all microscopy experiments. The two-tailed, unpaired Student's t-test was used in parts (A, D, E and G).
Figure 2.
Figure 2.
Hypoxia (<0.1% O2) leads to transcriptional stress independently of the DDR (A) A549 cells were exposed to 21, 2 or <0.1% O2 (6 h), fixed and stained for nucleolin (green) and DAPI (blue). Scale bar in field of view represents 50 μM. Scale bar in enlarged cell represents 5 μM. (B) Quantification of the percentage of cells with nucleoplasmic nucleolin from part (A). (C) Schematic of the initial product of RNPI transcription, 47S rRNA precursor. Initial cleavages occur at the A’ site in the 5′ETS (5′ externally transcribed spacer) region and at 02 site in the 3′ETS (3′ externally transcribed spacer) region before further cleavage (at sites A0, 1 and 2) and processing of the transcript, generating the mature 18, 28 and 5.8S. Blue bar indicates the amplicon from primers used to measure nascent 47S rRNA precursor levels, used subsequently in parts (D), (F) and (G). (D) HCT116 cells were exposed to 21, 2 or <0.1% O2 for the times indicated followed by RT-qPCR for the nascent 47S rRNA precursor. The rDNA transcription inhibitors Actinomycin D (Act D, 40 nM, 6 h) and CX5461 (CX, 100 nM, 6 h) were used as controls. (E) HCT116 cells were exposed to 21, 2 or <0.1% O2, for the times indicated, or etoposide (Etop) (25 μM, 6 h) followed by western blotting. β-Actin was used as a loading control. (F) HCT116 cells were pre-treated with ATM inhibitor AZD1390 (10 μM, 1 h) before being exposed to 21 or <0.1% O2 for the times indicated. RT-qPCR for the nascent 47S rRNA precursor is shown. ATM inhibition is confirmed in Supplementary Figure S2E. (G) HCT116 cells were pre-treated with ATM inhibitor AZD6738 (1 nM, 1 h) before being exposed to 21 or <0.1% O2 for the times indicated. RT-qPCR for the nascent 47S rRNA precursor is shown. ATM inhibition is confirmed in Supplementary Figure S2H. (H) A549 cells were transfected with V5-tagged RNase H1D210N and exposed to 21, 2 or <0.1% O2 (6 h). CPT (10 μM, 1 h) and DRB (100 μM, 1 h) were used as controls to increase and decrease R-loop levels, respectively. Staining for V5 was carried out and the nuclear intensity was determined. (I) Representative images for the data shown in part H. V5 (green) and DAPI (blue) are shown. Scale bar represents 50 μM. (A–I) Data from three independent experiments (n= 3), mean ± standard error of the mean (SEM) are displayed unless otherwise indicated. * P < 0.05, ** P < 0.01, *** P < 0.001, **** P < 0.0001, ns (non-significant) P > 0.05. Unless otherwise indicated statistical significance refers to comparison to the normoxic control. In parts (B), (D), (F)–(H), each data point represents the average from one of three biological repeats, normalized to the untreated sample. A minimum of 100 cells was imaged per condition in all microscopy experiments. The two-tailed, unpaired Student's t-test was used in parts (B), (D), (F)–(H).
Figure 3.
Figure 3.
Hypoxia-induced transcriptional stress is R-loop dependent. (A) DRIP-qPCR analysis of A549 cells exposed to 21 or <0.1% O2 (6 h). Treatment with recombinant RNase H was used to confirm R-loop specificity. Values were normalized to the normoxic control sample. DRIP-qPCR ‘D1’ amplicon was used to analyze the promoter region of rDNA, as shown in S3A. (B) HCT116 cells were transfected with mock (control) or V5-tagged RNase H1WT and exposed to 21 or <0.1% O2 (6 h). RT-qPCR for the nascent 47S rRNA precursor 47S is shown. Primers used to analyze the blue amplicon shown in Figure 2C were used. (C) HCT116 cells were transfected with mock (control) or V5-tagged RNase H1WT and exposed to 21 or <0.1% O2 (6 h). RNase H1 over-expression was confirmed by western blot analysis. β-Actin was used as a loading control. (D) HCT116 cells were transfected with mock (control) or V5-tagged RNase H1WT, exposed to 21 or <0.1% O2 (6 h) and labeled with 5′EU (0.5 mM). The mean nuclear intensity of 5′EU per cell was quantified. DRB (100 μM, 1 h) was used as a control. The horizontal black bars represent the mean value, and each dot is one cell. (E) Representative images from part D showing EU (red) and DAPI (blue). Scale bar represents 20 μM. (F) A549 cells were transfected with mock (control), RNase H1WT, RNase H1WKKD or Luciferase (Luc), exposed to 21 or <0.1% O2 (6 h), fixed and stained for nucleolin. The percentage of cells with nucleoplasmic nucleolin was quantified. (G) Representative images from part (F). V5 (red), nucleolin (green) and DAPI (blue) are shown. Scale bar represents 50 μM. (A–G) Data from three independent experiments (n= 3), mean ± standard error of the mean (SEM) are displayed unless otherwise indicated. * P < 0.05, ** P < 0.01, *** P < 0.001, **** P < 0.0001, ns (non-significant) P > 0.05. Unless otherwise indicated statistical significance refers to comparison to the normoxic control. In parts (A), (B) and (F), each data point represents the average from one of three biological repeats, normalized to the untreated sample. A minimum of 100 cells was imaged per condition in all microscopy experiments. The two-tailed, unpaired Student's t-test was used in parts (A), (B), (D) and (F).
Figure 4.
Figure 4.
R-loop accumulation in hypoxia (<0.1% O2) is ROS-dependent. (A) A549 cells were transfected with V5-tagged RNase H1D210N and exposed to 6 h of 21% O2, <0.1% O2, tBHP (20 μM), tBHP (20 μM) and NAC (20 mM), NAC (20 mM) or 1 h of CPT (10 μM). tBHP was used as a ROS-inducer, NAC was used as a ROS scavenger and CPT was used as a positive control for increasing R-loops. Cells were fixed and stained for V5 (green) and DAPI (blue). Scale bar represents 50 μM. (B) Quantification of V5-tagged RNase H1D210N nuclear intensity from part A. (C) A549 cells were exposed to 6 h of 21% O2, <0.1% O2, tBHP (20 μM), tBHP (20 μM) and NAC (20 mM), or NAC (20 mM). Etoposide (Etop, 25 μM, 6 h) was used as a positive control for DNA damage. Cells were fixed and stained for 53BP1. Scale bar represents 50 μM. n= 1. (D) Quantification of part (C). Each data point represents a field of view of cells where percentage of cells with >5 53BP1 foci were determined. At least 100 cells were imaged per condition. n= 1. (E) A549 cells were exposed to 21, <0.1 or 2% O2 (6 h) with CellRox (5 μM) added during the last 10 min of treatment. Cells were fixed and CellRox intensity was measured. Menadione (100 μM, 6 h) was used as a positive control to increase ROS. At least 10 000 cells were quantified per condition. (F) A549 cells were transfected with pHyPer-Nuc and exposed to 21, <0.1 or 2% O2 (6 h) with and without catalase (2000 U/mg). H2O2 (5 mM, 3 h) was used as a positive control. Cells were fixed and the nuclear intensity was determined. (G) A549 cells were exposed to 21 or <0.1% O2 for the times indicated. Cells were fixed and stained for 8-oxoguanine (8-oxoG), and the nuclear intensity was determined. H2O2 (5 mM, 3 h) and menadione (100 μM, 3 h) were used as positive controls. (H) A549 cells were transfected with V5-tagged RNase H1D210N, treated with or without NAC (20 mM), Vitamin C (2 mM) or catalase (2000 U/mg) then exposed to 21 or <0.1% O2 (6 h). Cells were fixed and stained for V5. (I) Representative images from part H. V5 (green) and DAPI (blue) are shown. Scale bar represents 50 μM. (A–I) Data from three independent experiments (n= 3), mean ± standard error of the mean (SEM) are displayed unless otherwise indicated. * P < 0.05, ** P < 0.01, *** P < 0.001, **** P < 0.0001, ns (non-significant) P > 0.05. Unless otherwise indicated statistical significance refers to comparison to the normoxic control. In parts (B), (E)–(H), each data point represents the average from one of three biological repeats, normalized to the untreated sample. A minimum of 100 cells was imaged per condition in all microscopy experiments. The two-tailed, unpaired Student's t-test was used in parts (B), (E), (F) and (H).
Figure 5.
Figure 5.
Hypoxia-induced transcriptional stress is ROS dependent. (A) rDNA repeat schematic with rDNA amplicons positions. D1 – 5′ rDNA promoter, D2 – 3′ 28S rRNA region. (B) DRIP-qPCR analysis of A549 cells exposed to 21 or <0.1% O2 (6 h), with and without NAC (20 mM). Treatment with recombinant RNase H was used to confirm R-loop specificity. The D1 amplicon was analyzed. Values were normalized to the normoxic control sample of D1. (C) as part B for D2 amplicon. Values were normalized to the normoxic control sample of D1. (D) A549 cells were treated with or without NAC (20 mM), Vitamin C (2 mM) or catalase (2000 U/mg), then exposed to 21 or <0.1% O2 (6 h), fixed and stained for nucleolin. The percentage of cells with nucleoplasmic nucleolin was quantified. Statistical significance is relative to the hypoxic (<0.1% O2) or normoxic (21% O2) control value. (E) A549 cells were treated with or without NAC (20 mM), Vitamin C (2 mM) or catalase (2000 U/mg) before being exposed to 21 or <0.1% O2 (6 h). RT-qPCR for the nascent 47S rRNA precursor is shown, normalized to untreated sample. (A–E) Data from three independent experiments (n= 3), mean ± standard error of the mean (SEM) are displayed unless otherwise indicated. * P < 0.05, ** P < 0.01, *** P < 0.001, **** P < 0.0001, ns (non-significant) P > 0.05. Unless otherwise indicated statistical significance refers to comparison to the normoxic control. In parts (B–E), each data point represents the average from one of three biological repeats. A minimum of 100 cells was imaged per condition in all microscopy experiments. The two-tailed, unpaired Student's t-test was used in parts (B) through (E).
Figure 6.
Figure 6.
Hypoxia-induced R-loops repress rDNA transcription by mediating H3K9me2 formation. (A) Genes with the most similar expression pattern to SETX in TCGA LUAD and LUSC datasets were analyzed using GeneCodis. The top 12 most significantly enriched pathways, from gene ontology biological pathway analysis, are shown. Color represents number of genes in the pathway. Genes in the ‘chromatin organization’ pathway are shown in Supplementary Table S2. (B) HCT116 cells were treated with DMSO or Chaetocin (1 μM), exposed to 21 or <0.1% O2 (6 h), and labeled with 5′EU (0.5 mM). The mean nuclear intensity per cell of 5′EU was quantified. DRB (100 μM, 6 h) was used as a control. Each data point represents the average 5′EU intensity from each of the three biological repeats. The two-tailed, unpaired Student's t-test was used. (C) HCT116 cells were treated with and without Chaetocin (1 μM) and exposed to 21 or <0.1% O2 (6 h), followed by western blotting. H3 was used as a loading control. Quantification of the western blot is shown in Supplementary Figure S5A, B. (D) A549 cells were transfected with mock or V5-tagged RNase H1WT and exposed to 21 or <0.1% O2 (4 h). RNase H1 over-expression was confirmed by western blot analysis. (E) Quantification of H3K9me2 from part D. The two-tailed, unpaired Student's t-test was used. Quantification of H3K9me3 is shown in Supplementary Figure S5C. (F) A549 cells were treated with NAC (20 mM) and exposed to 21 or <0.1% O2 (6 h), followed by western blotting. H3 was used as a loading control. Quantification of the western blot is shown in Supplementary Figure S5D, E. (G) ChIP-qPCR analysis of H3K9me2/H3 levels in A549 cells over-expressing RNase H1WT exposed to 21 or <0.1% O2 (6 h). The rDNA (D1) amplicon was analyzed. Values are calculated as a percentage of input, subtracted from the no antibody control value, and normalized to the D1 normoxic (21% O2) value. (H) A549 cells were pre-treated with UNC0638 (1 μM, 72 h) then exposed to 21 or <0.1% O2 (4 h) followed by western blotting. β-Actin and H3 were used as a loading control. Both the 165 kDa G9a-L and 140 kDa G9a-S isoforms are shown. (I) A549 cells were pre-treated with UNC0638 (3 μM, 20 h) then exposed to 21 or <0.1% O2 (6 h) and labeled with 5′EU (0.5 mM). The mean nuclear intensity of 5′EU was quantified. DRB (100 μM, 6 h) was used as a control. Each data point represents the average 5′EU intensity from each of the 3 biological repeats. The two-tailed, unpaired Student's t-test was used. (J) Hypoxia (<0.1% O2) leads to an increase in ROS which causes an accumulation of R-loops that contribute to the transcriptional stress response. The transcriptional stress response includes R-loop dependent translocation of nucleolin, and R-loop dependent deposition of H3K9me2 on rDNA that represses rDNA transcription. (A–J) Data from three independent experiments (n= 3), mean ± standard error of the mean (SEM) are displayed unless otherwise indicated. * P < 0.05, ** P < 0.01, *** P < 0.001, **** P < 0.0001, ns (non-significant) P > 0.05. Unless otherwise indicated statistical significance refers to comparison to the normoxic control. In parts (B), (E), (G) and (I), each data point represents the average from one of three biological repeats, normalized to the untreated sample. A minimum of 100 cells was imaged per condition in all microscopy experiments. The two-tailed, unpaired Student's t-test was used in parts (B), (E), (G) and (I).

References

    1. Singleton D.C., Macann A., Wilson W.R.. Therapeutic targeting of the hypoxic tumour microenvironment. Nat. Rev. Clin. Oncol. 2021; 18:751–772. - PubMed
    1. Arner E.N., Rathmell J.C. Metabolic programming and immune suppression in the tumor microenvironment. Cancer Cell. 2023; 41:421–433. - PMC - PubMed
    1. Bhandari V., Li C.H., Bristow R.G., Boutros P.C., Aaltonen L.A., Abascal F., Abeshouse A., Aburatani H., Adams D.J., Agrawal N.et al. .. Divergent mutational processes distinguish hypoxic and normoxic tumours. Nat. Commun. 2020; 11:737. - PMC - PubMed
    1. Hammond E.M., Asselin M.C., Forster D., O’Connor J.P., Senra J.M., Williams K.J.. The meaning, measurement and modification of hypoxia in the laboratory and the clinic. Clin. Oncol. (R. Coll. Radiol.). 2014; 26:277–288. - PubMed
    1. Bolland H., Ma T.S., Ramlee S., Ramadan K., Hammond E.M.. Links between the unfolded protein response and the DNA damage response in hypoxia: a systematic review. Biochem. Soc. Trans. 2021; 49:1251–1263. - PMC - PubMed

Publication types