. 2023 Oct 16;133(20):e168888.
doi: 10.1172/JCI168888.

SPTAN1/NUMB axis senses cell density to restrain cell growth and oncogenesis through Hippo signaling

Affiliations

SPTAN1/NUMB axis senses cell density to restrain cell growth and oncogenesis through Hippo signaling

Dongxue Su et al. J Clin Invest. .

Abstract

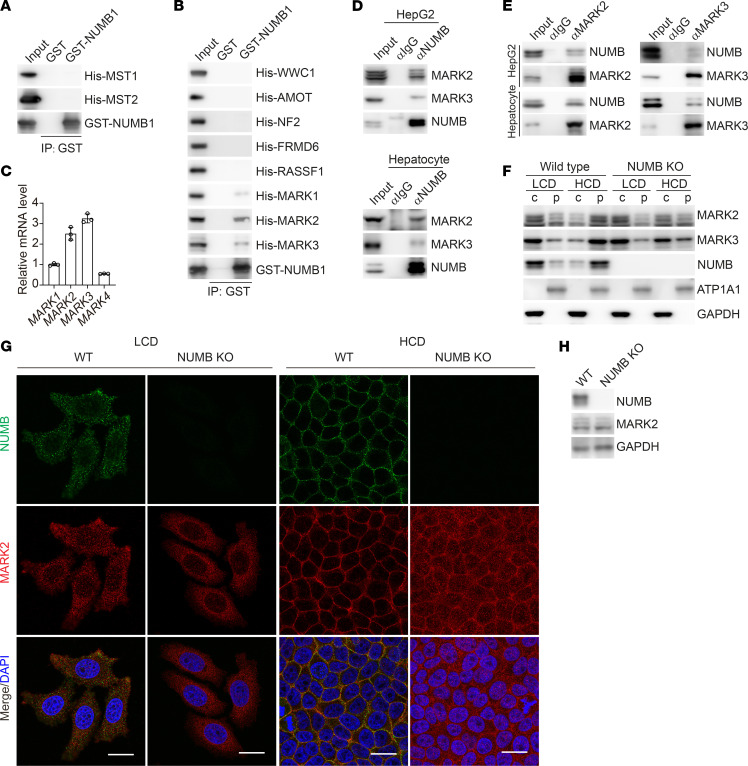
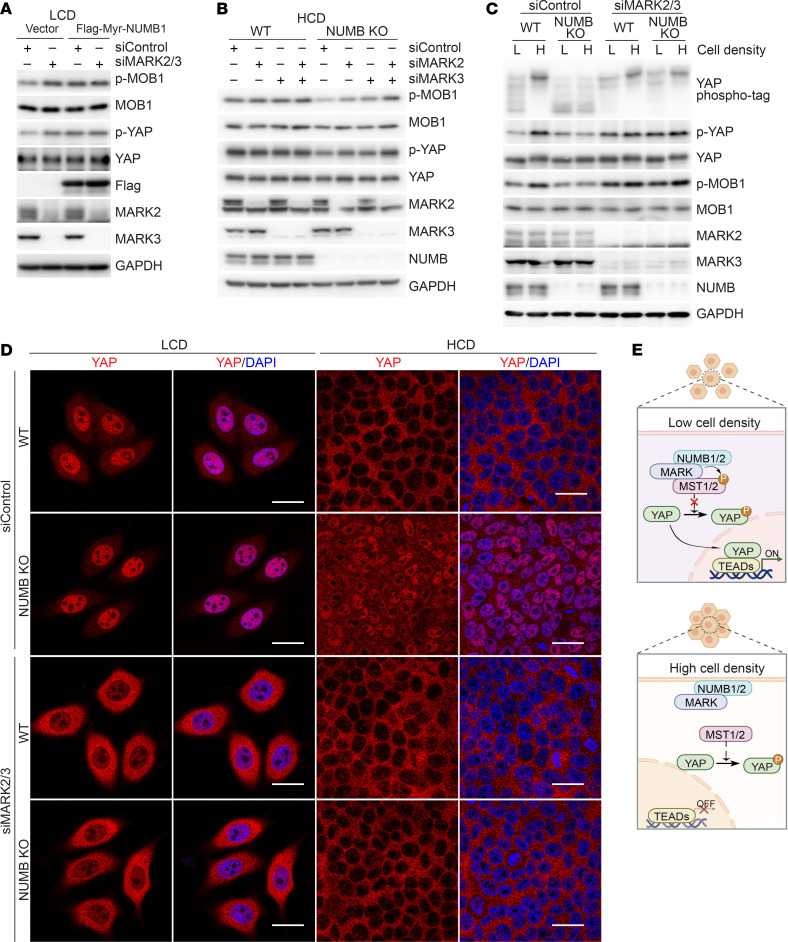
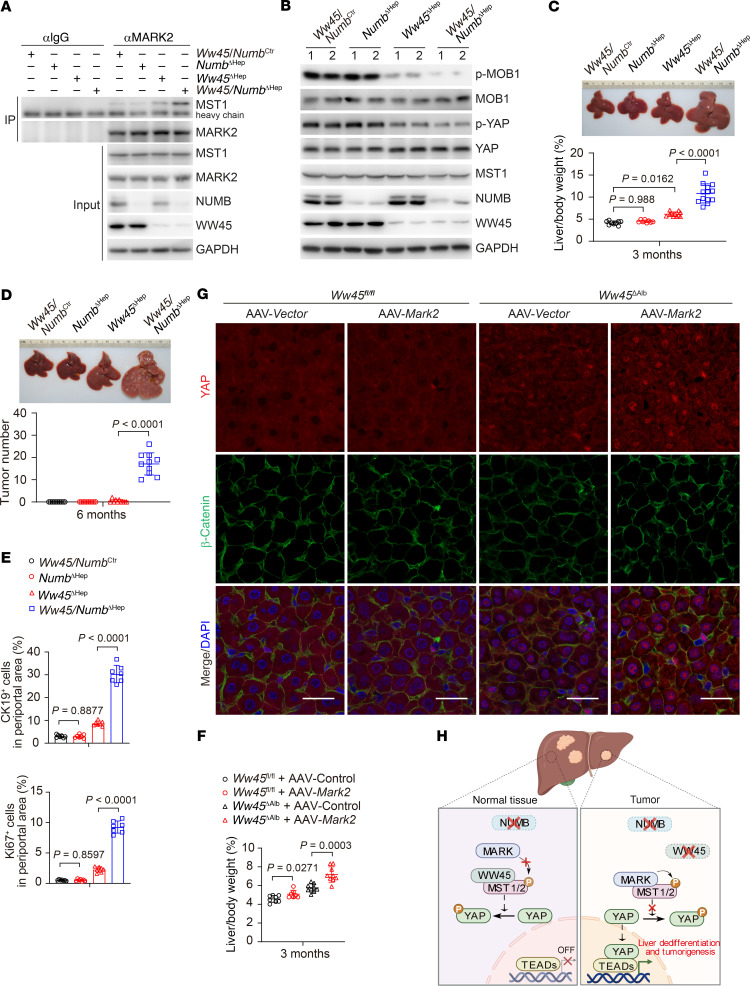
The loss of contact inhibition is a key step during carcinogenesis. The Hippo-Yes-associated protein (Hippo/YAP) pathway is an important regulator of cell growth in a cell density-dependent manner. However, how Hippo signaling senses cell density in this context remains elusive. Here, we report that high cell density induced the phosphorylation of spectrin α chain, nonerythrocytic 1 (SPTAN1), a plasma membrane-stabilizing protein, to recruit NUMB endocytic adaptor protein isoforms 1 and 2 (NUMB1/2), which further sequestered microtubule affinity-regulating kinases (MARKs) in the plasma membrane and rendered them inaccessible for phosphorylation and inhibition of the Hippo kinases sterile 20-like kinases MST1 and MST2 (MST1/2). WW45 interaction with MST1/2 was thereby enhanced, resulting in the activation of Hippo signaling to block YAP activity for cell contact inhibition. Importantly, low cell density led to SPTAN1 dephosphorylation and NUMB cytoplasmic location, along with MST1/2 inhibition and, consequently, YAP activation. Moreover, double KO of NUMB and WW45 in the liver led to appreciable organ enlargement and rapid tumorigenesis. Interestingly, NUMB isoforms 3 and 4, which have a truncated phosphotyrosine-binding (PTB) domain and are thus unable to interact with phosphorylated SPTAN1 and activate MST1/2, were selectively upregulated in liver cancer, which correlated with YAP activation. We have thus revealed a SPTAN1/NUMB1/2 axis that acts as a cell density sensor to restrain cell growth and oncogenesis by coupling external cell-cell contact signals to intracellular Hippo signaling.

Keywords: Cancer; Cell Biology; Liver cancer; Oncology; Signal transduction.


Figures

Figure 1
Figure 1. NUMB proteins sense cell density to modulate YAP activity.
(A and B) Immunoblot analysis of the indicated proteins (A) and immunofluorescence staining for YAP (B) in HepG2 cells cultured at LCD or HCD. (C) Fluorescence intensities (quantified by ImageJ) of nucleus-to-cytoplasm ratios of YAP in HepG2 cells transfected with the indicated siRNAs followed by immunofluorescence staining. (D) Immunoblot analysis of the indicated proteins in the cytoplasmic fraction (c) and the plasma membrane fraction (p) of HepG2 cells cultured at LCD or HCD. (E) Immunofluorescence staining for YAP (red) and NUMB (green) in HepG2 cells cultured at different cell densities. (F) Growth curve of WT and NUMB-KO HepG2 cells cultured at LCD or HCD. Data are presented the mean ± SD from biological triplicate experiments. P values were assessed by 2-tailed, unpaired Student’s t test. (GI) Phospho-tag and SDS-PAGE analysis (G), immunofluorescence staining (H), quantitative PCR (qPCR) analysis (I) of the indicated proteins in WT and NUMB-KO HepG2 cells cultured at LCD or HCD. Each bar represents the mean ± SD from biological triplicate experiments (C and I). Scale bars: 20 μm (B, E, and H).
Figure 2
Figure 2. NUMB1/2 alter their subcellular location to modulate YAP activity in response to cell density cues.
(A and B) Diagram of the structure of different NUMB isoforms (A) and immunofluorescence staining in HepG2 cells transfected with the indicated constructs (B). (C) Immunoblot analysis of the indicated proteins in WT and NUMB-KO HepG2 cells expressing the indicated constructs and cultured at HCD. (D) Immunofluorescence staining for YAP (red) and HA-tagged NUMB (green) in NUMB-KO HepG2 cells transfected with the indicated constructs and cultured at HCD. (E) Immunofluorescence staining for YAP (red) and Flag-tagged Myr-NUMB (green) in HepG2 cells transfected with the indicated constructs and cultured at LCD. (F) A proposed working model for how NUMB regulates Hippo/YAP signals at different cell densities. Scale bars: 20 μm (B, D and E).
Figure 3
Figure 3. SPTAN1 is required for NUMB1/2 membrane retention at HCD.
(A) Immunofluorescence staining for NUMB (red) and DAPI (blue) in HepG2 cells transfected with the indicated siRNAs and cultured at HCD. Scale bars: 20 μm. (B) Immunoblot analysis of NUMB, SPTAN1, and GAPDH in HepG2 cells transfected with the indicated siRNAs. (C) Immunofluorescence staining for NUMB (green) and SPTAN1 (red) in WT and SPTAN1-KO HepG2 cells cultured at LCD or HCD. Scale bars: 20 μm. (D) Immunoblot analysis of SPTAN1 in the cytoplasmic fraction and the plasma membrane fraction, isolated from HepG2 cells cultured at LCD or HCD.
Figure 4
Figure 4. Induced SPTAN1 phosphorylation at HCD for NUMB1/2 membrane retention.
(A and B) Whole-cell lysates from HepG2 cells cultured at different cell densities were collected for co-IP analysis. (C) Diagram of the structures of SPTAN1 and Flag-tagged truncated mutants of SPTAN1. SH3, Src homology 3 domain; EF-hand, calcium-binding motif. (DF) Immunoblot analysis of lysates from HEK293T cells cotransfected with the indicated constructs, immunoprecipitated with anti-Flag, and analyzed by immunoblotting with the indicated antibodies. (G) Phospho-tag and SDS-PAGE analysis of the indicated proteins in HepG2 cells transfected with siControl or siSPTAN1 (the mixture siRNA of siSPTAN1-1 and siSPTAN1-2) and cultured at LCD (L) or HCD (H). (H) Immunofluorescence staining for YAP (red) in HepG2 cells transfected with siControl or siSPTAN1 and cultured at HCD. Scale bars: 20 μm. (I) Immunoblot analysis of lysates of HepG2 cells expressing Flag-tagged Myr-NUMB1 or control vector transfected with siControl or siSPTAN1 and cultured at HCD. (J) Immunofluorescence staining for Flag (green) and YAP (red) in HepG2 cells transfected with siSPTAN1 or Flag-tagged Myr-NUMB1 and cultured at HCD. Scale bar: 20 μm. (K) Proposed working model for how the SPTAN1/NUMB axis regulates Hippo/MST/YAP signaling at different cell densities.
Figure 5
Figure 5. NUMB1/2 sequester MARK on the plasma membrane.
(A and B) Immunoblot analysis of the indicated proteins in GST affinity bead precipitates of GST-tagged NUMB with His-tagged proteins. (C) qPCR analysis of the relative mRNA levels of MARK14 in HepG2 cells. Each bar represents the mean ± SD from biological triplicate experiments. (D and E) Whole-cell lysates from HepG2 cells or primary hepatocytes extracted from WT mice were collected for co-IP analysis. (F) Immunoblot analysis of the indicated proteins in the cytoplasmic fraction and the plasma membrane fraction isolated from WT and NUMB-KO HepG2 cells cultured at LCD or HCD. (G) Immunofluorescence staining for NUMB (green) and MARK2 (red) in WT and NUMB-KO HepG2 cells cultured at LCD or HCD. Scale bars: 20 μm. (H) Immunoblot analysis of the indicated proteins in WT and NUMB-KO HepG2 cells.
Figure 6
Figure 6. MARK on the plasma membrane leads to MST1/2 activation.
(A) Immunoblot analysis of the indicated proteins in HepG2 cells expressing Flag-tagged Myr-NUMB1 or control vector cotransfected with siControl or the mixture of siMARK2 and siMARK3 (siMARK2/3) and cultured at LCD. (B) Immunoblot analysis of the indicated proteins in WT and NUMB-KO HepG2 cells cotransfected with siControl, siMARK2 (the mixture siRNA of siMARK2-1 and siMARK2-2), siMARK3 (the mixture siRNA of siMARK3-1 and siMARK3-2), or siMARK2/3 and cultured at HCD. (C and D) Phospho-tag and SDS-PAGE analysis (C) or immunofluorescence staining (D) of WT and NUMB-KO HepG2 cells cotransfected with siControl or siMARK2/3 and cultured at LCD or HCD. Scale bars: 20 μm. (E) Proposed working model of how the NUMB-MARK complex regulates Hippo/MST/YAP signaling at different cell densities.
Figure 7
Figure 7. NUMB deficiency promotes hepatocytes dedifferentiation in vivo and in vitro.
(A) Liver/BW ratios (n = 7, 6, 8, 8) of NumbCtr and NumbΔHep mice treated with chow only or chow with DDC. (B) Percentage of CK19+ or Ki67+ cells in the liver periportal areas of NumbCtr and NumbΔHep mice treated with 0.1% DDC. (C and D) Immunofluorescence staining for the indicated proteins in liver sections from NumbCtr and NumbΔHep (with tdTomato labeled hepatocytes) mice treated with chow or DDC (C) or in CLiPs derived from primary hepatocytes of NumbCtr and NumbΔHep mice (D). Scale bars (including insets): 50 μm. (E) Immunofluorescence staining for the indicated proteins in a WT mouse liver section. Scale bar: 50 μm. Data are presented as the mean ± SD. P values were assessed by 2-tailed, unpaired Student’s t test (A and B).
Figure 8
Figure 8. NUMB and WW45 restrain liver dedifferentiation and tumorigenesis via suppression of MARK activity.
(A) Whole-cell lysates of hepatocytes isolated from mice were collected for co-IP analysis. (BD) Immunoblot analysis of the indicated proteins in liver lysates (B), representative liver images and liver/BW ratios (n = 9, 8, 11, 13) (C), and liver tumor numbers (n = 10, 10, 10, 10) (D) for Ww45 NumbCtr, NumbΔHep, Ww45ΔHep, and Ww45 NumbΔHep mice. (E) Percentage of CK19+ or Ki67+ cells in the periportal areas of livers from the indicated mice at 3 months of age. (F and G) Liver/BW ratios (n = 8, 7, 9, 9) (F) and immunofluorescence staining of liver sections (G) from Ww45fl/fl and Ww45ΔHep mice transfected with AAV-Vector or AAV-Mark2. Scale bars: 25 μm. (H) Proposed working model of how NUMB-MARK2 tangoing with WW45 mediates MST1/2 activation. Data are presented as the mean ± SD. P values were assessed by 1-way ANOVA followed by Tukey’s multiple-comparison test (C) and 2-tailed, unpaired Student’s t test (DF).
Figure 9
Figure 9. NUMB and WW45 restrain liver dedifferentiation and tumorigenesis in a YAP-dependent manner but not a RBP-J–dependent manner.
(A) qPCR analysis of Hey1 and Hes1 in the livers of Ww45 NumbCtr, NumbΔHep, Ww45ΔHep, and Ww45 NumbΔHep mice. Each bar represents the mean ± SD from experimental triplicate experiments. (BD) Representative liver images and liver/BW ratios of 3-month-old mice (n = 9, 10, 7, 7) (B) and 6-month-old mice (n = 7, 8, 9, 10) (C), liver tumor numbers of 6-month-old mice (n = 8, 10, 9, 9) (C), and the percentage of CK19+ or Ki67+ cells in liver periportal areas of 3-month-old mice (D) of the genotype Ww45 NumbCtr, Ww45 NumbΔHep, Ww45 NumbΔHep RbpjΔHep, or Ww45 NumbΔHep YapΔHep/+ as indicated. (E) Survival curves (n = 18, 17, 25, 25, 29, 23) for Ww45 NumbCtr, NumbΔHep, Ww45ΔHep, and Ww45 NumbΔHep mice. The indicated P values for mortality were determined by Mantel-Cox test. (F) Immunofluorescence staining for tdTomato or CK19 in liver sections from Ww45 NumbCtr, NumbΔHep, Ww45ΔHep, and Ww45 NumbΔHep mice with tdTomato-labeled hepatocytes. Scale bars (including insets): 50 μm. Data are presented as the mean ± SD. P values were assessed by 1-way ANOVA followed by Tukey’s multiple-comparison test (AD).
Figure 10
Figure 10. NUMB3/4 isoforms are preferably expressed in cancer cells.
(A and B) Schematic diagram of the relative expression levels of the indicated proteins in tumor tissues (T) and adjacent nontumorous liver tissues (N) from 60 patients. (C and D) Ratios (n = 16, 25, 21, 25, and 29 biological replicates) of fluorescence intensities (quantified by ZEN 3.1 Blue Edition) of membrane NUMB to cytoplasmic NUMB (C) and the relative expression ratio (n = 13, 10, 22, 17, 12, biological replicates) of NUMB-PTBL versus NUMB-PTBS in sections of nontumorous human liver tissues and human HCC tumor tissues at the different stages (D). (E) Whole-cell lysates from HEK293T cells cotransfected with the indicated constructs were collected for co-IP analysis. (F) Immunofluorescence staining for MARK2 (red) and β-catenin (green) in human liver HCC sections. Scale bars: 50 μm. (G) Ratio of NUMB-PTBS/NUMB-PTBL (n = 16, 33) expression levels in adjacent liver tissues and liver tumor tissues from mice treated with DEN for 8 months. (H) Proposed working model of how the SPTAN1/NUMB/MARK2 axis regulates Hippo/YAP signals in normal liver tissues and HCC tissues. Data are presented as the mean ± SD. P values were assessed by 1-way ANOVA followed by Tukey’s multiple-comparison test (C and D) and 2-tailed, unpaired Student’s t test (G).

References

    1. McClatchey AI, Yap AS. Contact inhibition (of proliferation) redux. Curr Opin Cell Biol. 2012;24(5):685–694. doi: 10.1016/j.ceb.2012.06.009. - DOI - PubMed
    1. Stramer B, Mayor R. Mechanisms and in vivo functions of contact inhibition of locomotion. Nat Rev Mol Cell Biol. 2017;18(1):43–55. doi: 10.1038/nrm.2016.118. - DOI - PubMed
    1. Hanahan D, Weinberg RA. Hallmarks of cancer: the next generation. Cell. 2011;144(5):646–674. doi: 10.1016/j.cell.2011.02.013. - DOI - PubMed
    1. Gumbiner BM, Kim NG. The Hippo-YAP signaling pathway and contact inhibition of growth. J Cell Sci. 2014;127(pt 4):709–717. doi: 10.1242/jcs.140103. - DOI - PMC - PubMed
    1. Harvey KF, et al. The Hippo pathway and human cancer. Nat Rev Cancer. 2013;13(4):246–257. doi: 10.1038/nrc3458. - DOI - PubMed

Publication types

MeSH terms