. 2023 Oct 16;133(20):e167994.
doi: 10.1172/JCI167994.

Angiopoietin-2 blockade suppresses growth of liver metastases from pancreatic neuroendocrine tumors by promoting T cell recruitment

Affiliations

Angiopoietin-2 blockade suppresses growth of liver metastases from pancreatic neuroendocrine tumors by promoting T cell recruitment

Eunhyeong Lee et al. J Clin Invest. .

Abstract

Improving the management of metastasis in pancreatic neuroendocrine tumors (PanNETs) is critical, as nearly half of patients with PanNETs present with liver metastases, and this accounts for the majority of patient mortality. We identified angiopoietin-2 (ANGPT2) as one of the most upregulated angiogenic factors in RNA-Seq data from human PanNET liver metastases and found that higher ANGPT2 expression correlated with poor survival rates. Immunohistochemical staining revealed that ANGPT2 was localized to the endothelial cells of blood vessels in PanNET liver metastases. We observed an association between the upregulation of endothelial ANGPT2 and liver metastatic progression in both patients and transgenic mouse models of PanNETs. In human and mouse PanNET liver metastases, ANGPT2 upregulation coincided with poor T cell infiltration, indicative of an immunosuppressive tumor microenvironment. Notably, both pharmacologic inhibition and genetic deletion of ANGPT2 in PanNET mouse models slowed the growth of PanNET liver metastases. Furthermore, pharmacologic inhibition of ANGPT2 promoted T cell infiltration and activation in liver metastases, improving the survival of mice with metastatic PanNETs. These changes were accompanied by reduced plasma leakage and improved vascular integrity in metastases. Together, these findings suggest that ANGPT2 blockade may be an effective strategy for promoting T cell infiltration and immunostimulatory reprogramming to reduce the growth of liver metastases in PanNETs.

Keywords: Angiogenesis; T cells.


Figures
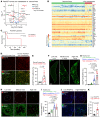
Figure 1
Figure 1. Increased ANGPT2 expression in PanNET liver metastases.
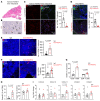
(A and B) Volcano plot (A) and heatmap (B) from RNA-Seq transcriptome analyses of differentially expressed angiogenesis-related genes in liver metastases of patients with PanNETs (n = 30) and normal human liver tissues (n = 119), with ANGPT2 noted in red. (A) The horizontal dotted line in the volcano plot represents a FDR of 1%; the vertical lines represent the threshold (±2-fold) of the log2 fold change. (B) The heatmap shows normalized RNA-Seq data for angiogenesis-related genes (rows) from 149 samples (columns). (C) Kaplan-Meier survival curves of patients with PanNETs with low (n = 9) or high (n = 11) concentrations of plasma ANGPT2 (cutoff, 0.66 ng/mL). (D and E) Increased ANGPT2 immunoreactivity in liver metastases of patients with PanNETs (n = 11) compared with that in normal livers (n = 5) (scale bar: 50 μm) (D) and quantification of ANGPT2+ vessels (unpaired t test) (E). (FH) Whole-liver-lobe cross-sections showing the metastatic tumor progression of RT2;AB6F1 mice (scale bar: 1 mm) (F). Mice at 15, 18, and 20 weeks of age were stratified by percentage area of metastasis (low, <1%; medium, 1%–10%; high, >10%). Quantification of ANGPT2+ vessels (1-way ANOVA with Tukey’s multiple comparisons test) (G) and representative images showing increased ANGPT2 during metastatic growth (scale bar: 50 μm) (H). (I) Analysis of plasma ANGPT2 concentrations by ELISA (1-way ANOVA with Tukey’s multiple comparisons test). (J and K) Greater vascular leakage marked by extravasated fibrin in metastatic colonies of the liver with high ANGPT2 compared with colonies with little or no ANGPT2 staining in RT2;AB6F1 mice at 20 weeks of age (scale bar: 50 μm) (J) and its quantification (unpaired t test) (K). The cutoff value for high and low ANGPT2 was 13.8, the average ANGPT2 expression (ANGPT2/CD31, %). For E, G, I, and K, each data point represents an individual human or mouse. Data are displayed as the mean ± SEM.
Figure 2
Figure 2. ANGPT2 inhibition suppresses liver metastases and improves overall survival in mice with metastatic PanNETs.
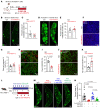
(A) Experimental timeline for treatments in RT2;AB6F1 mice beginning at 15 (early-stage metastasis) or 18 weeks (late-stage metastasis) of age, followed by perfusion at 18 or 20 weeks of age, respectively. (B) Gross view images of liver lobes from RT2;AB6F1 mice treated with IgG or anti-ANGPT2 at 20 weeks of age. (C and D) Metastatic burden of whole-liver-lobe cross-sections in RT2;AB6F1 mice treated with IgG or anti-ANGPT2 starting at 15 or 18 weeks of age (scale bar: 1 mm) (C), and corresponding quantification of SV40 T-antigen+ metastatic burden (D). Quantification in D compares liver metastatic burden at the onset of treatment and 15 or 18 weeks (1-way ANOVA with Tukey’s multiple comparisons test). (E and F) Representative images comparing apoptosis, measured by cleaved caspase-3 in liver metastases of 20-week-old RT2;AB6F1 mice treated with IgG or anti-ANGPT2 (scale bar: 50 μm) (E) and its quantification (unpaired t test) (F). (G) Kaplan-Meier survival curves of RT2;AB6F1 mice treated with IgG or anti-ANGPT2 (IgG, n = 19; anti-ANGPT2, n = 17). (H and I) Micro-CT images (top) and macroscopic images of livers (bottom) showing decreased liver metastases in AJ-5257-1–injected mice treated with anti-ANGPT2 compared with those treated with IgG. Asterisks indicate individual metastatic lesions in the liver. (H) Quantification of SV40 T-antigen+ metastatic burden (unpaired t test) (I). (J) Schematic of inducible Cre-loxP system in Angpt2iΔEC mice for endothelial Angpt2 depletion (top). Experimental timeline for Angpt2iΔEC mice treated with tamoxifen and, subsequently, inoculated with AJ-5257-1 cells after 7 weeks (bottom). (K and L) Reduced metastatic burden in Angpt2iΔEC mice compared with that in control mice (scale bar: 1 mm) (K) and corresponding quantification of SV40 T-antigen+ metastatic burden (unpaired t test) (L). For D, F, I, and L, each data point indicates an individual mouse. Data are displayed as the mean ± SEM.
Figure 3
Figure 3. ANGPT2 inhibition restores vessel integrity in PanNET liver metastases.
In RT2;AB6F1 mice, anti-ANGPT2 and IgG were administered twice per week starting at 18 weeks. Mice were perfused after 2 weeks of treatment at 20 weeks of age. (A and B) Alleviation of vascular leakage, as evidenced by decreased extravasation of fibrin in metastatic colonies, in mice treated with anti-ANGPT2 (scale bar: 50 μm) (A) and its quantification (unpaired t test) (B). (C) Comparison of VEGFR2+ vascular density in liver metastases of RT2;AB6F1 mice treated with IgG or anti-ANGPT2 (unpaired t test). (D and E) Representative images comparing desmin+ pericyte coverage and VE-cadherin+ and claudin-5+ endothelial cell junctions in metastatic regions from 20-week-old RT2;AB6F1 mice treated with IgG or anti-ANGPT2 (scale bar: 50 μm) (D), and the corresponding quantification of desmin+, VE-cadherin+, and claudin-5+ sinusoids (unpaired t test) (E). Dotted lines in D indicate metastatic tumor regions indicated by “T.” For B, C, and E, each data point represents an individual mouse. Data are displayed as the mean ± SEM.
Figure 4
Figure 4. ANGPT2 regulates T cell infiltration in PanNET liver metastases.
(A) Human PanNET liver metastasis (T) stained by H&E, outlined with dashes (scale bar: 2 mm). (B) CD8+ T cells in human PanNET liver metastasis. Arrowheads mark individual CD8+ T cells (scale bar: 50 μm). (C) CD8+ T cell infiltration into the low ANGPT2-expressing (top) or high ANGPT2-expressing (bottom) metastatic livers from patients with PanNETs and corresponding quantification (unpaired t test) (scale bar: 50 μm). The cutoff value for high and low ANGPT2 was 13.8, the average ANGPT2 coverage (ANGPT2/CD31, %). (D) Analysis of CD8+ T cell infiltration into the liver metastases with low ANGPT2 (top) or high ANGPT2 (bottom) expressions from 18- to 20-week-old RT2;AB6F1 mice and corresponding quantification (unpaired t test) (scale bar: 50 μm). The cutoff value for high and low ANGPT2 was 13.4, average ANGPT2 expression (ANGPT2/CD31, %). (E and F) Increased CD8+ (E) and CD4+ (F) T cell infiltration into the liver metastases in 20-week-old RT2;AB6F1 mice treated with anti-ANGPT2 for 2 weeks compared with low T cell infiltration in IgG-treated control mice and corresponding quantifications (unpaired t test) (scale bar: 50 μm). (G and H) Analysis of flow cytometry showing frequencies of activated (CD69+) CD8+ or CD4+ T cells (G), activated (granzyme B+) CD8+ T cells (H, left) and regulatory (Foxp3+) CD4+ T cells (H, right) in the experimental metastasis mouse model inoculated with AJ-5257-1 cells (unpaired t test). Three weeks after inoculation, mice were treated with IgG or anti-ANGPT2 twice per week for 4 weeks and perfused 7 weeks after inoculation. (I) Analysis of gene expression patterns for CXCL9, CXCL10, CXCL11, VCAM-1, and ICAM-1 by qPCR using the metastatic liver tissues of 20-week-old RT2;AB6F1 mice treated with either IgG or anti-ANGPT2 (unpaired t test). For CI, each data point represents an individual human or mouse. Data are displayed as the mean ± SEM.
Figure 5
Figure 5. T cells mediate the antimetastatic response of ANGPT2 blockade.
(A) Experimental timeline for SCID mice injected with 99-3o or AJ-5257-1 cells. (BE) Whole-liver-lobe cross-sections comparing metastatic burden in 99-3o cell–injected (scale bar: 1 mm) (B) or AJ-5257-1 cell–injected (scale bar: 1 mm) (D) SCID mice treated with IgG or anti-ANGPT2, and the corresponding quantifications of SV40 T-antigen+ metastatic burden (unpaired t test) (C and E). (F and G) Expression of cleaved caspase-3 in 20-week-old RT2;AB6F1 mice treated with IgG (top) or anti-ANGPT2 (bottom) (scale bar: 50 μm) (F) and its quantification (unpaired t test) (G). (HK) Expression of fibrin (scale bar: 50 μm) (H) and VE-cadherin (scale bar: 50 μm) (J) in 20-week-old RT2;AB6F1 mice treated with IgG or anti-ANGPT2 and quantification of vascular leakage (I) and VE-cadherin coverage (K) (unpaired t test). (L) Experimental timeline of CD8+ or CD4+ T cell depletion study in which RT2;AB6F1 mice were treated with IgG, anti-ANGPT2, and combination of anti-ANGPT2 with anti-CD8 or anti-CD4 antibodies beginning at 18 weeks of age. (M and N) Whole-liver-lobe cross-sections comparing metastatic burden in RT2;AB6F1 mice treated with IgG, anti-ANGPT2, and combination of anti-ANGPT2 with anti-CD8 or anti-CD4 antibodies (scale bar: 1 mm) (M) and quantification of SV40 T-antigen+ metastatic burden (1-way ANOVA with Tukey’s multiple comparisons test) (N). For C, E, G, I, K, and N, each data point indicates an individual mouse. Data are displayed as mean ± SEM.

References

    1. Dasari A, et al. Trends in the incidence, prevalence, and survival outcomes in patients with neuroendocrine tumors in the United States. JAMA Oncol. 2017;3(10):1335–1342. doi: 10.1001/jamaoncol.2017.0589. - DOI - PMC - PubMed
    1. Hallet J, et al. Exploring the rising incidence of neuroendocrine tumors: a population-based analysis of epidemiology, metastatic presentation, and outcomes. Cancer. 2015;121(4):589–597. doi: 10.1002/cncr.29099. - DOI - PubMed
    1. Kuo EJ, Salem RR. Population-level analysis of pancreatic neuroendocrine tumors 2 cm or less in size. Ann Surg Oncol. 2013;20(9):2815–2821. doi: 10.1245/s10434-013-3005-7. - DOI - PubMed
    1. Frilling A, et al. Recommendations for management of patients with neuroendocrine liver metastases. Lancet Oncol. 2014;15(1):8–21. doi: 10.1016/S1470-2045(13)70362-0. - DOI - PubMed
    1. Mazzaferro V, et al. Neuroendocrine tumors metastatic to the liver: how to select patients for liver transplantation? J Hepatol. 2007;47(4):460–466. doi: 10.1016/j.jhep.2007.07.004. - DOI - PubMed

Publication types