. 2023 Nov 16;91(11):e0036723.
doi: 10.1128/iai.00367-23. Epub 2023 Oct 16.

Bhlhe40 limits early IL-10 production from CD4+ T cells during Plasmodium yoelii 17X infection

Affiliations

Bhlhe40 limits early IL-10 production from CD4+ T cells during Plasmodium yoelii 17X infection

Kara A O'Neal et al. Infect Immun. .

Abstract

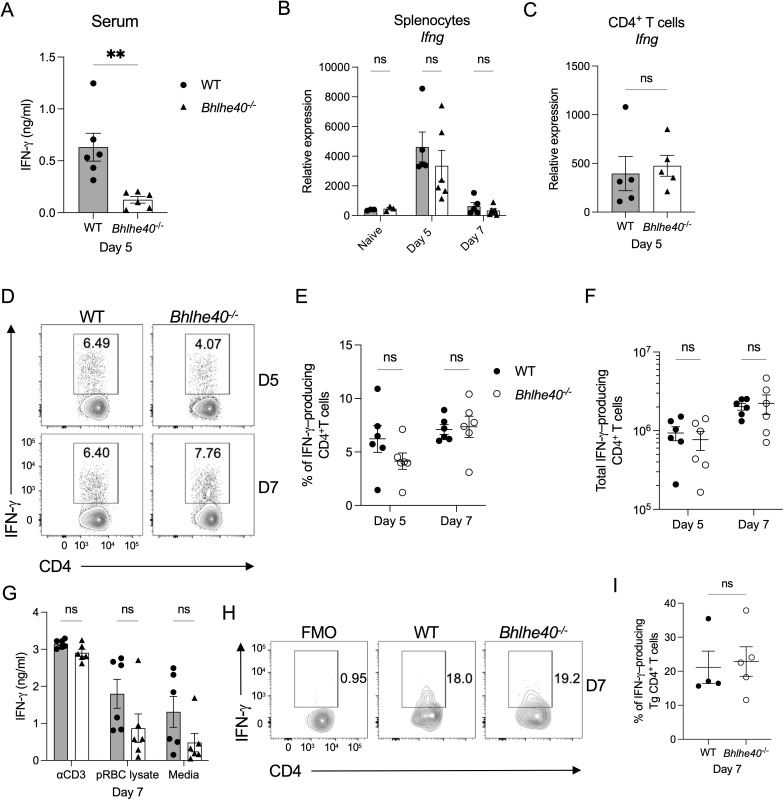
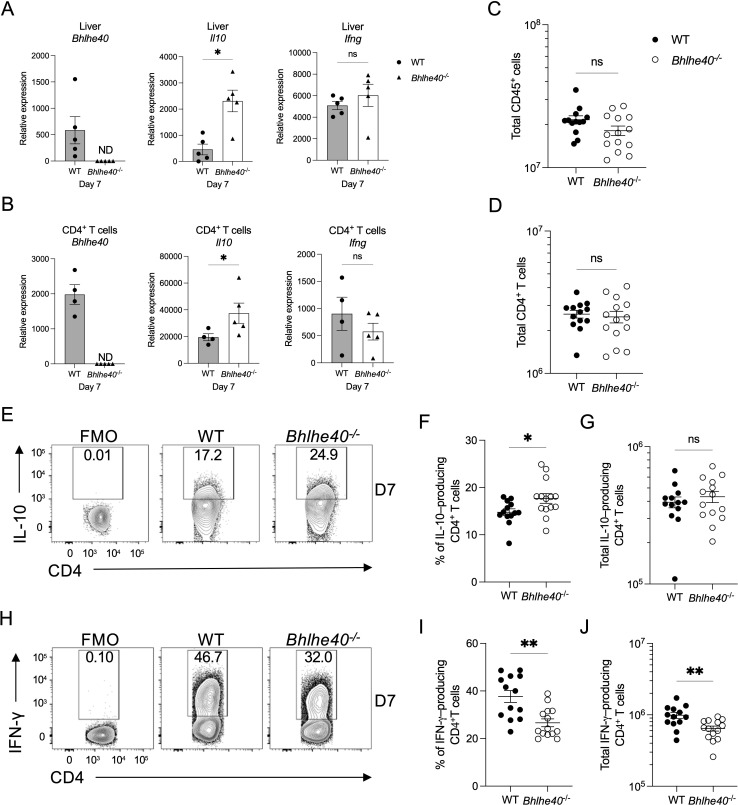
The cytokine IL-10 suppresses T-cell-mediated immunity, which is required to control infection with Plasmodium yoelii. Consequently, IL-10 can delay the time needed to resolve this infection, leading to a higher parasite burden. While the pathways that lead to IL-10 production by CD4+ T cells are well defined, much less is known about the mediators that suppress the expression of this potent anti-inflammatory cytokine. Here, we show that the transcription factor basic helix-loop-helix family member e40 (Bhlhe40) contributes to controlling parasite burden in response to P. yoelii infection in mice. Loss of Bhlhe40 expression in mice results in higher Il10 expression, higher peak parasitemia, and a delay in parasite clearance. The observed phenotype was not due to defects in T-cell activation and proliferation or the humoral response. Nor was it due to changes in regulatory T-cell numbers. However, blocking IL-10 signaling reversed the outcome in Bhlhe40-/ - mice, suggesting that excess IL-10 production limits their ability to control the infection properly. In addition to suppressing Il10 expression in CD4+ T cells, Bhlhe40 can promote Ifng expression. Indeed, IFN-γ production by CD4+ T cells isolated from the liver was significantly affected by the loss of Bhlhe40. Lastly, Bhlhe40 deletion in T cells resulted in a phenotype similar to that observed in the Bhlhe40-/ - mice, indicating that Bhlhe40 expression in T cells contributes to the ability of mice to control infection with P. yoelii.

Keywords: Plasmodium; T cells; cytokines; infectious disease; transcription factors.


Conflict of interest statement

The authors declare no conflict of interest.

Figures

Fig 1
Fig 1
Bhlhe40 expression is required to control a non-lethal P. yoelii 17X infection in mice efficiently. WT and Bhlhe40−/ mice were infected i.p. with 105 P. yoelii pRBCs. Relative expression of Bhlhe40 in (A) total splenocytes from naïve mice and at days 5 and 7 p.i. and (B) sort-purified CD4+ T cells isolated from the spleen at day 5 p.i. as determined by RT-qPCR. Data were normalized to Hprt, and the 2−ΔCt method was used to calculate relative expression. (C) Representative parasitemia curve during primary infection as determined by flow cytometry. The area under the curve was measured for WT and Bhlhe40−/ mice from the day of peak parasitemia to the day of parasite clearance in WT mice from three separate experiments. RT-qPCR data represent two independent experiments with three to five mice per group. Parasitemia was assessed as part of three independent experiments with at least five mice per group. (A) A nonparametric Mann-Whitney t-test determined significance. (C) A paired t-test determined significance. *P < 0.05, ***P < 0.001. ND, not detected.
Fig 2
Fig 2
IL-10 production is enhanced in Bhlhe40−/ mice after P. yoelii infection. WT and Bhlhe40−/ mice were infected i.p. with 105 P. yoelii pRBCs. (A) Serum concentrations of IL-10 at day 7 p.i. as determined by ELISA. Relative expression of Il10 in (B) total splenocytes from naïve mice and mice infected for 5 and 7 days and (C) sort-purified CD4+ T cells isolated from the spleen at day 5 p.i. as determined by RT-qPCR. Data were normalized to Hprt, and the 2−ΔCt method was used to calculate relative expression. (D) Representative flow plots of live, single-cell, IL-10–producing CD4+ T cells isolated from the spleen at days 5 and 7 p.i. following ex vivo stimulation with PMA and ionomycin in the presence of BFA. Gate based on FMO control displayed in Fig. S1A. Frequency (E) and total number (F) of live, single-cell IL-10–producing CD4+ T cells at days 5 and 7 p.i. (G) Concentration of IL-10 measured by ELISA in the supernatant of WT and Bhlhe40−/ splenocytes isolated at day 7 p.i. and cultured in the presence of anti-CD3e, parasite-derived lysate or media alone for 48 hours. (H) Representative flow plots of live, single-cell, CD45.2+TCRVα2+ IL-10–producing WT or Bhlhe40−/ donor PbT-II Tg CD4+ T cells recovered from the spleen of CD45.1+ recipient mice at day 7 p.i. following ex vivo stimulation with PMA and ionomycin in the presence of BFA. (I) Frequency of live, singlet IL-10–producing WT or Bhlhe40−/ PbT-II Tg CD4+ T cells at day 7 p.i. Gate based on FMO control. (A and G) Data represent two independent experiments with five to six mice per group. (B and C) Data represent two independent experiments with three to five mice per group. (D–F) Data represent three independent experiments with five to six mice per group. (H and I) Data represent three independent experiments with four to five mice per group. (A, C, and I) A nonparametric Mann-Whitney t-test determined significance. (B and E–G) A two-way ANOVA determined significance with a post hoc Holm-Sidak’s multiple-comparison test. *P < 0.05, **P < 0.01, ****P < 0.0001, ns, not significant.
Fig 3
Fig 3
Ifng expression by splenic CD4+ T cells is not impaired after P. yoelii infection. WT and Bhlhe40−/ mice were infected i.p. with 105 P. yoelii pRBCs. (A) Serum concentrations of IFN-γ at day 5 p.i. as determined by ELISA. Relative expression of Ifng in (B) total splenocytes from naïve mice and mice infected for 5 and 7 days and (C) sort-purified CD4+ T cells isolated from the spleen at day 5 p.i. as determined by RT-qPCR. Data were normalized to Hprt, and the 2−ΔCt method was used to calculate relative expression. (D) Representative flow plots of live, single-cell, IFN-γ–producing CD4+ T cells isolated from the spleen at days 5 and 7 p.i. following ex vivo stimulation with PMA and ionomycin in the presence of BFA. Gate based on FMO control displayed in Fig. S1A. Frequency (E) and total number (F) of live, singlet IFN-γ–producing CD4+ T cells isolated from the spleen at days 5 and 7 p.i. (G) Concentration of IFN-γ measured by ELISA in the supernatant of WT and Bhlhe40−/ splenocytes isolated at day 7 p.i. and cultured in the presence of anti-CD3e, parasite-derived lysate or media alone for 48 hours. (H) Representative flow plots of live, single-cell, CD45.2+TCRVα2+ IFN-γ–producing donor WT or Bhlhe40−/ PbT-II Tg CD4+ T cells recovered from the spleen of CD45.1+ recipient mice at day 7 p.i. following ex vivo stimulation with PMA and ionomycin in the presence of BFA. Gate based on FMO control. (I) Frequency of live, singlet IFN-γ–producing WT or Bhlhe40−/ PbT-II Tg CD4+ T cells at day 7 p.i. (A, B, and G) Data represent two independent experiments with five to six mice per group. (C) Data represent two independent experiments with three to five mice per group. (D–F) Data represent three independent experiments with five to six mice per group. (H and I) Data represent three independent experiments with four to five mice per group. (A, C, and I) A nonparametric Mann-Whitney t-test determined significance. (B and E–G) A two-way ANOVA determined significance with a post hoc Holm-Sidak’s multiple-comparison test. **P < 0.01, ns, not significant.
Fig 4
Fig 4
Bhlhe40 is not required for CD4+ T-cell proliferation during P. yoelii infection. WT and Bhlhe40−/ mice were infected i.p. with 105 P. yoelii pRBCs. (A) The total number of live, singlet CD4+ T cells in WT and Bhlhe40−/ mice infected for 3, 5, and 7 days. (B) Representative flow plot of live, singlet CD44hiCD11a+ CD4+ T cells from WT and Bhlhe40−/ mice at day 5 p.i. Frequency (C) and total number (D) of live, singlet CD44hiCD11a+ CD4+ T cells from mice infected for 3, 5, and 7 days. (E) Representative flow plots of Ki-67 expression by live, singlet CD44hiCD11a+ CD4+ T cells isolated from the spleen of mice infected for 5 days. Gate based on FMO control. Frequency (F) and total number (G) of live, singlet CD44hiCD11a+ Ki-67+ CD4+ T cells from the spleen of WT and Bhlhe40−/ mice infected for 3, 5, and 7 days. Data represent two independent experiments with four to five mice per group. A two-way ANOVA determined significance with a post hoc Holm-Sidak’s multiple-comparison test. ns, not significant.
Fig 5
Fig 5
Blockade of IL-10R signaling reduces parasite burden in WT and Bhlhe40−/ mice after P. yoelii 17X infection. (A) Experimental design. Bhlhe40−/ and WT mice were administered 200 µg of an anti-IL-10R Ab or a rat IgG isotype control Ab i.p. on days 6, 9, and 12 p.i. with P. yoelii 17X. Il10−/ mice were also infected and served as a control. (B) Representative parasitemia curve as determined by flow cytometry. Data are representative of three independent experiments with five mice per group. Two-way ANOVA determined significance with a post hoc Holm-Sidak multiple-comparison test. (+) WT Rat IgG vs WT anti-IL-10R, (*) Bhlhe40−/ Rat IgG vs Bhlhe40−/ anti-IL-10R, (†) WT anti-IL-10R vs Bhlhe40−/ anti-IL-10R. One symbol, P < 0.05; two symbols, P < 0.01; four symbols, P < 0.0001. Panel A created with BioRender.com.
Fig 6
Fig 6
The loss of Bhlhe40 impacts IFN-γ production by CD4+ T cells in the liver after P. yoelii infection. WT and Bhlhe40−/ mice were infected i.p. with 105 P. yoelii pRBCs. Relative expression of Bhlhe40, Il10, and Ifng in (A) purified CD45+ cells and (B) sort-purified CD4+ T cells isolated from the liver at day 7 p.i. as determined by RT-qPCR. Data were normalized to Hprt, and the 2−ΔCt method was used to calculate relative expression. The total number of (C) live, singlet CD45+ cells (D) or CD4+ T cells isolated from the liver at day 7 p.i. (E) Representative flow plots of IL-10 expression in live, singlet CD4+ T cells isolated from the liver at day 7 p.i. following ex vivo stimulation with PMA and ionomycin in the presence of BFA. Gate based on FMO control. Frequency (F) and the total number of (G) live, singlet IL-10–producing CD4+ T cells from the liver at day 7 p.i. (H) Representative flow plots of IFN-γ expression in live, singlet CD4+ T cells isolated from the liver at day 7 p.i. following ex vivo stimulation with PMA and ionomycin in the presence of BFA. Gated based on FMO control. (A and B) Data represent two independent experiments with five mice per group. (C–J) Data are pooled from three independent experiments with three to five mice per group. A nonparametric Mann-Whitney t-test determined significance. *P < 0.05; **P < 0.01; ND, not detected. ns, not significant.
Fig 7
Fig 7
Bhlhe40 expression in CD4+ T cells is necessary to control infection with P. yoelii. Bhlhe40fl/fl-Cd4-cre+ and Bhlhe40fl/fl Cd4-cre mice were infected i.p. with 105 P. yoelii 17X pRBCs, and parasitemia was monitored throughout the infection, starting at day 5 p.i. (A) Representative parasitemia curve as determined by flow cytometry. (B) The area under the curve was measured for WT and Bhlhe40−/ mice from the day of peak parasitemia to the day of parasite clearance in WT mice from three separate experiments. Data are representative of three independent experiments with five mice per group. A paired t-test determined significance. *P < 0.05.

Similar articles

Cited by

References

    1. Crompton PD, Moebius J, Portugal S, Waisberg M, Hart G, Garver LS, Miller LH, Barillas-Mury C, Pierce SK. 2014. Malaria immunity in man and mosquito: insights into unsolved mysteries of a deadly infectious disease. Annu Rev Immunol 32:157–187. doi:10.1146/annurev-immunol-032713-120220 - DOI - PMC - PubMed
    1. Kurtzhals JA, Adabayeri V, Goka BQ, Akanmori BD, Oliver-Commey JO, Nkrumah FK, Behr C, Hviid L. 1998. Low plasma concentrations of interleukin 10 in severe malarial anaemia compared with cerebral and uncomplicated malaria. Lancet 351:1768–1772. doi:10.1016/S0140-6736(97)09439-7 - DOI - PubMed
    1. Othoro C, Lal AA, Nahlen B, Koech D, Orago AS, Udhayakumar V. 1999. A low interleukin-10 tumor necrosis factor-α ratio is associated with malaria anemia in children residing in a holoendemic malaria region in western Kenya. J Infect Dis 179:279–282. doi:10.1086/314548 - DOI - PubMed
    1. Lyke KE, Burges R, Cissoko Y, Sangare L, Dao M, Diarra I, Kone A, Harley R, Plowe CV, Doumbo OK, Sztein MB. 2004. Serum levels of the proinflammatory cytokines interleukin-1 beta (IL-1beta), IL-6, IL-8, IL-10, tumor necrosis factor alpha, and IL-12(p70) in Malian children with severe Plasmodium falciparum malaria and matched uncomplicated malaria or healthy controls. Infect Immun 72:5630–5637. doi:10.1128/IAI.72.10.5630-5637.2004 - DOI - PMC - PubMed
    1. Linke A, Kühn R, Müller W, Honarvar N, Li C, Langhorne J. 1996. Plasmodium chabaudi chabaudi: differential susceptibility of gene-targeted mice deficient in IL-10 to an erythrocytic-stage infection. Exp Parasitol 84:253–263. doi:10.1006/expr.1996.0111 - DOI - PubMed

Publication types