. 2023 Dec 4;220(12):e20230707.
doi: 10.1084/jem.20230707. Epub 2023 Oct 16.

CD8+ lymphocytes are critical for early control of tuberculosis in macaques

Affiliations

CD8+ lymphocytes are critical for early control of tuberculosis in macaques

Caylin G Winchell et al. J Exp Med. .

Abstract

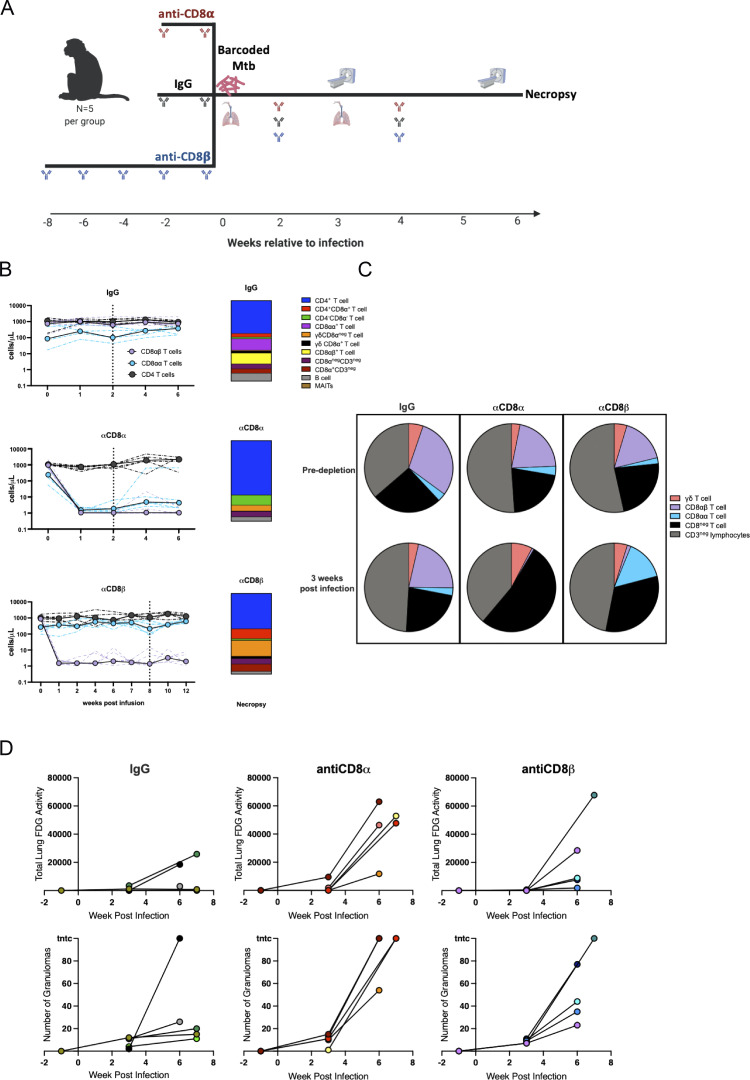
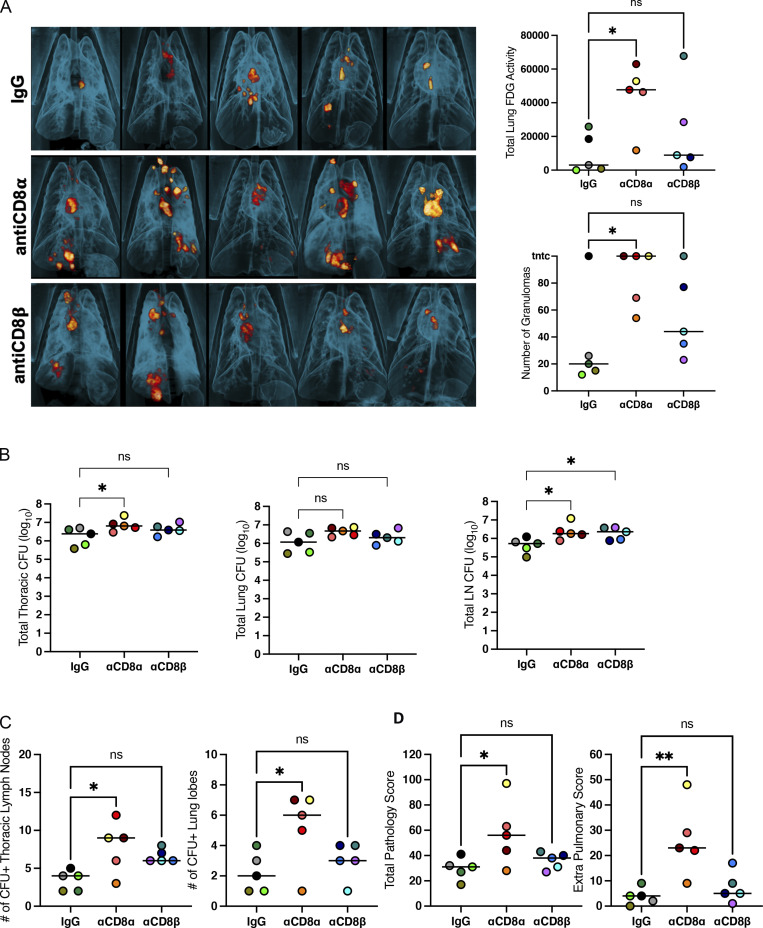
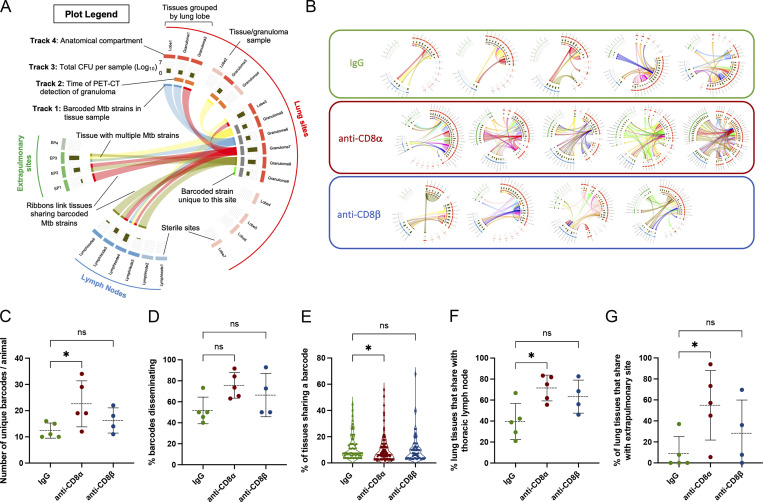
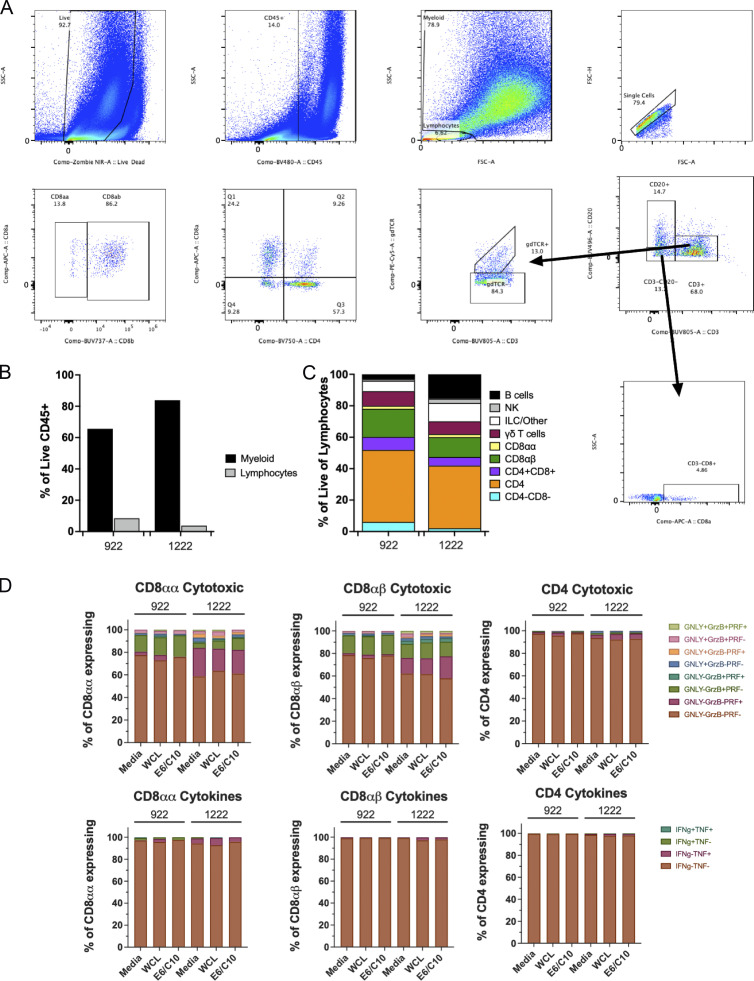
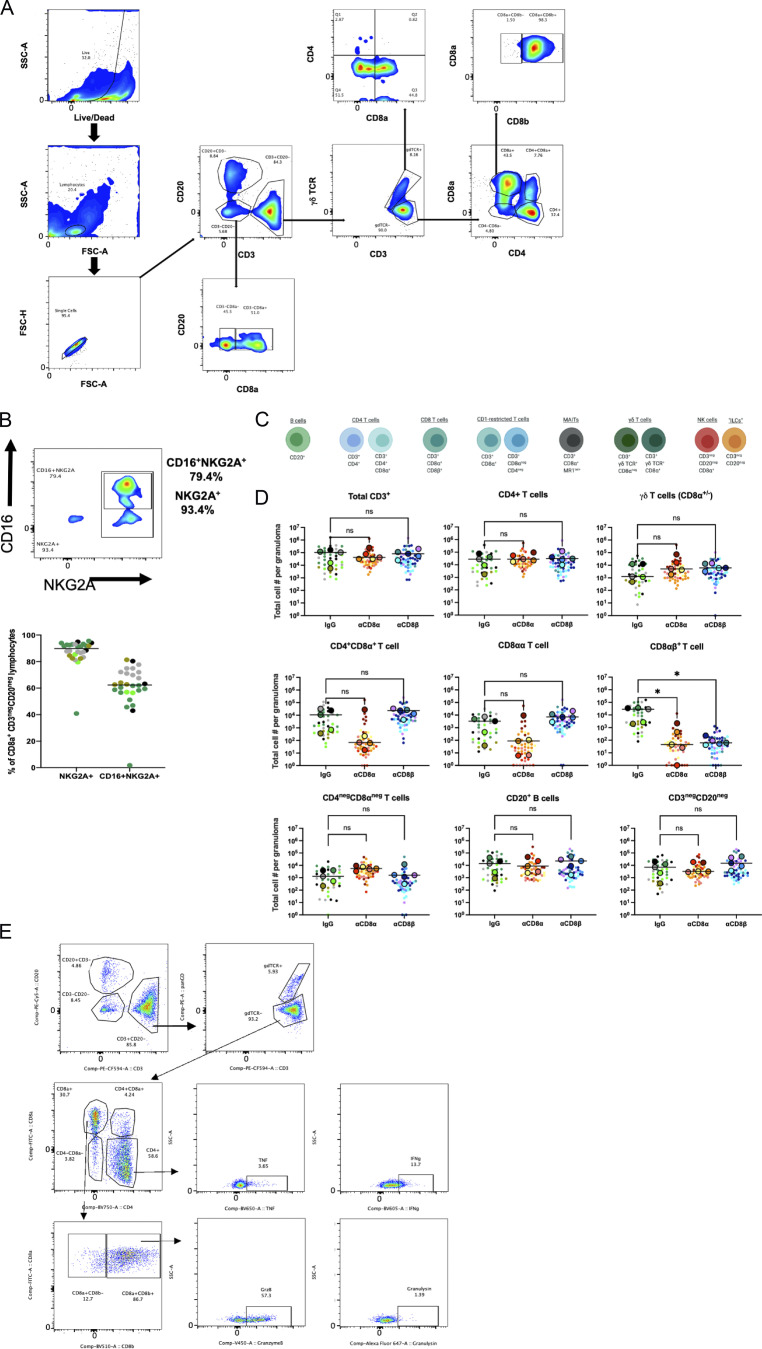
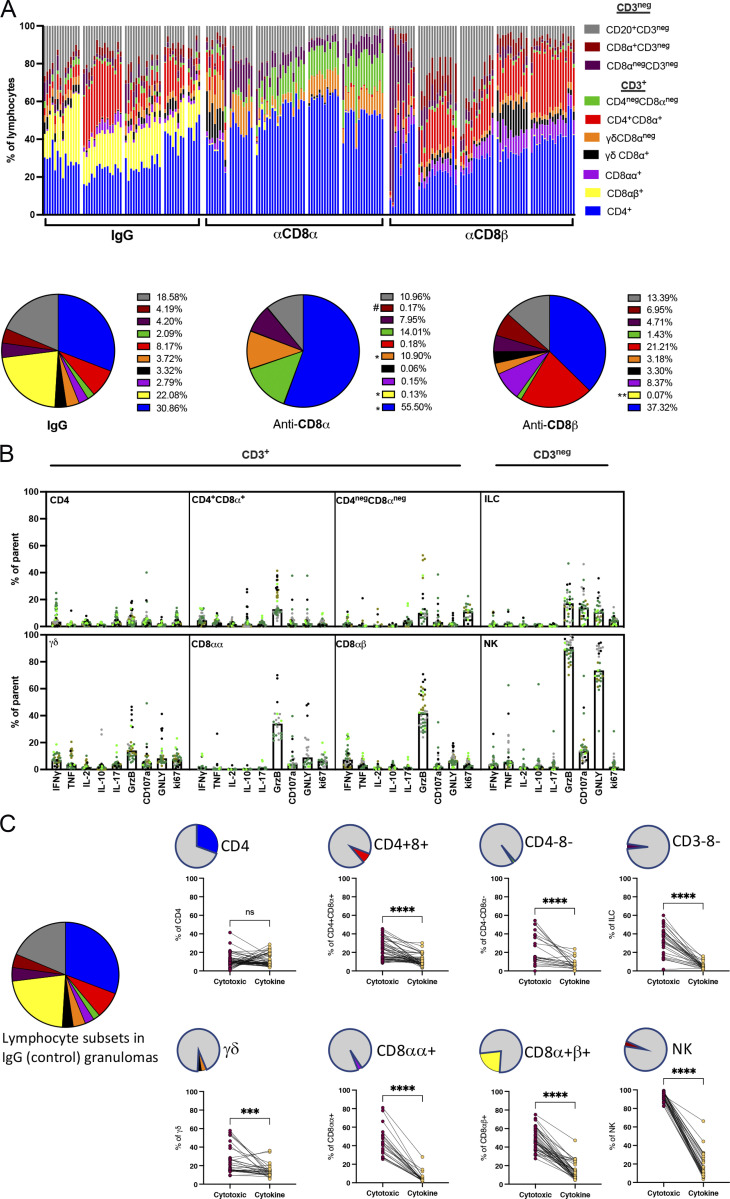
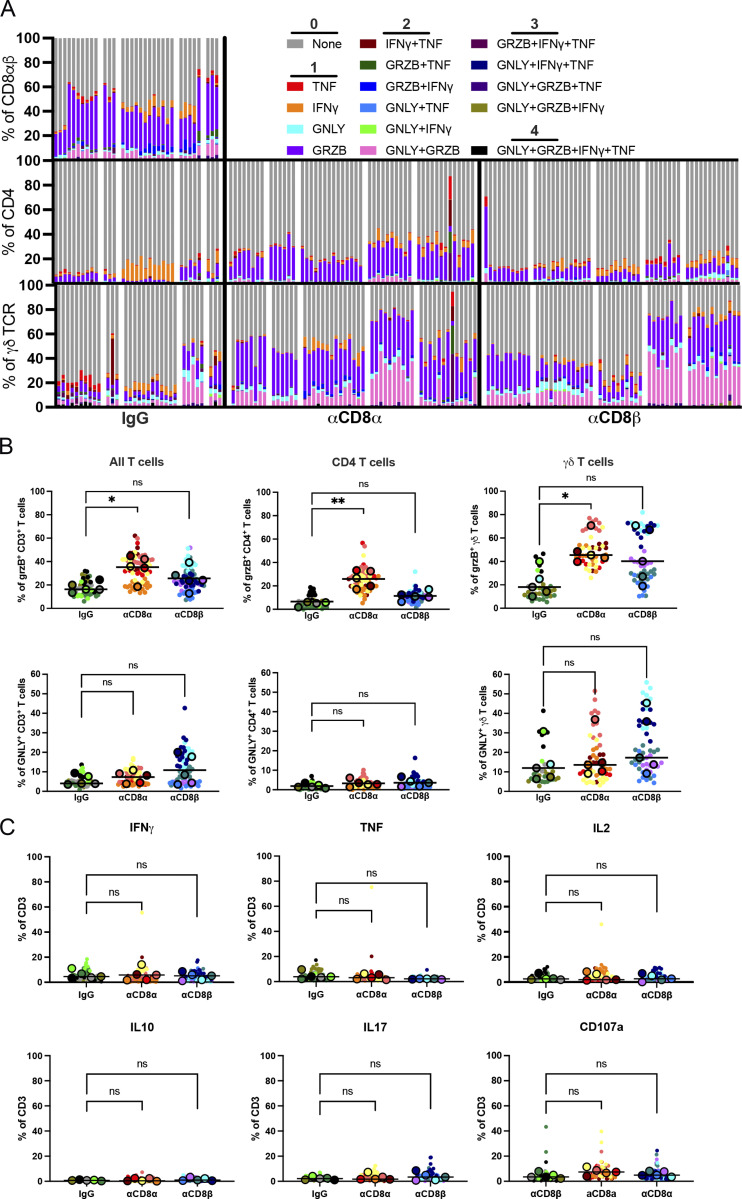
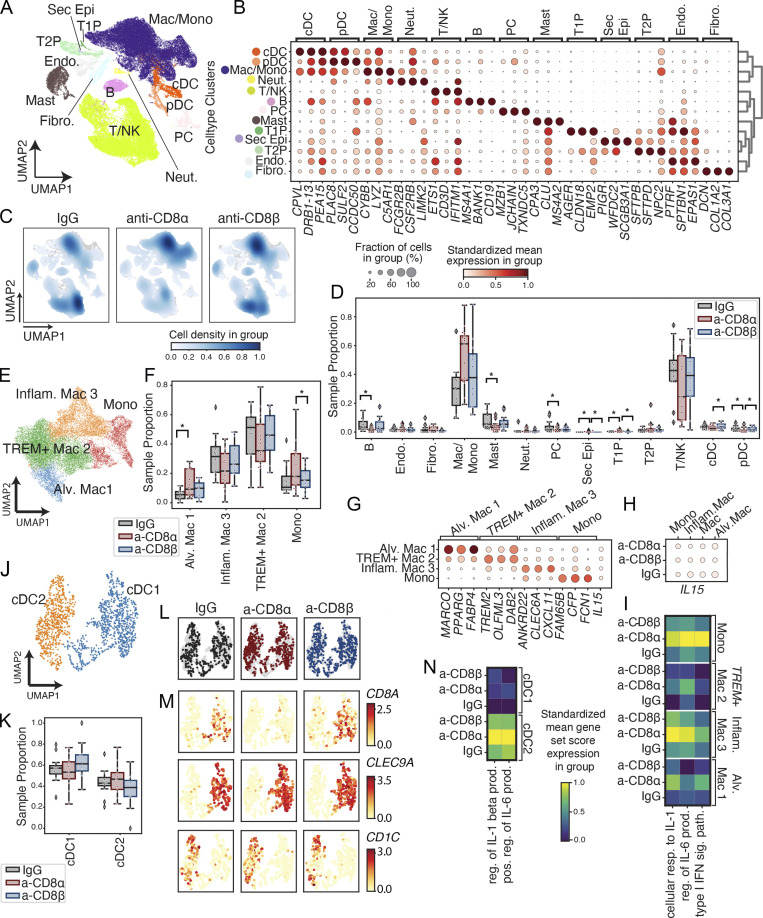
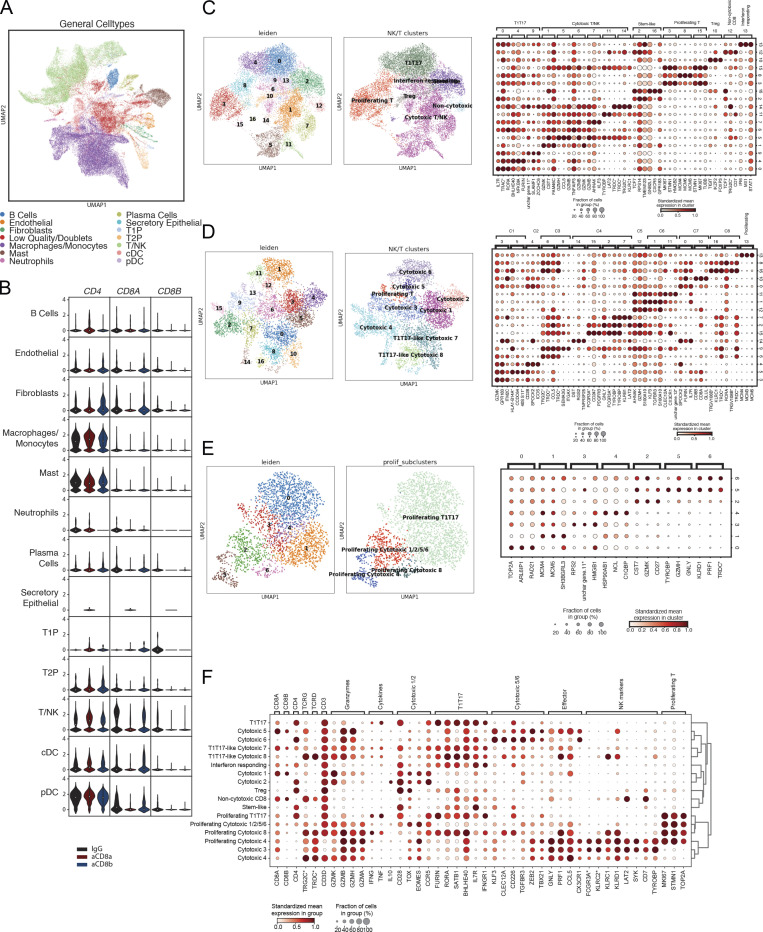
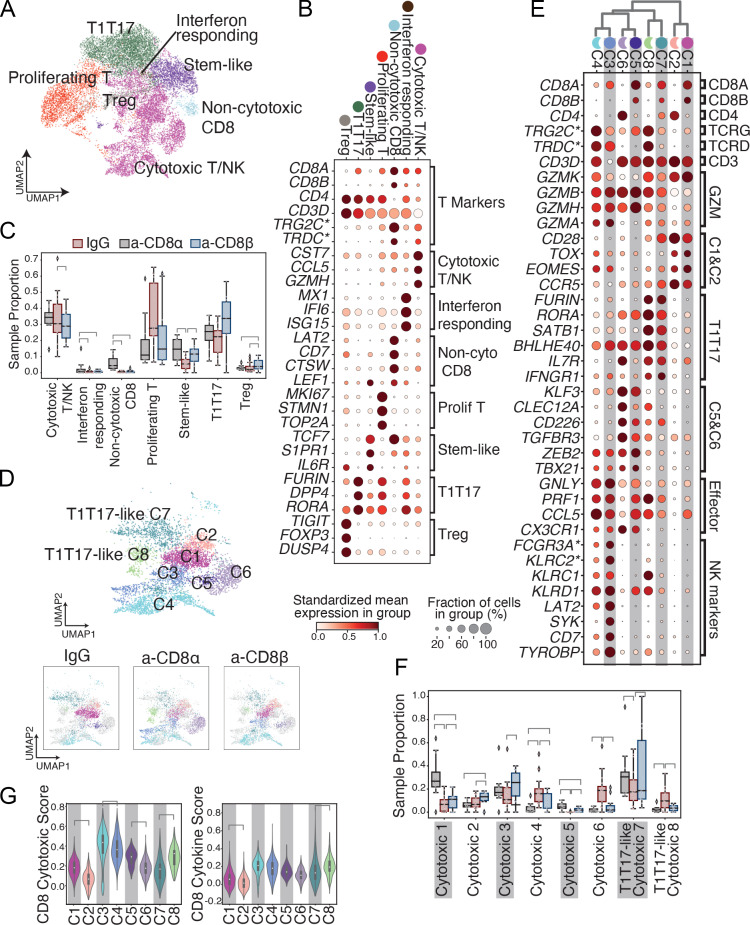
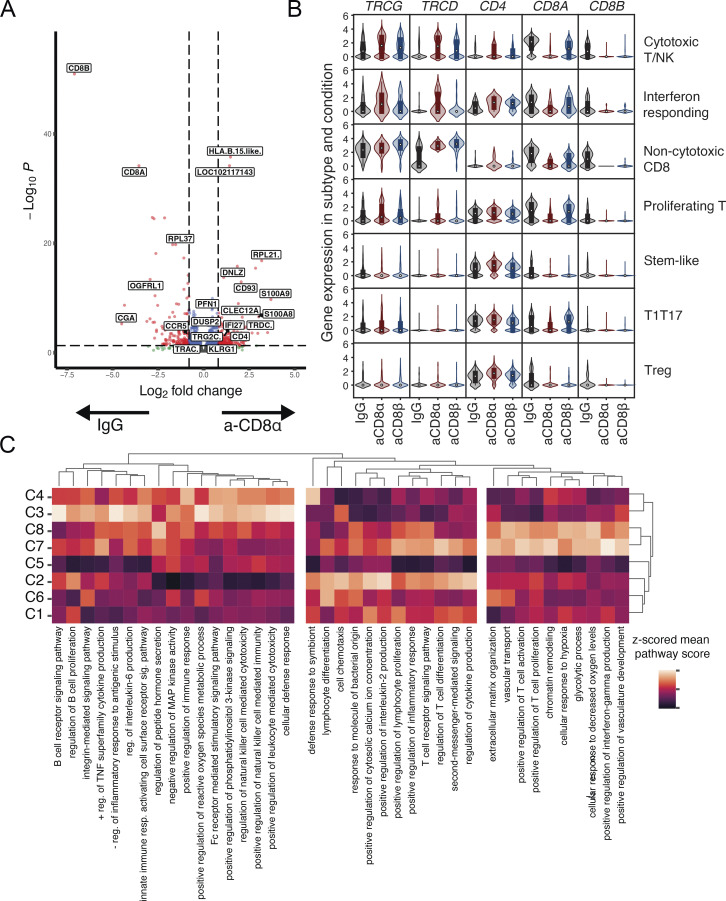
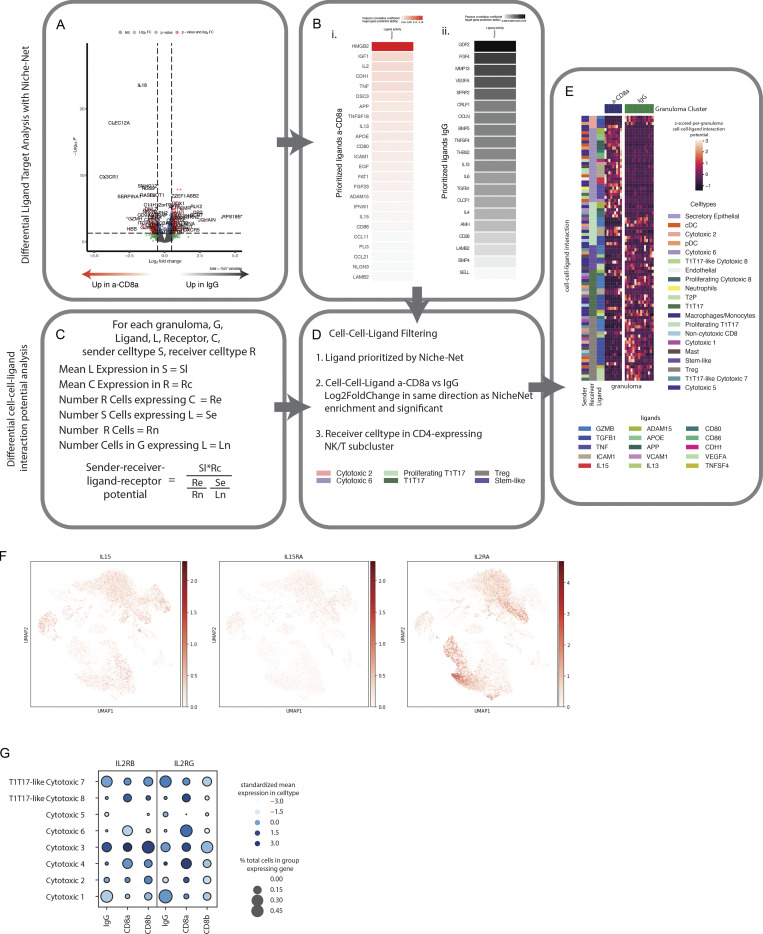
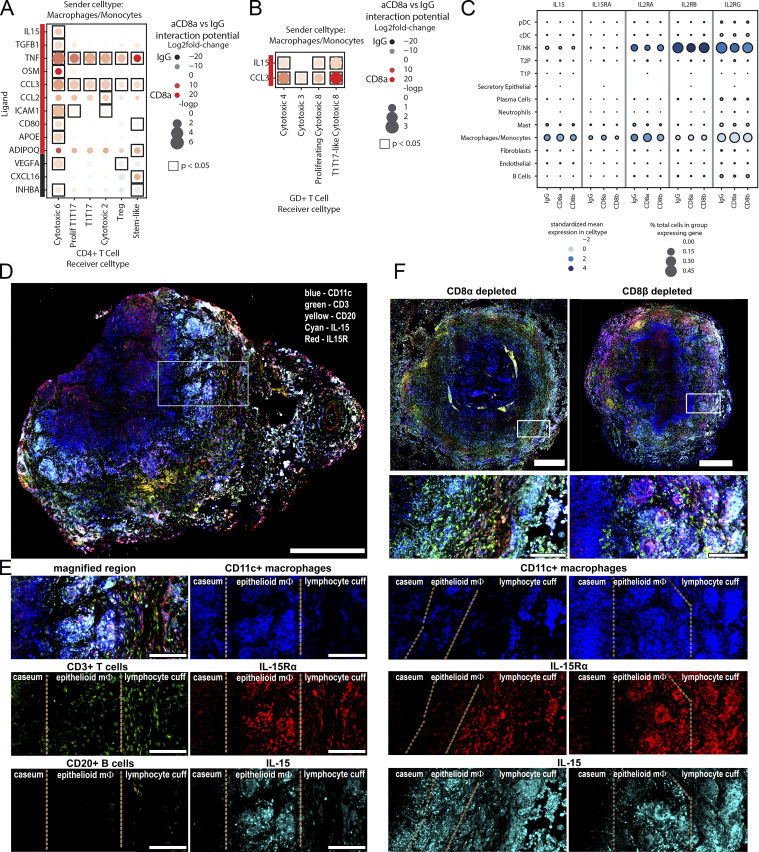
The functional role of CD8+ lymphocytes in tuberculosis remains poorly understood. We depleted innate and/or adaptive CD8+ lymphocytes in macaques and showed that loss of all CD8α+ cells (using anti-CD8α antibody) significantly impaired early control of Mycobacterium tuberculosis (Mtb) infection, leading to increased granulomas, lung inflammation, and bacterial burden. Analysis of barcoded Mtb from infected macaques demonstrated that depletion of all CD8+ lymphocytes allowed increased establishment of Mtb in lungs and dissemination within lungs and to lymph nodes, while depletion of only adaptive CD8+ T cells (with anti-CD8β antibody) worsened bacterial control in lymph nodes. Flow cytometry and single-cell RNA sequencing revealed polyfunctional cytotoxic CD8+ lymphocytes in control granulomas, while CD8-depleted animals were unexpectedly enriched in CD4 and γδ T cells adopting incomplete cytotoxic signatures. Ligand-receptor analyses identified IL-15 signaling in granulomas as a driver of cytotoxic T cells. These data support that CD8+ lymphocytes are required for early protection against Mtb and suggest polyfunctional cytotoxic responses as a vaccine target.


Conflict of interest statement

Disclosures: J.M. Rosenberg reported personal fees from Third Rock Ventures outside the submitted work. No other disclosures were reported.

Figures

Figure S1.
Figure S1.
Study design, CD8 cell depletion, and serial PET CT scans. (A) Schematic of study design. Cynomolgus macaques (n = 5 per group) were depleted with anti-CD8β antibody (blue) for 8 wk prior to infection to ensure efficient depletion, while IgG (black) and anti-CD8α antibody (red) were administered for 2 wk prior to infection Depletion antibodies were administered every 2 wk throughout the study. Animals were infected with genetically barcoded Mtb ranging from 19 to 23 CFU. Bronchoalveolar lavages were acquired pre-infection and at 3 wk after infection. PET CT scans were performed at 3 and 6 wk after infection, the latter serving as the pre-necropsy scan for guiding granuloma and tissue acquisition at necropsy. Created with BioRender.com. (B) Peripheral blood mononuclear cells cell counts of CD4 (black, CD3+CD4+), CD8αα (blue, CD3+CD8α+CD8βneg), and CD8αβ (purple, CD3+CD8α+CD8β+) T cells throughout depletion. Vertical dotted line indicates the time of Mtb infection. Bar plots (right) show frequencies of lymphocyte populations at necropsy (6 wk after infection) with cell definitions matching granuloma data in Fig. 2. (C) Frequency of cell populations identified in the BAL are shown pre-depletion (uninfected) and 3 wk after infection by depletion group. Expanded cell populations define γδ T cells (pink, CD3+ γδTCR+) with CD4 T cells and double negative T cells falling under the CD8neg T cell category (black). CD8αα T cells and CD8αβ T cells are γδ TCR negative. CD3neg lymphocytes include B cells, ILCs and NK cells. (D) Total lung FDG activity (top) and numbers of lung granulomas (bottom) quantified from PET CT imaging. Each color is an individual monkey, and the lines connect the serial scans for each animal.
Figure 1.
Figure 1.
CD8 depletion leads to increased lung inflammation, number of granulomas, and bacterial burden. (A) 3D rendering of pre-necropsy PET CT scan for each animal (left) with total lung FDG activity and the number of granulomas (right) at necropsy (6 wk after infection). (B) Total thoracic (left), lung (middle), and lymph node (right) bacterial burden. Each color represents an animal; bar represents median values. (C) Numbers of lymph nodes and lung lobes that were positive for CFU for each animal. (D) Total pathology and extrapulmonary pathology scores from necropsy. Statistical analysis: A: Kruskal–Wallis test with Dunn’s multiple comparisons. B–D: One way ANOVA with Dunnett’s multiple comparisons. ** P < 0.01, * P < 0.05, ns P > 0.05.
Figure 2.
Figure 2.
CD8α depletion leads to the dissemination of barcoded Mtb clones across anatomical sites. (A) Circos plot summarizing barcoded Mtb strains shared between infected tissues in lungs (red), thoracic lymph nodes (blue), and at extrapulmonary sites (green). RUL, right upper lobe; RML, right middle lobe; RLL, right lower lobe; LUL, left upper lobe; LML, left middle lobe; LLL, left lower lobe; Acc, accessory lobe. Each color represents a unique barcode sequence and barcodes shared across tissues are linked by a ribbon (Track 1). Additional tracks include the time of lung lesion detection by PET-CT (track 2) at 3 wk (gray) or 6 wk after infection (orange) and bacterial burden in each tissue at necropsy (track 3). (B) Barcode plots from each animal; one animal in the anti-CD8β group failed sequencing and is not included in the analysis. (C) The number of total unique barcode sequences found across all tissues in each animal was quantified. (D) The percent of unique barcoded Mtb strains in each animal that are shared at two or more anatomical sites was quantified. (E) The total percentage of tissues sharing a given barcode was quantified for each group, yielding the following number of barcodes plotted in each treatment group: IgG control, n = 62; CD8α depletion, n = 113; CD8β depletion, n = 65. (F and G) The percent of lung tissues sharing a barcoded Mtb strain with any (F) thoracic lymph node site or (G) extrapoulmonary site was determined for each animal as a measure of dissemination. For data in B–E, the number of animals were as follows: IgG control, n = 5; CD8β depletion, n = 4; CD8α depletion, n = 5. Statistical analysis (C–G): Kruskal–Wallis with Dunn’s multiple comparisons. * P < 0.05, ns P > 0.05.
Figure S2.
Figure S2.
BAL from uninfected macaques is comprised of macrophages and innate and adaptive T cells. BAL was performed on uninfected cynomolgus macaques, and the cells were analyzed by flow cytometry. (A) Gating strategy for flow cytometry. (B and C) The distribution of myeloid and lymphoid cells in the BAL of two uninfected macaques (monkey numbers 922 and 1222) (B) and the composition of cell types within the lymphocyte gate (C). (D) BAL cells from monkeys 922 and 1222 were stimulated with media, mycobacterial whole-cell lysate (WCL) or ESAT-6/CFP10 (E6/C10) peptides to assess mycobacterial (WCL) or Mtb specific (ESAT6/CFP10) responses using cytotoxic effectors granzyme B (GrzB), granulysin (GNLY), and perforin (PRF) (top row) or cytokines IFN-γ and TNF (bottom row) using intracellular staining and flow cytometry. Shown are responses from CD8αα T cells, CD8αβ T cells, and CD4 T cells. There was no apparent increase in effector molecule expression following stimulation of the uninfected BAL cells.
Figure S3.
Figure S3.
Flow cytometry on tissue samples from infected macaques. (A) Gating strategy for defining lymphocyte populations in tissues at necropsy (Fig. 2). (B) The majority of CD8α+CD3CD20 lymphocytes in lung granulomas are NK cells (NKG2A+ or NKG2A+CD16+). An example of lung granuloma from a control (IgG) animal is shown. (C) Simplified lymphocyte definitions based on lineage marker expression made using BioRender.com. (D) Cell counts of cell types identified within granulomas. Total cell numbers from individual lesions are indicated in smaller circles, with larger outlined points representing the mean per animal. Each color corresponds to an individual animal (n = 5 per treatment). Bar indicates median; statistical test: Kruskal–Wallis with Dunn’s multiple comparisons based on mean per animal. * P < 0.05, ns P > 0.05. (E) Flow cytometry gating for lymphocyte function on T cells from granulomas.
Figure 3.
Figure 3.
Cytotoxic effectors are prominent at early times after infection in granulomas. (A) Bars represent individual granulomas and the lymphocyte frequencies of each lesion, grouped by animal. Both non-T cell (CD3 negative) and T cell lymphocytes (CD3 positive) are shown based on marker expression on the key. Pie charts represent the median frequencies of lymphocyte populations for all granulomas per depletion group (IgG, n = 57; αCD8α, n = 64; αCD8β, n = 67). There was a reduction in the diversity of lymphocyte populations present within granulomas after CD8α-depletion, while CD8β depletion specifically depleted CD8αβ T cells (yellow). Statistical test: Kruskal–Wallis with Dunn’s multiple comparison adjustment on mean per animal of each cell subset (0.05 < P < 0.1, #; 0.01 < P < 0.05, *; 0.001 < P < 0.01, **). (B) Individual granulomas from control macaques were analyzed by flow cytometry for lymphocyte type and effector expression. (C) Cytokines (IFN-γ, TNF, IL-2, IL-17, and IL-10) or cytotoxic markers (granzyme B, granulysin, CD107a) were gated separately using an and/or function in FlowJo to assess total cytokine or cytotoxic potential in IgG control granulomas (6 wk after infection). Lines connect cells with cytokine potential vs. cytotoxic potential from the same granuloma. The pie chart (left) shows the mean lymphocyte composition of control granulomas, with each colored pie piece representing the frequency of each cell type above individual graphs. Statistics: Wilcoxon matched-pairs sign rank test. **** P < 0.0001, *** P < 0.001, ns P > 0.05.
Figure 4.
Figure 4.
CD8 depletion results in increased granzyme B expression in non-CD8 lymphocytes. (A) Combination gate analysis of flow cytometry data with various combinations of IFNγ, TNF, granzyme B, and granulysin production in CD8αβ, CD4, and γδ T cells from granulomas from control (left), αCD8α-treated (middle), and αCD8β-treated (right) macaques. CD8αβ T cells are shown only for control animals as they were depleted in αCD8 antibody–treated animals. Each bar represents a granuloma. (B) Frequency of granzyme B (top) or granulysin (bottom) expression by total T cells, CD4, and γδ T cells within individual granulomas (lighter color symbols are individual granulomas; darker outlined circles are mean of granulomas for each animal). (C) Expression frequency of cytokines and effectors by cell type in granulomas from IgG control animals. Each point is an individual granuloma, each color is a specific NHP. Parent population is labeled within the graph. (B and C) Lighter color symbols are individual granulomas, darker outlined circles are mean of granulomas for each animal. Bar indicates median. Statistics: Kruskal–Wallis test with Dunn’s multiple comparisons on the mean frequencies per animal. Bar indicates median. Statistics: Kruskal–Wallis test with Dunn’s multiple comparisons on the mean frequencies per animal. ** P < 0.01, * P < 0.05, ns P > 0.05.
Figure 5.
Figure 5.
General cell type clustering shows heterogeneity across granulomas. (A) UMAP visualization of 42,277 high-quality single cells colored by the 13 major cell types identified. Each point represents a single cell. (B) Marker genes for each cell type, with circle size representing the fraction of cells in the cell type (row) expressing the gene (column). Color represents the mean expression of that gene across cells from the cell type standardized across genes between 0 and 1 (by column). (C) Density of cells in UMAP space within each depletion condition, normalized within the condition. (D) Proportion of each cell type in each granuloma grouped by condition. Each point represents a single granuloma’s proportion of one cell type. Brackets indicate significant pairwise differential abundance (* P values <0.05 by GLM; Materials and methods; Table S6). (E) UMAP visualization of further subclustering of macrophage/monocytes cell cluster colored by four subclusters. (F) Proportion of each macrophage/monocyte subcluster in E relative to total cells in each macrophage/monocyte subcluster. Brackets indicate significant pairwise differential abundance (P values <0.05 by GLM). (G and H) Marker genes for macrophage/monocytes subclusters as in B and H IL15 expression in each subcluster split by treatment condition. Legend shared with B. (I) Gene module scores, column standardized, for select GO biological programs found to be differential between CD8α-depleted macrophage/monocytes and IgG macrophage/monocytes. Each score is significantly higher between a-CD8a granulomas and IgG granulomas within each cell subset (Materials and methods). (J) UMAP visualization of further subclustering of cDC cell cluster colored by two subclusters. (K) Proportion of each cDC subcluster relative to total cDC cells in each granuloma as in F. (L) UMAP from J colored by depletion condition. (M) UMAP from J split by depletion condition (left to right: a-CD8α, a-CD8β, IgG) colored by normalized gene expression of CD8A and select cDC subset marker genes CLEC9A and CD1C in cells from that condition. (N) Select GO programs differential between cDCs from CD8α-depleted granulomas compared to IgG, as in I. Abbreviations: Sec Epi, secretory epithelial; T1P, type 1 pneumocyte; Mac/Mono, macrophages/monocytes; Fibro, fibroblasts; Neut., neutrophils; endo., endothelial cells; Inflam., inflammatory; Alv., alveolar; reg., regulation; prod., production; pos, positive; resp., response; sig., signaling; path., pathway.
Figure S4.
Figure S4.
scRNAseq quality control and subclustering plots. (A) UMAP visualization of major cell types and doublets cells pre-filtering. Each point is a cell. (B) Violin plot of per-cell expression of major lineage markers CD4, CD8A, CD8B (columns) in each major cell type (rows) split by depletion condition (violin plot colors). (C) Leiden subclustering on NK/T cells yielded 17 clusters, which were merged into seven subtypes based on shared marker genes. (D) Leiden subclustering on cytotoxic NK/T cells yielded 17 clusters, which were merged into nine subsets based on shared marker genes. (E) Leiden subclustering on Proliferating NK/T cells yielded seven clusters, which were merged into four proliferating subsets based on shared marker genes. Proliferating NK/T subset names were assigned based on shared marker genes with other NK/T cell subsets (C). (F) Dotplot showing expression of marker and lineage genes on all NK/T subtypes.
Figure 6.
Figure 6.
After CD8 depletion, CD4 and γδ T cell transcriptional profiles adopt partial cytotoxic signatures. (A) UMAP visualization of T/NK cells colored by broad T/NK cell subtype groupings. (B) Marker genes and canonical T phenotypic markers. Circle size represents the fraction of cells in the cell subtype (row) expressing the gene (column). Color represents the mean expression of that gene across cells from the cell subtype standardized across genes between 0 and 1 (by column). (C) Proportion of each NK/T subset within NK/T cells in each granuloma grouped by condition. Each point represents a single granuloma’s proportion of one cell subtype. Brackets indicate significant pairwise differential abundance (P values <0.05 by GLM; Materials and methods; Table S6). (D) UMAP coordinates of cytotoxic NK/T cells colored by cytotoxic subset across all conditions (top) or split by conditions with cells from other conditions colored in gray (bottom). (E) Expression of curated genes relevant to cytotoxic subcluster classification. Hierarchal clustering of cytotoxic subclusters identifies moonlighting pairs; odd numbered pairs are more prominent in IgG control granulomas while even numbered pairs are more prominent in CD8-depleted granulomas. (F) Proportion of each cytotoxic subset within cytotoxic NK/T cells in each granuloma grouped by condition. Each point represents a single granuloma’s proportion of one cell subset. Brackets indicate significant pairwise differential abundance (P values <0.05 by GLM; Materials and methods; Table S6). (G) Gene set score of CD8 cytotoxic and CD8 cytokine gene lists on cells in each NK/T cell subset. Brackets indicate significant difference (P < 0.005 by one-sided Mann–Whitney U test).
Figure 7.
Figure 7.
NK/T treatment differential expression. (A) Volcano plot depicting differentially expressed genes within cytotoxic NK/T cells between granulomas in the anti-CD8a depletion group (right) compared with control (left). (B) Violin plots depicting single-cell expression of key lineage genes, TRGC, TRDC, CD4, CD8A, and CD8B, within each general NK/T subcluster (rows) split by each depletion group (violin colors). (C) Select GO results of moonlighting pair marker genes. Mean gene set scores for top GO pathway hits for each cytotoxic moonlighting pair were z-scored across cytotoxic subsets and then hierarchically clustered. Full GO analysis in Table S9.
Figure S5.
Figure S5.
Interaction analysis schematic. (A) Differential genes are selected between CD4-expressing, CD8-non-expressing cells between granulomas in granuloma cluster 2 versus granuloma cluster 4 using DESeq2. (B) Genes with log2FoldChange less than −0.5 and adjusted P value <0.05 are then used for NicheNet differential ligand analysis to identify ligands whose downstream targets are differential in granuloma cluster 2 cells (B.i) and those with log2FoldChange >0.5 used to identify ligands whose downstream targets are differential in granuloma cluster 4 cells (B.ii). (C) Cell–cell–ligand interaction potentials are calculated for each sender cell subset, receiver cell subset, ligand triplet using receptor and ligand expression levels and subset proportions. (D) Interactions involving ligands prioritized by NicheNet, whose receptor subset is a CD4-expressing NK/T cell subset, and whose interaction potential difference between cluster 4 and cluster 2 is with P < 0.05 by t test are included. (E) Heatmap of per-granuloma interaction potential of these cell–cell–ligand triplets, z-scored across granulomas (rows) grouped by sender cell subset (rows) and granuloma cluster (columns). (F) Feature plots of IL15, IL15RA, and IL2RA expression per cell visualized in UMAP space on all cells. (G) Relative gene expression of IL15 receptors as in C across only cytotoxic NK/T cell subsets.
Figure 8.
Figure 8.
Cell–cell interaction analysis reveals IL15 as a potential driver of CD4 and γδ T cell cytotoxicity. Changing interaction potential of sender (named on top of plots), receiver (named on bottom of plots), and ligand (y axis) triplets between CD8α-depleted and IgG granulomas which contain significant T cell proportions. Ligands selected by NicheNet as potential drivers with significant changes in cell–cell interaction potential in at least one cell subset pair are included. Color on y axis indicates the direction of NicheNet enrichment (red, αCD8α; black, IgG). Significant changes (P < 0.05, non-adjusted t test) in interaction potential between sender and receiver via a given ligand (row) are boxed. Dot color indicates magnitude and direction of log2FoldChange between anti-CD8α granulomas (red) and IgG granulomas (black), and dot size indicates −log P value. (A and B) Ligand–receptor interaction analysis comparisons are shown for interactions with sender macrophages to receiver CD4-expressing T cells (A) and macrophages to TRGC/TRDC-expressing T cells (B). (C) Relative gene expression of IL15 signaling ligand and receptors in each major cell type. Circle size indicates percent of cells expressing gene out of all cells in that condition. Circle color indicates mean expression of gene of cells within cell type and condition z-scored within each gene across all cell types and conditions. (D) A granuloma from monkey 30418, an animal in the IgG control group, was stained for cell subsets to show the spatial localization of IL-15RA and IL-15 expression and macrophage and lymphocyte subsets. Scale bar represents 500 mm. (E) Representative granuloma regions magnified from A (white box) detailing the cell-level expression patterns of IL-15RA and IL-15. (F) Granulomas from monkeys 29118 (CD8α-depleted) and 30318 (CD8β-depleted) were stained for cell subsets to show the overall pattern of expression for IL-15RA and IL-15. The bright and sharply edged CD20 and IL-15 fluorescence in the center of the granuloma from 29118 (CD8α-depleted) are staining-associated artifacts and do not represent actual CD20 or IL-15 expression. Scale bar represents 500 μm (top images). Representative granuloma regions magnified from panel F (white boxes) detailing the cell-level expression patterns of IL-15RA and IL-15. Granuloma regions were defined according the density and appearance of nuclei (not shown) to differentiate caseum (diffuse DNA staining indicative of necrosis), macrophage-rich regions (large and widely separate nuclei), and lymphocyte cuff (smaller and densely packed nuclei). Scale bars represent 100 μm (bottom images).

Comment in

References

    1. Amezquita, R.A., Lun A.T.L., Becht E., Carey V.J., Carpp L.N., Geistlinger L., Marini F., Rue-Albrecht K., Risso D., Soneson C., et al. . 2020. Orchestrating single-cell analysis with Bioconductor. Nat. Methods. 17:137–145. 10.1038/s41592-019-0654-x - DOI - PMC - PubMed
    1. Ashburner, M., Ball C.A., Blake J.A., Botstein D., Butler H., Cherry J.M., Davis A.P., Dolinski K., Dwight S.S., Eppig J.T., et al. . 2000. Gene ontology: Tool for the unification of biology. The gene ontology consortium. Nat. Genet. 25:25–29. 10.1038/75556 - DOI - PMC - PubMed
    1. Balin, S.J., Pellegrini M., Klechevsky E., Won S.T., Weiss D.I., Choi A.W., Hakimian J., Lu J., Ochoa M.T., Bloom B.R., et al. . 2018. Human antimicrobial cytotoxic T lymphocytes, defined by NK receptors and antimicrobial proteins, kill intracellular bacteria. Sci. Immunol. 3:eaat7668. 10.1126/sciimmunol.aat7668 - DOI - PMC - PubMed
    1. Berard, M., Brandt K., Bulfone-Paus S., and Tough D.F.. 2003. IL-15 promotes the survival of naive and memory phenotype CD8+ T cells. J. Immunol. 170:5018–5026. 10.4049/jimmunol.170.10.5018 - DOI - PubMed
    1. Browaeys, R., Saelens W., and Saeys Y.. 2020. NicheNet: Modeling intercellular communication by linking ligands to target genes. Nat. Methods. 17:159–162. 10.1038/s41592-019-0667-5 - DOI - PubMed

Publication types