. 2024 Jan 5;30(1):198-208.
doi: 10.1158/1078-0432.CCR-23-1317.

Landscape of Clinical Resistance Mechanisms to FGFR Inhibitors in FGFR2-Altered Cholangiocarcinoma

Affiliations

Landscape of Clinical Resistance Mechanisms to FGFR Inhibitors in FGFR2-Altered Cholangiocarcinoma

Qibiao Wu et al. Clin Cancer Res. .

Abstract

Purpose: FGFR inhibitors are effective in FGFR2-altered cholangiocarcinoma, leading to approval of reversible FGFR inhibitors, pemigatinib and infigratinib, and an irreversible inhibitor, futibatinib. However, acquired resistance develops, limiting clinical benefit. Some mechanisms of resistance have been reported, including secondary FGFR2 kinase domain mutations. Here, we sought to establish the landscape of acquired resistance to FGFR inhibition and to validate findings in model systems.

Experimental design: We examined the spectrum of acquired resistance mechanisms detected in circulating tumor DNA or tumor tissue upon disease progression following FGFR inhibitor therapy in 82 FGFR2-altered cholangiocarcinoma patients from 12 published reports. Functional studies of candidate resistance alterations were performed.

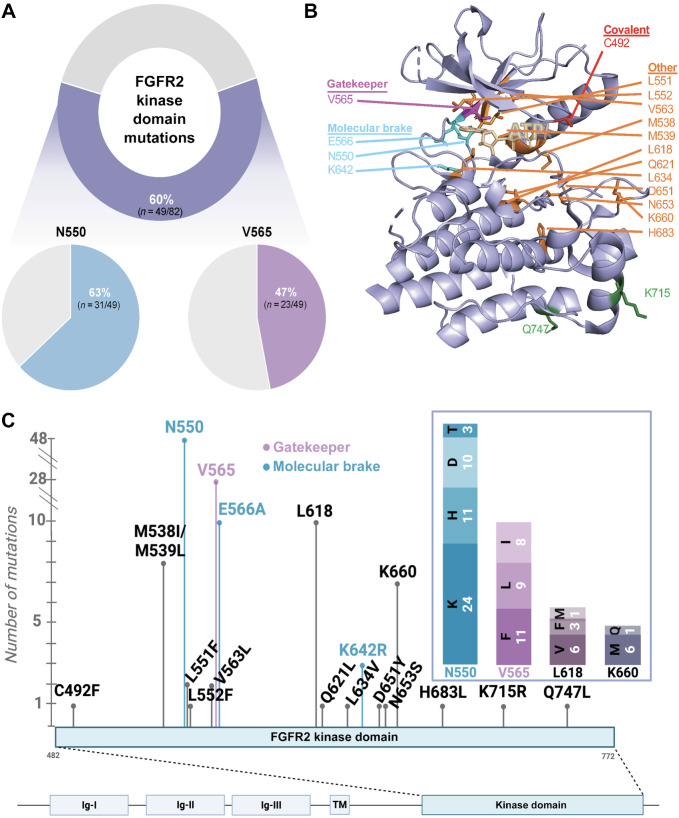
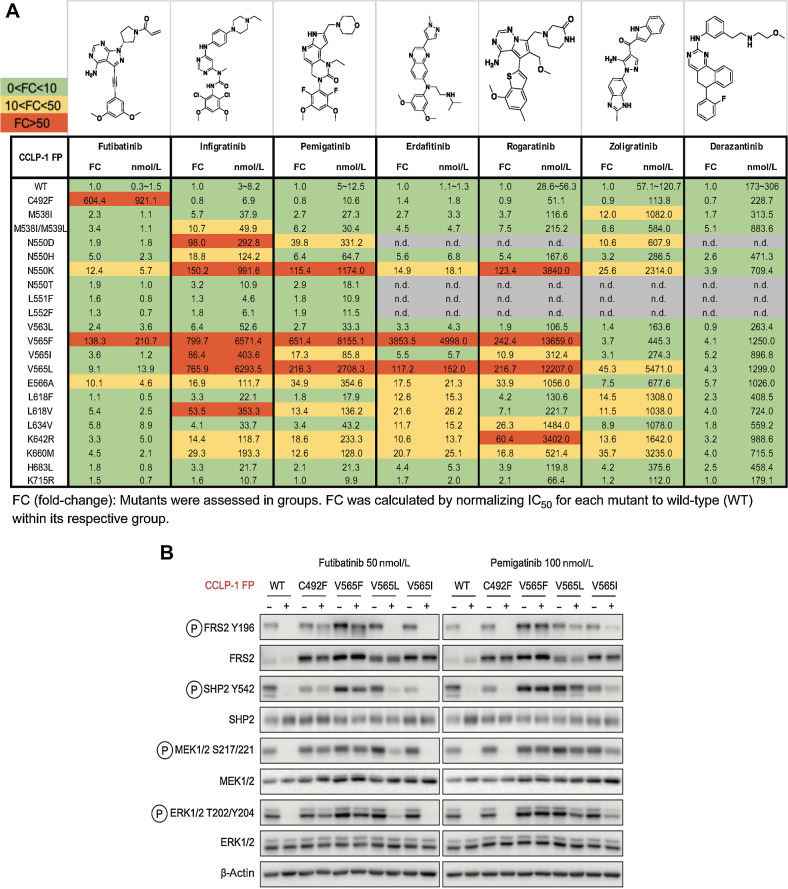
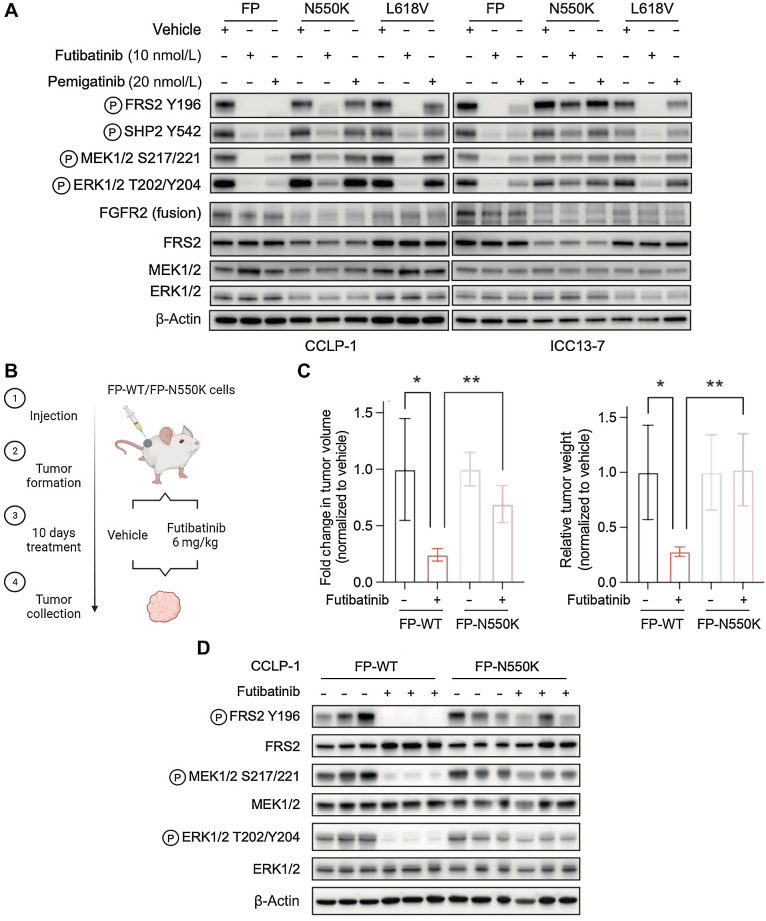
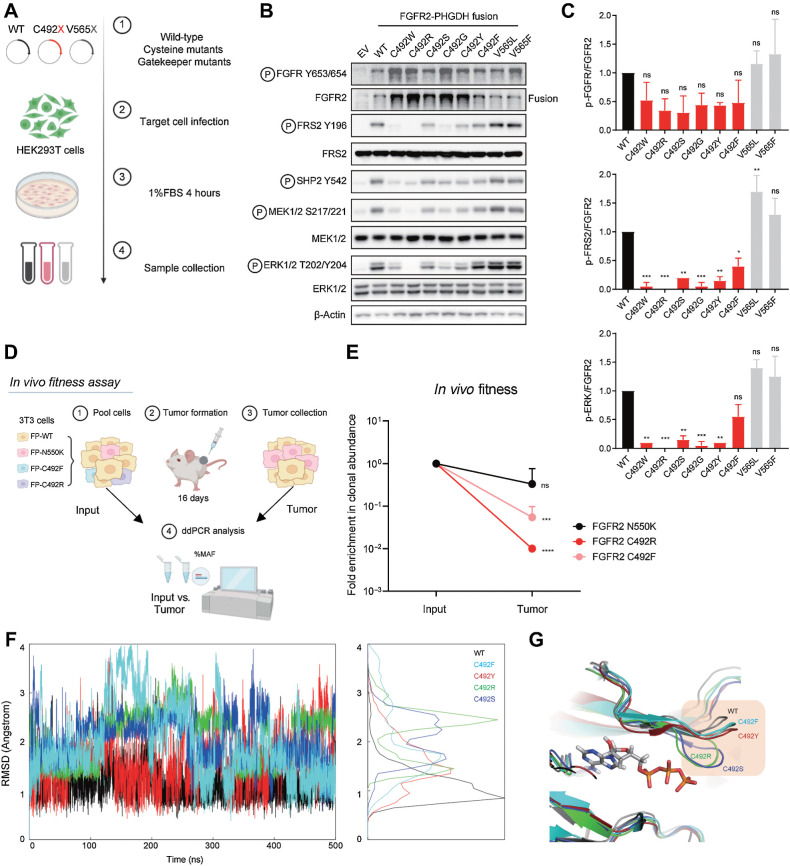
Results: Overall, 49 of 82 patients (60%) had one or more detectable secondary FGFR2 kinase domain mutations upon acquired resistance. N550 molecular brake and V565 gatekeeper mutations were most common, representing 63% and 47% of all FGFR2 kinase domain mutations, respectively. Functional studies showed different inhibitors displayed unique activity profiles against FGFR2 mutations. Interestingly, disruption of the cysteine residue covalently bound by futibatinib (FGFR2 C492) was rare, observed in 1 of 42 patients treated with this drug. FGFR2 C492 mutations were insensitive to inhibition by futibatinib but showed reduced signaling activity, potentially explaining their low frequency.

Conclusions: These data support secondary FGFR2 kinase domain mutations as the primary mode of acquired resistance to FGFR inhibitors, most commonly N550 and V565 mutations. Thus, development of combination strategies and next-generation FGFR inhibitors targeting the full spectrum of FGFR2 resistance mutations will be critical.


Figures

Figure 1. Landscape of acquired alterations on FGFR inhibitors. A, Frequency of FGFR2 kinase domain mutations on FGFR inhibitors. Ribbon diagram (B) and schematic (C) showing location and overall frequency of the secondary FGFR2 kinase domain mutations. (B, Created with PyMOL. C, Created with BioRender.com.)
Figure 1.
Landscape of acquired alterations on FGFR inhibitors. A, Frequency of FGFR2 kinase domain mutations on FGFR inhibitors. Ribbon diagram (B) and schematic (C) showing location and overall frequency of the secondary FGFR2 kinase domain mutations. (B, Created with PyMOL. C, Created with BioRender.com.)
Figure 2. FGFR inhibitors show differential activity profiles against the spectrum of clinically observed FGFR2 kinase domain mutations. A, Activity profiles of the indicated FGFR kinase inhibitors against FGFR-dependent CCLP-1 cells expressing the FGFR2-PHGDH fusion (FP) with a WT kinase domain or with different FGFR2 kinase domain mutations. The table reports IC50 values and fold changes. Mutants were tested in groups. FC denotes fold-change of IC50 for FGFR2 mutant normalized to the IC50 for the WT kinase within an individual group. Each value was representative of the mean of two biological replicates. B, Immunoblot analysis of signaling proteins in CCLP-1 cells engineered to express the indicated FGFR2-PHGDH fusion alleles. Cells were treated with vehicle, 50 nmol/L futibatinib, or 100 nmol/L pemigatinib for 4 hours. (A, Created with ChemDraw.)
Figure 2.
FGFR inhibitors show differential activity profiles against the spectrum of clinically observed FGFR2 kinase domain mutations. A, Activity profiles of the indicated FGFR kinase inhibitors against FGFR-dependent CCLP-1 cells expressing the FGFR2-PHGDH fusion (FP) with a WT kinase domain or with different FGFR2 kinase domain mutations. The table reports IC50 values and fold changes. Mutants were tested in groups. FC denotes fold-change of IC50 for FGFR2 mutant normalized to the IC50 for the WT kinase within an individual group. Each value was representative of the mean of two biological replicates. B, Immunoblot analysis of signaling proteins in CCLP-1 cells engineered to express the indicated FGFR2-PHGDH fusion alleles. Cells were treated with vehicle, 50 nmol/L futibatinib, or 100 nmol/L pemigatinib for 4 hours. (A, Created with ChemDraw.)
Figure 3. The recurrent molecular brake mutation, N550K, drives resistance to clinically achievable pan-FGFR TKI dose levels. A, Immunoblot analysis of signaling proteins in CCLP-1 or ICC13–7 cells engineered to express the FGFR2–PHGDH fusion protein with wild-type kinase domain or with the N550K or L618V mutations. Cells were treated with vehicle, 10 nmol/L futibatinib, or 20 nmol/L pemigatinib for 4 hours. B–D, In vivo assessment of futibatinib efficacy against the FGFR2 molecular brake mutation, N550K. B, Schematic diagram of experiment design. Mice harboring FGFR-dependent CCLP-1 xenografts expressing the indicated FGFR2-PHGDH fusion (FP) with a WT kinase domain or with the N550K mutation were treated with vehicle (n = 4) or futibatinib 6 mg/kg (n = 4) daily for 10 days. Treatment was started once tumors reached a volume approximately 200 mm3. C, Relative fold change of tumor volume (left) or tumor weight (right) compared with vehicle treatment at the end point. **, P < 0.01. Data are shown as mean ± SD. D, Immunoblot analysis of tumor lysates. Tumors were harvested 4 hours after the last dose of treatment. (B, Created with BioRender.com.)
Figure 3.
The recurrent molecular brake mutation, N550K, drives resistance to clinically achievable pan-FGFR TKI dose levels. A, Immunoblot analysis of signaling proteins in CCLP-1 or ICC13–7 cells engineered to express the FGFR2–PHGDH fusion protein with wild-type kinase domain or with the N550K or L618V mutations. Cells were treated with vehicle, 10 nmol/L futibatinib, or 20 nmol/L pemigatinib for 4 hours. B–D,In vivo assessment of futibatinib efficacy against the FGFR2 molecular brake mutation, N550K. B, Schematic diagram of experiment design. Mice harboring FGFR-dependent CCLP-1 xenografts expressing the indicated FGFR2-PHGDH fusion (FP) with a WT kinase domain or with the N550K mutation were treated with vehicle (n = 4) or futibatinib 6 mg/kg (n = 4) daily for 10 days. Treatment was started once tumors reached a volume approximately 200 mm3. C, Relative fold change of tumor volume (left) or tumor weight (right) compared with vehicle treatment at the end point. **, P < 0.01. Data are shown as mean ± SD. D, Immunoblot analysis of tumor lysates. Tumors were harvested 4 hours after the last dose of treatment. (B, Created with BioRender.com.)
Figure 4. Mutation of FGFR2 C492 compromises FGFR2 signaling. A–C, Signaling analysis of FGFR2 fusion alleles harboring mutations of C492. A, Schematic view of signaling studies. 293T cells were engineered by retroviral transduction to stably express empty vector (EV) or the FGFR2–PHGDH fusion harboring a WT kinase domain, each mutation generated by single nucleotide changes at FGFR2 codon 492, or mutations at the gatekeeper (V565) residue. Immunoblot analysis of signaling proteins (B) and quantification (C). Quantifications were generated from two independent experiments. Data are shown as mean ± SD. Statistical comparison of WT vs. C492 variants by one-way ANOVA (C). D and E, Clonal fitness of cysteine mutations. D, Schematic view of in vivo fitness assay. NIH-3T3 cells engineered with the indicated mutants were pooled and injected subcutaneously into NSG mice. After 16 days, tumors were harvested and processed for ddPCR analysis. E, Clonal abundance of indicated mutants in vivo. Each point represents 3 replicates. Data are shown as mean ± SD. Statistical analysis of input versus tumor by unpaired t test. F–G, Molecular dynamics simulations of select FGFR2 C492 mutations. F, Fluctuations of the G-loop measured by root mean square deviation (RMSD). G, Representative structures from the simulation trajectory. (A and D, Created with BioRender.com. F, Created with R. G, Created with PyMOL.)
Figure 4.
Mutation of FGFR2 C492 compromises FGFR2 signaling. A–C, Signaling analysis of FGFR2 fusion alleles harboring mutations of C492. A, Schematic view of signaling studies. 293T cells were engineered by retroviral transduction to stably express empty vector (EV) or the FGFR2–PHGDH fusion harboring a WT kinase domain, each mutation generated by single nucleotide changes at FGFR2 codon 492, or mutations at the gatekeeper (V565) residue. Immunoblot analysis of signaling proteins (B) and quantification (C). Quantifications were generated from two independent experiments. Data are shown as mean ± SD. Statistical comparison of WT vs. C492 variants by one-way ANOVA (C). D and E, Clonal fitness of cysteine mutations. D, Schematic view of in vivo fitness assay. NIH-3T3 cells engineered with the indicated mutants were pooled and injected subcutaneously into NSG mice. After 16 days, tumors were harvested and processed for ddPCR analysis. E, Clonal abundance of indicated mutants in vivo. Each point represents 3 replicates. Data are shown as mean ± SD. Statistical analysis of input versus tumor by unpaired t test. F–G, Molecular dynamics simulations of select FGFR2 C492 mutations. F, Fluctuations of the G-loop measured by root mean square deviation (RMSD). G, Representative structures from the simulation trajectory. (A and D, Created with BioRender.com. F, Created with R. G, Created with PyMOL.)

References

    1. Cleary JM, Raghavan S, Wu Q, Li YY, Spurr LF, Gupta HV, et al. . FGFR2 extracellular domain in-frame deletions are therapeutically targetable genomic alterations that function as oncogenic drivers in cholangiocarcinoma. Cancer Discov 2021;11:2488–505. - PMC - PubMed
    1. Jusakul A, Cutcutache I, Yong CH, Lim JQ, Huang MN, Padmanabhan N, et al. . Whole-genome and epigenomic landscapes of etiologically distinct subtypes of cholangiocarcinoma. Cancer Discov 2017;7:1116–35. - PMC - PubMed
    1. Nakamura H, Arai Y, Totoki Y, Shirota T, Elzawahry A, Kato M, et al. . Genomic spectra of biliary tract cancer. Nat Genet 2015;47:1003–10. - PubMed
    1. Arai Y, Totoki Y, Hosoda F, Shirota T, Hama N, Nakamura H, et al. . Fibroblast growth factor receptor 2 tyrosine kinase fusions define a unique molecular subtype of cholangiocarcinoma. Hepatology 2014;59:1427–34. - PubMed
    1. Graham RP, Barr Fritcher EG, Pestova E, Schulz J, Sitailo LA, Vasmatzis G, et al. . Fibroblast growth factor receptor 2 translocations in intrahepatic cholangiocarcinoma. Hum Pathol 2014;45:1630–8. - PubMed

Publication types

MeSH terms

Substances