. 2023 Oct 31;42(10):113235.
doi: 10.1016/j.celrep.2023.113235. Epub 2023 Oct 14.

TERRA R-loops connect and protect sister telomeres in mitosis

Affiliations

TERRA R-loops connect and protect sister telomeres in mitosis

Samantha Sze et al. Cell Rep. .

Abstract

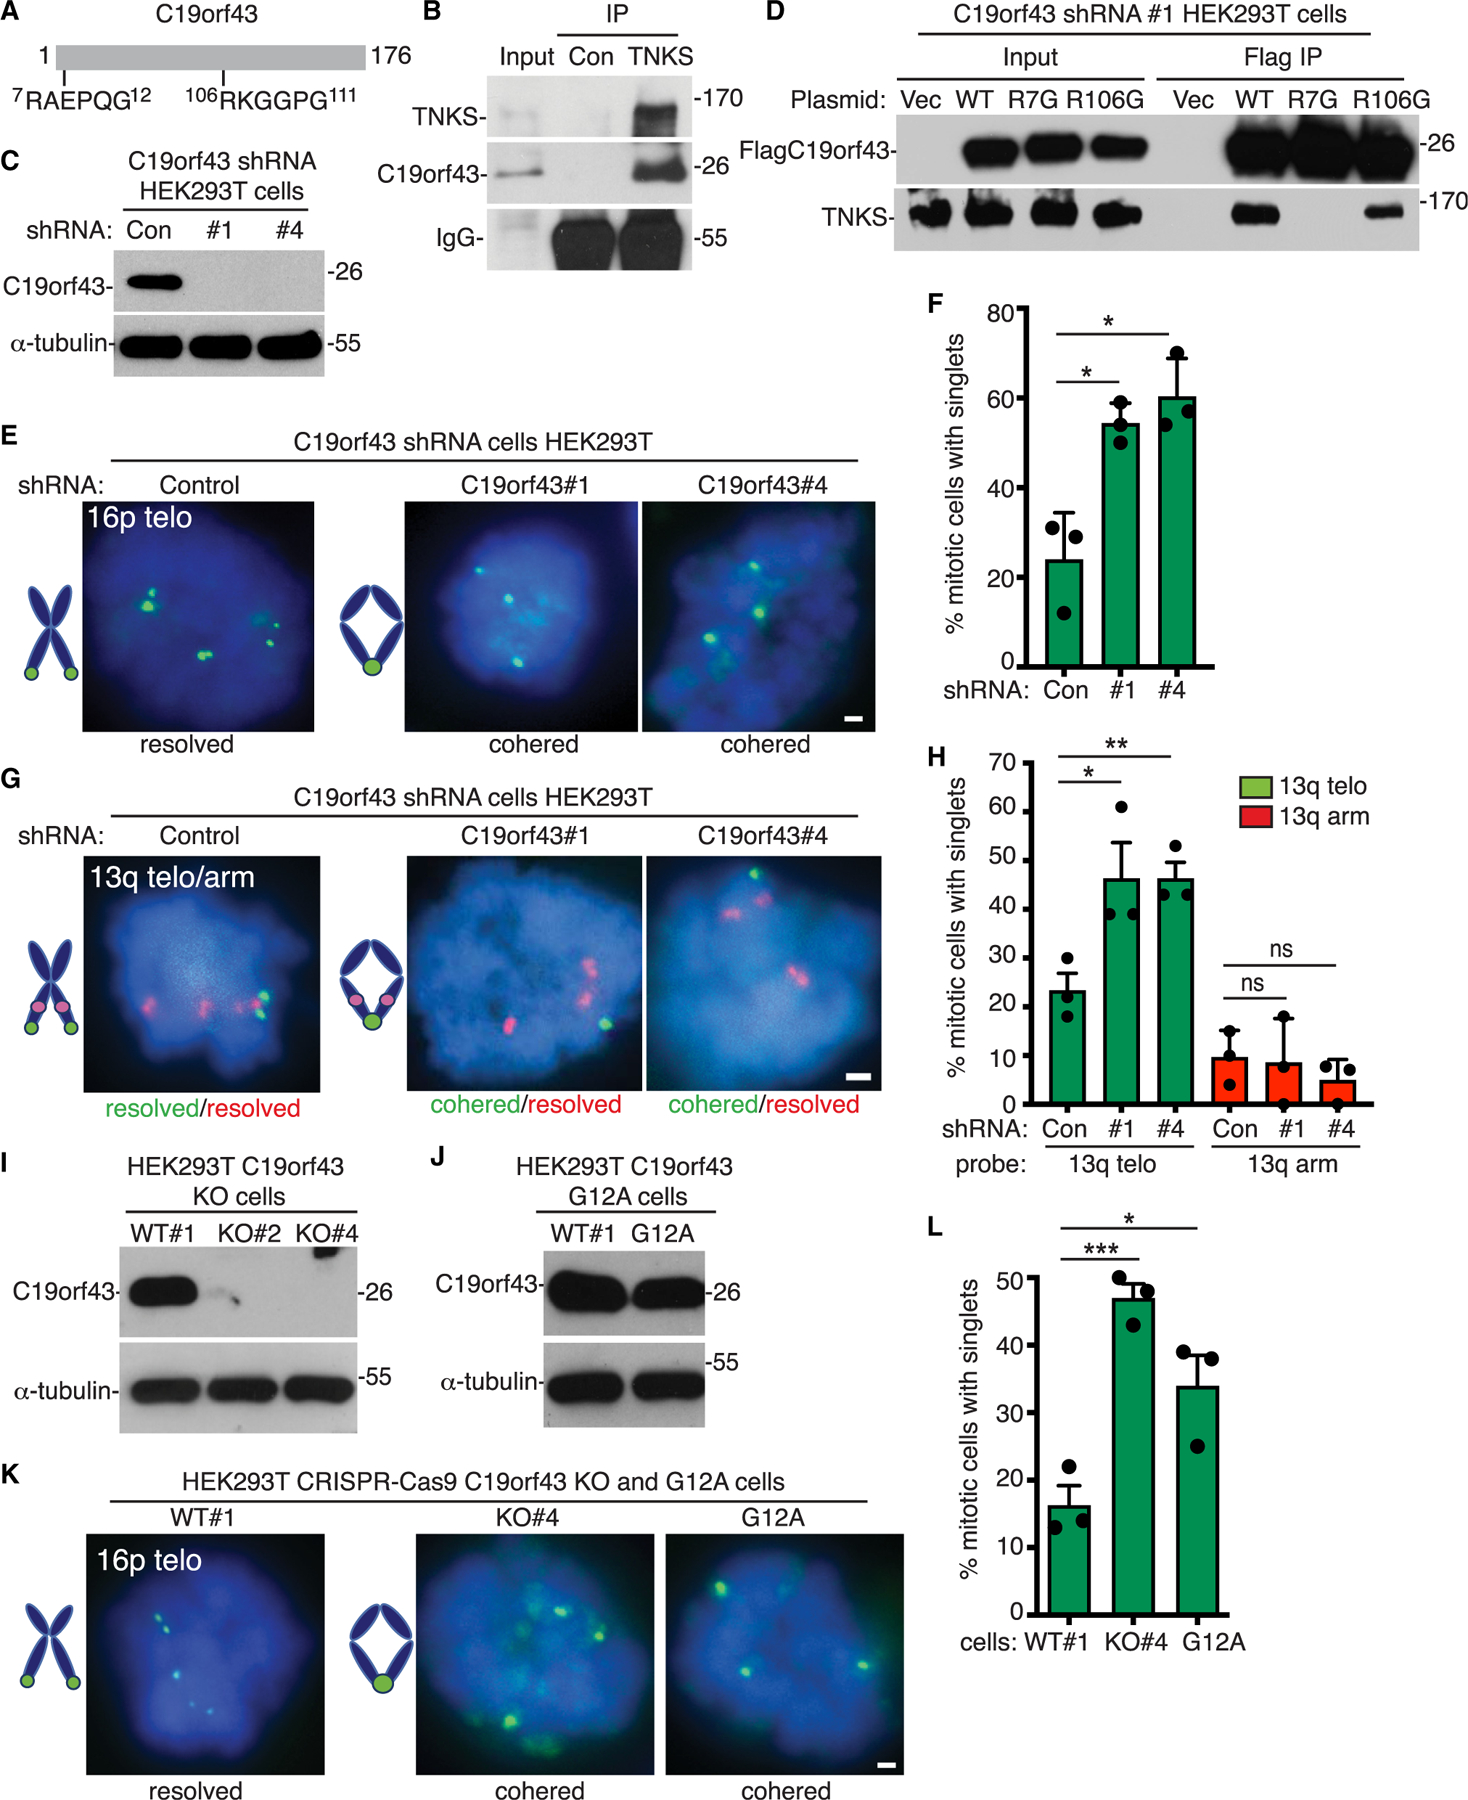
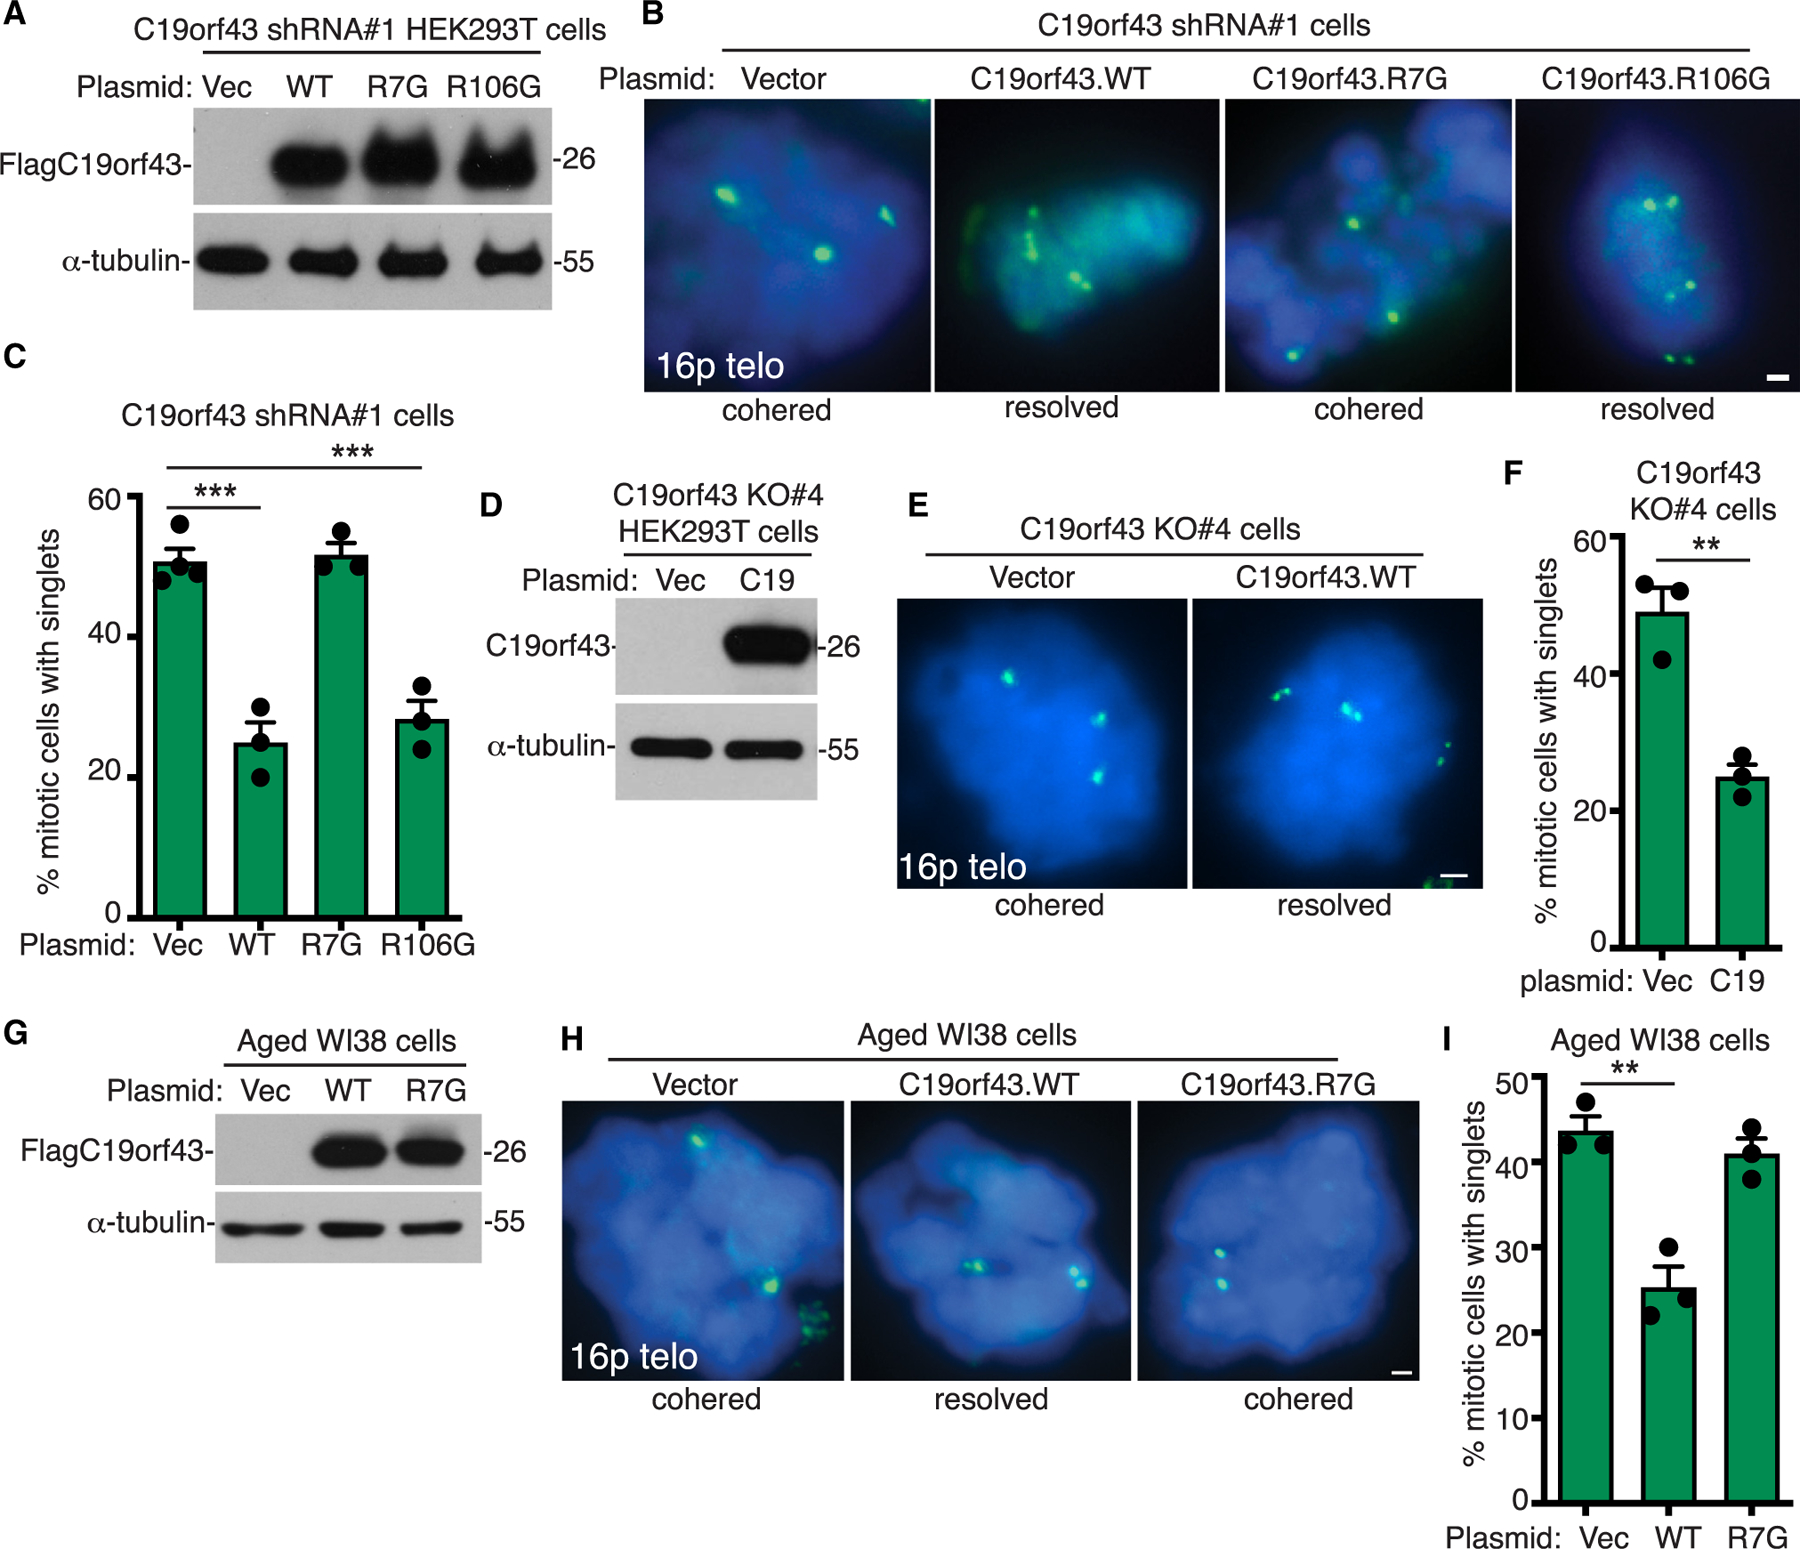
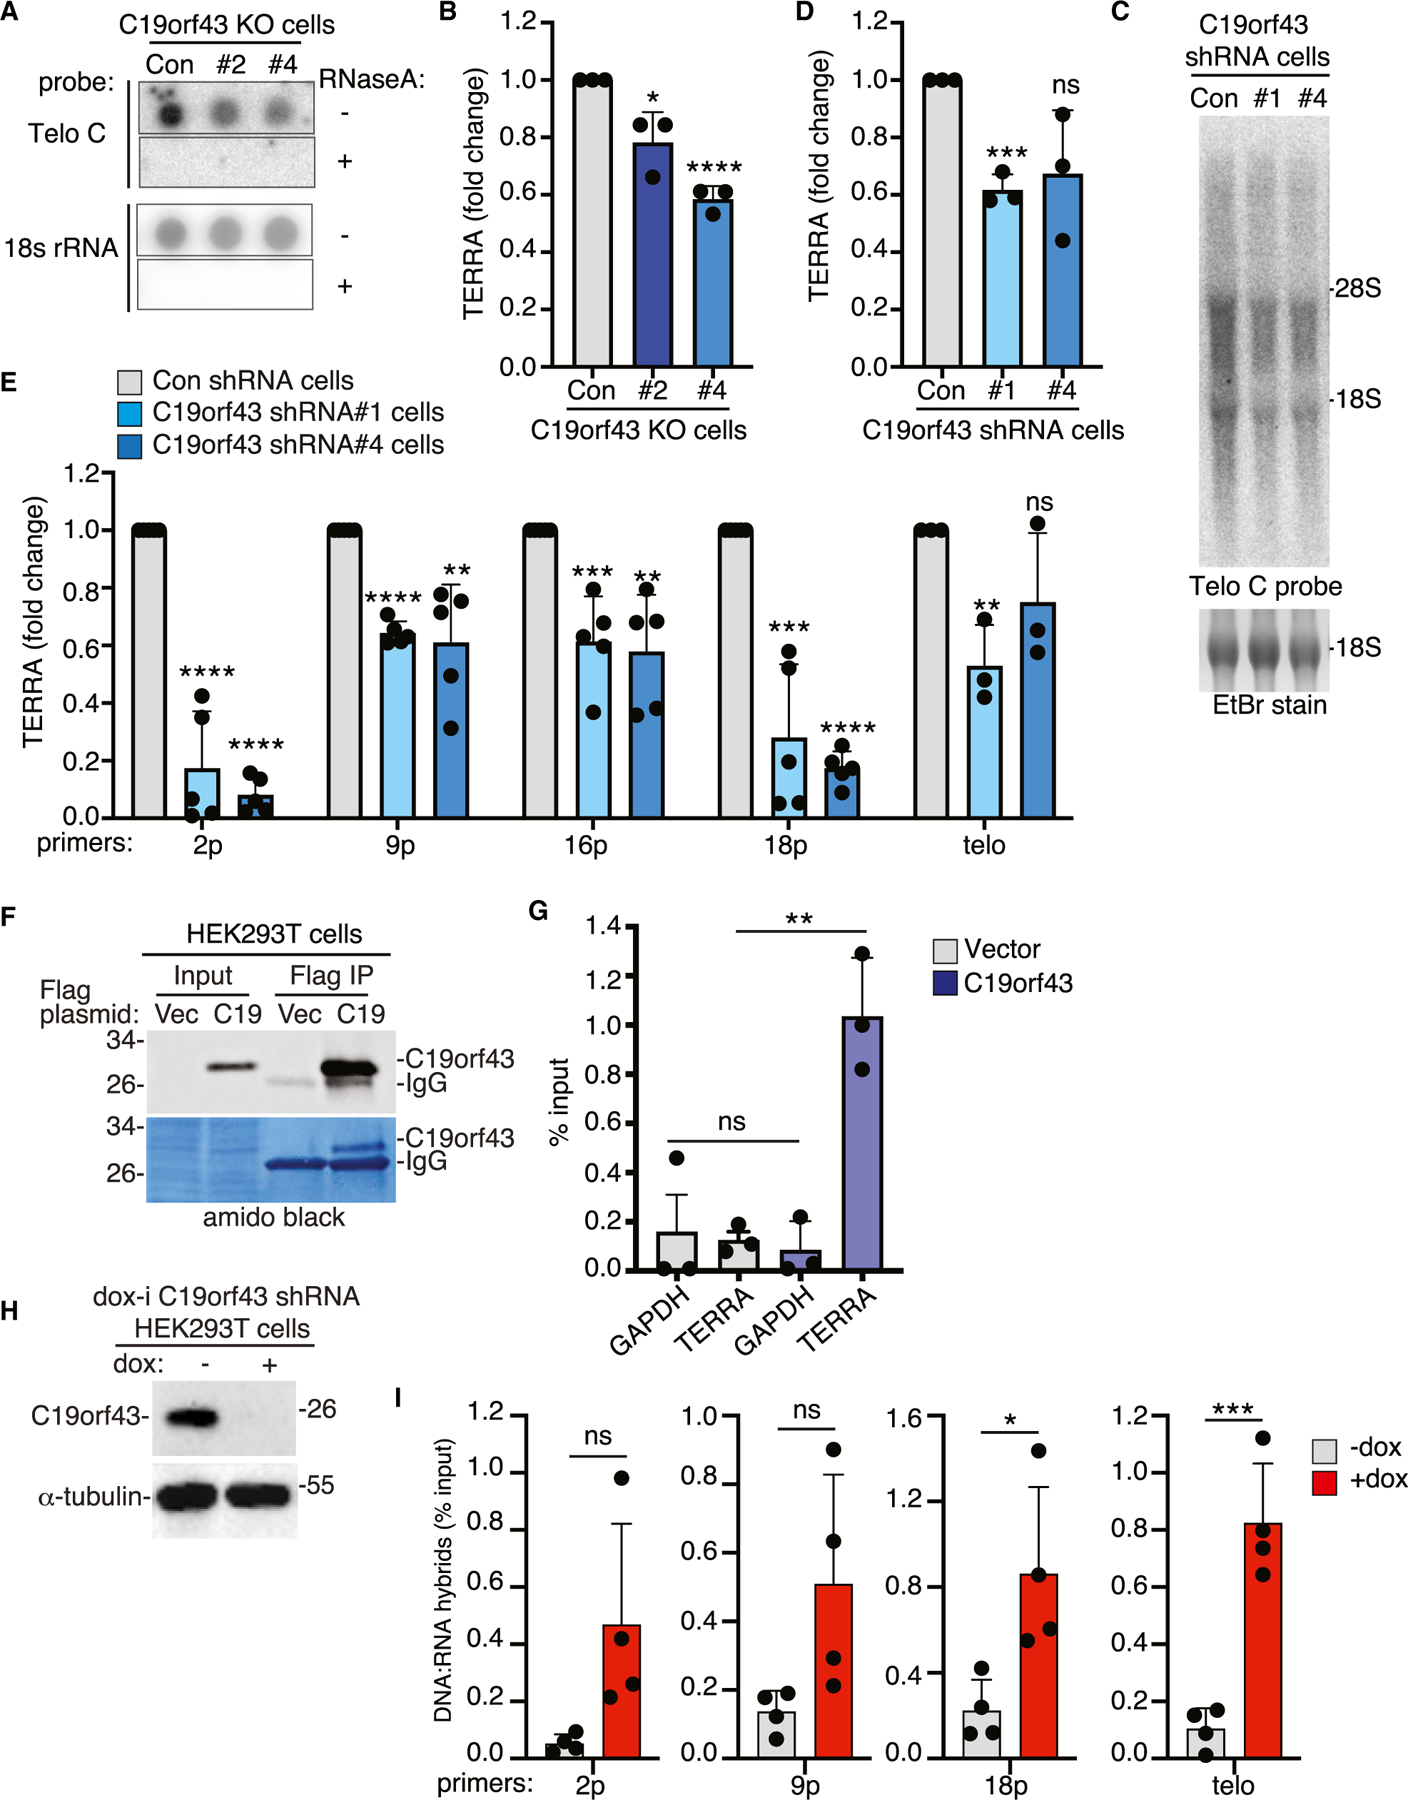
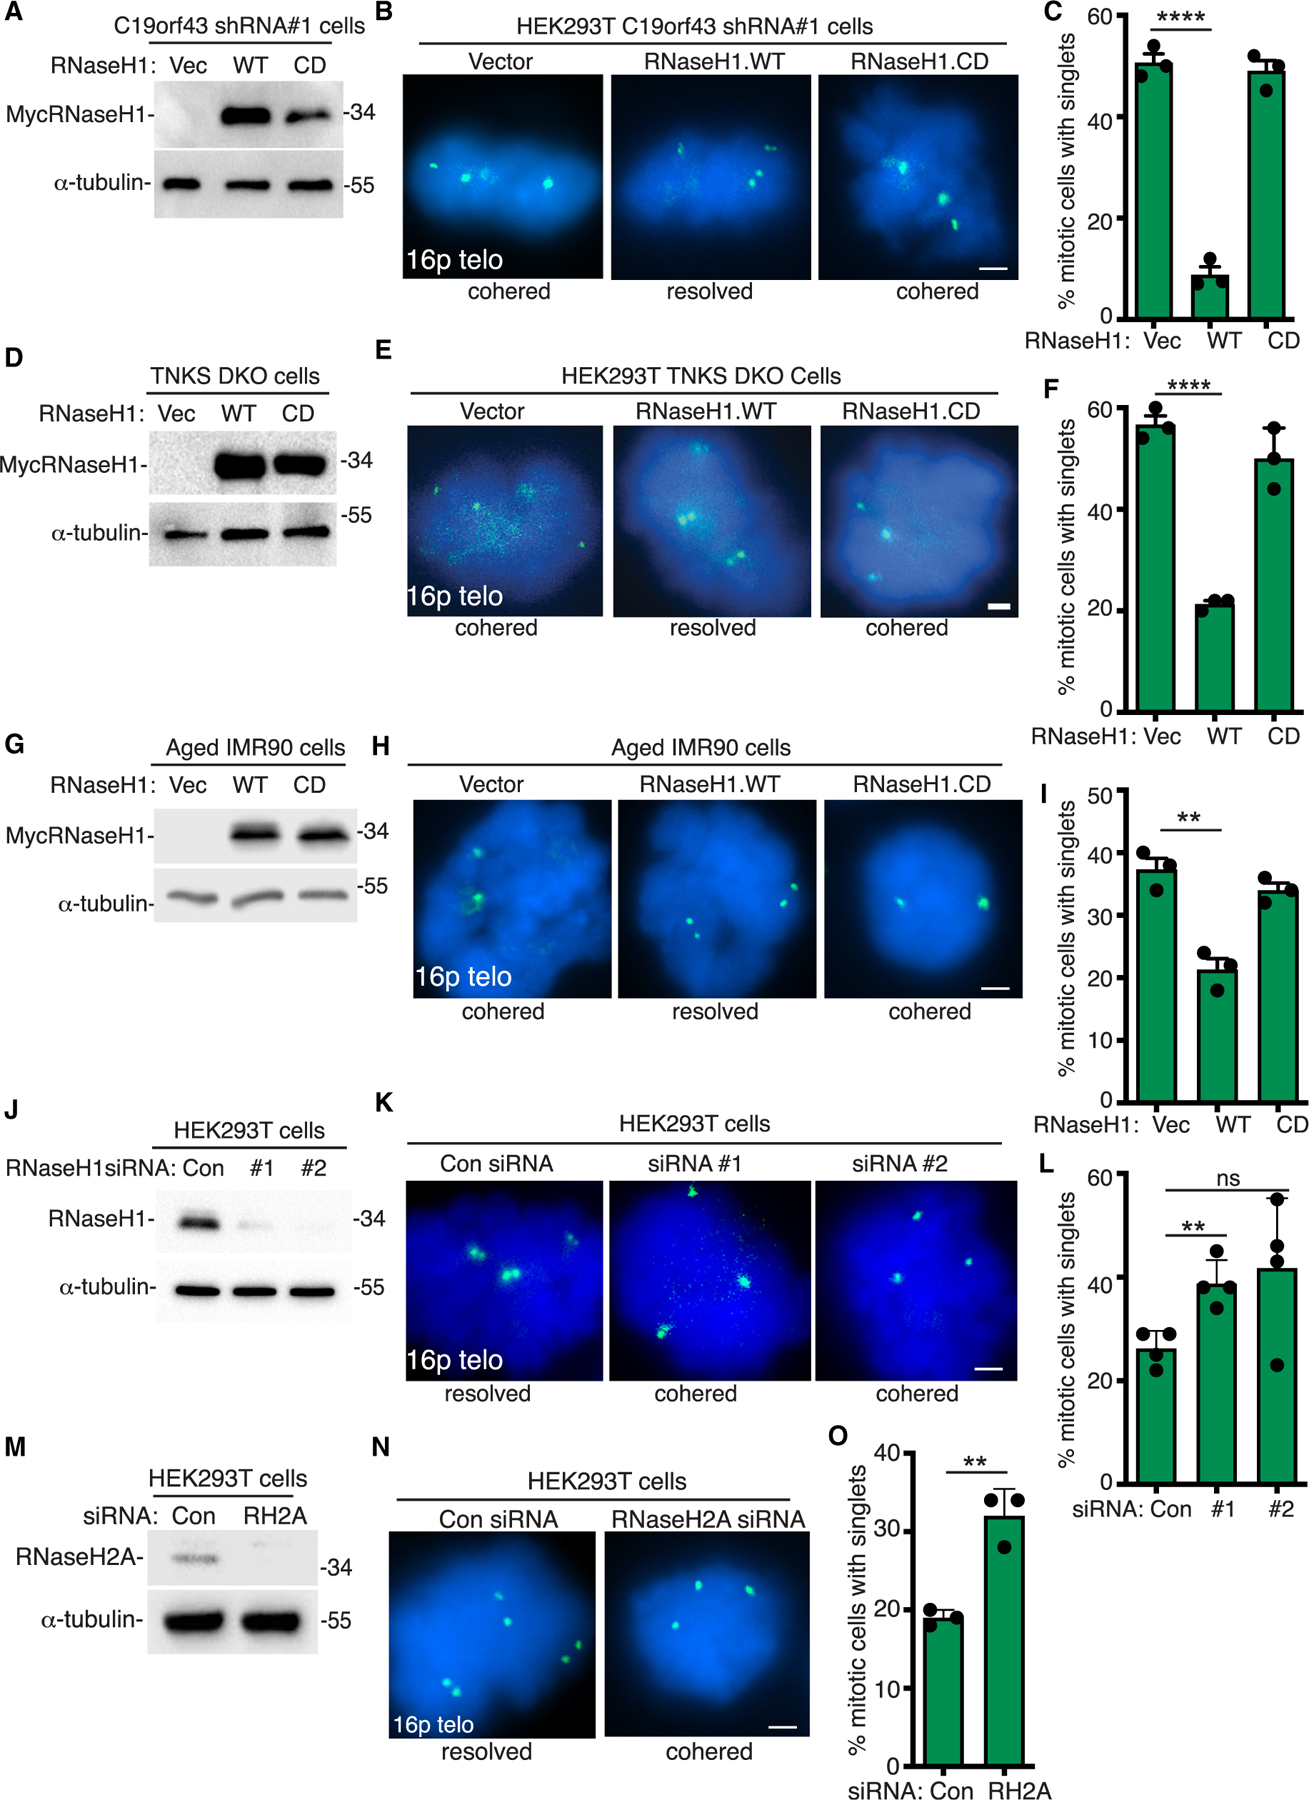
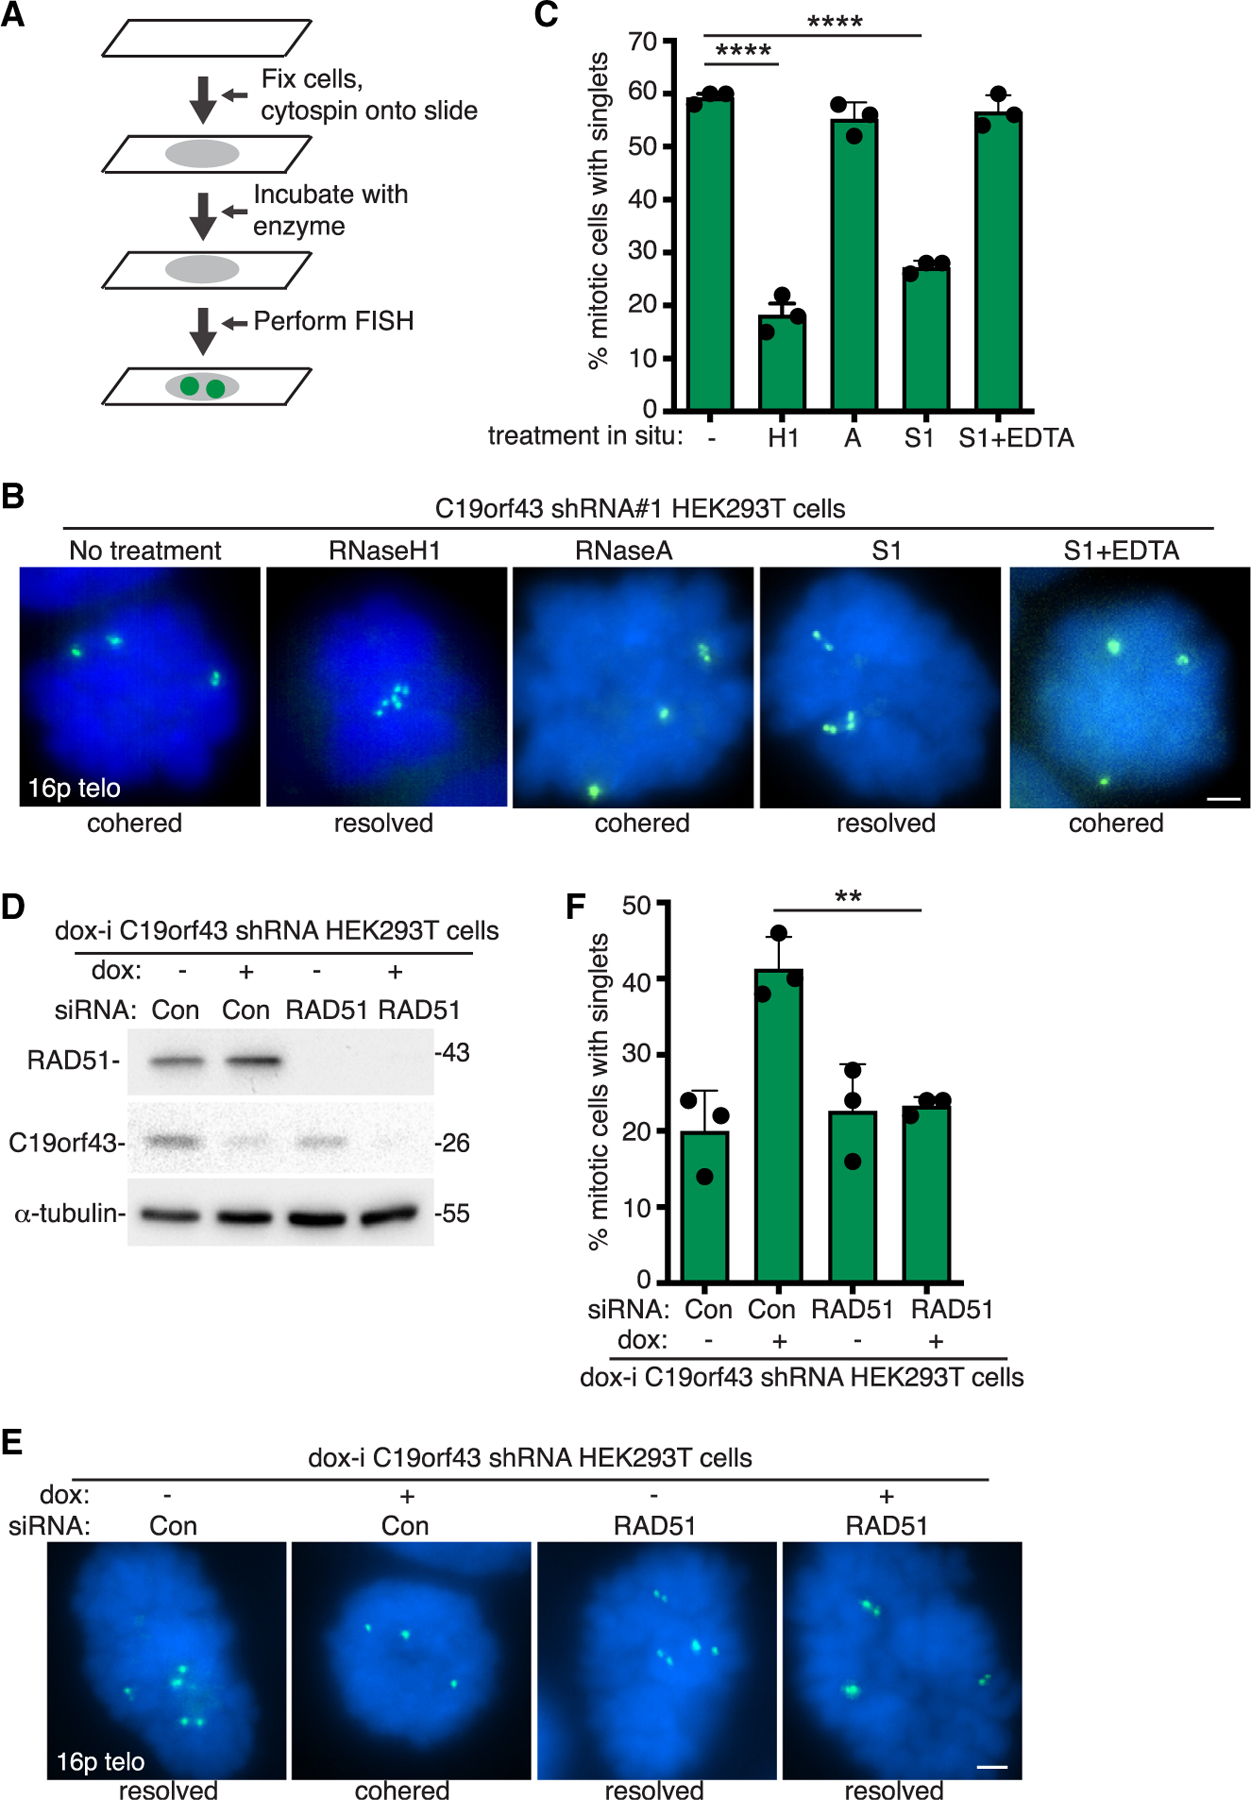
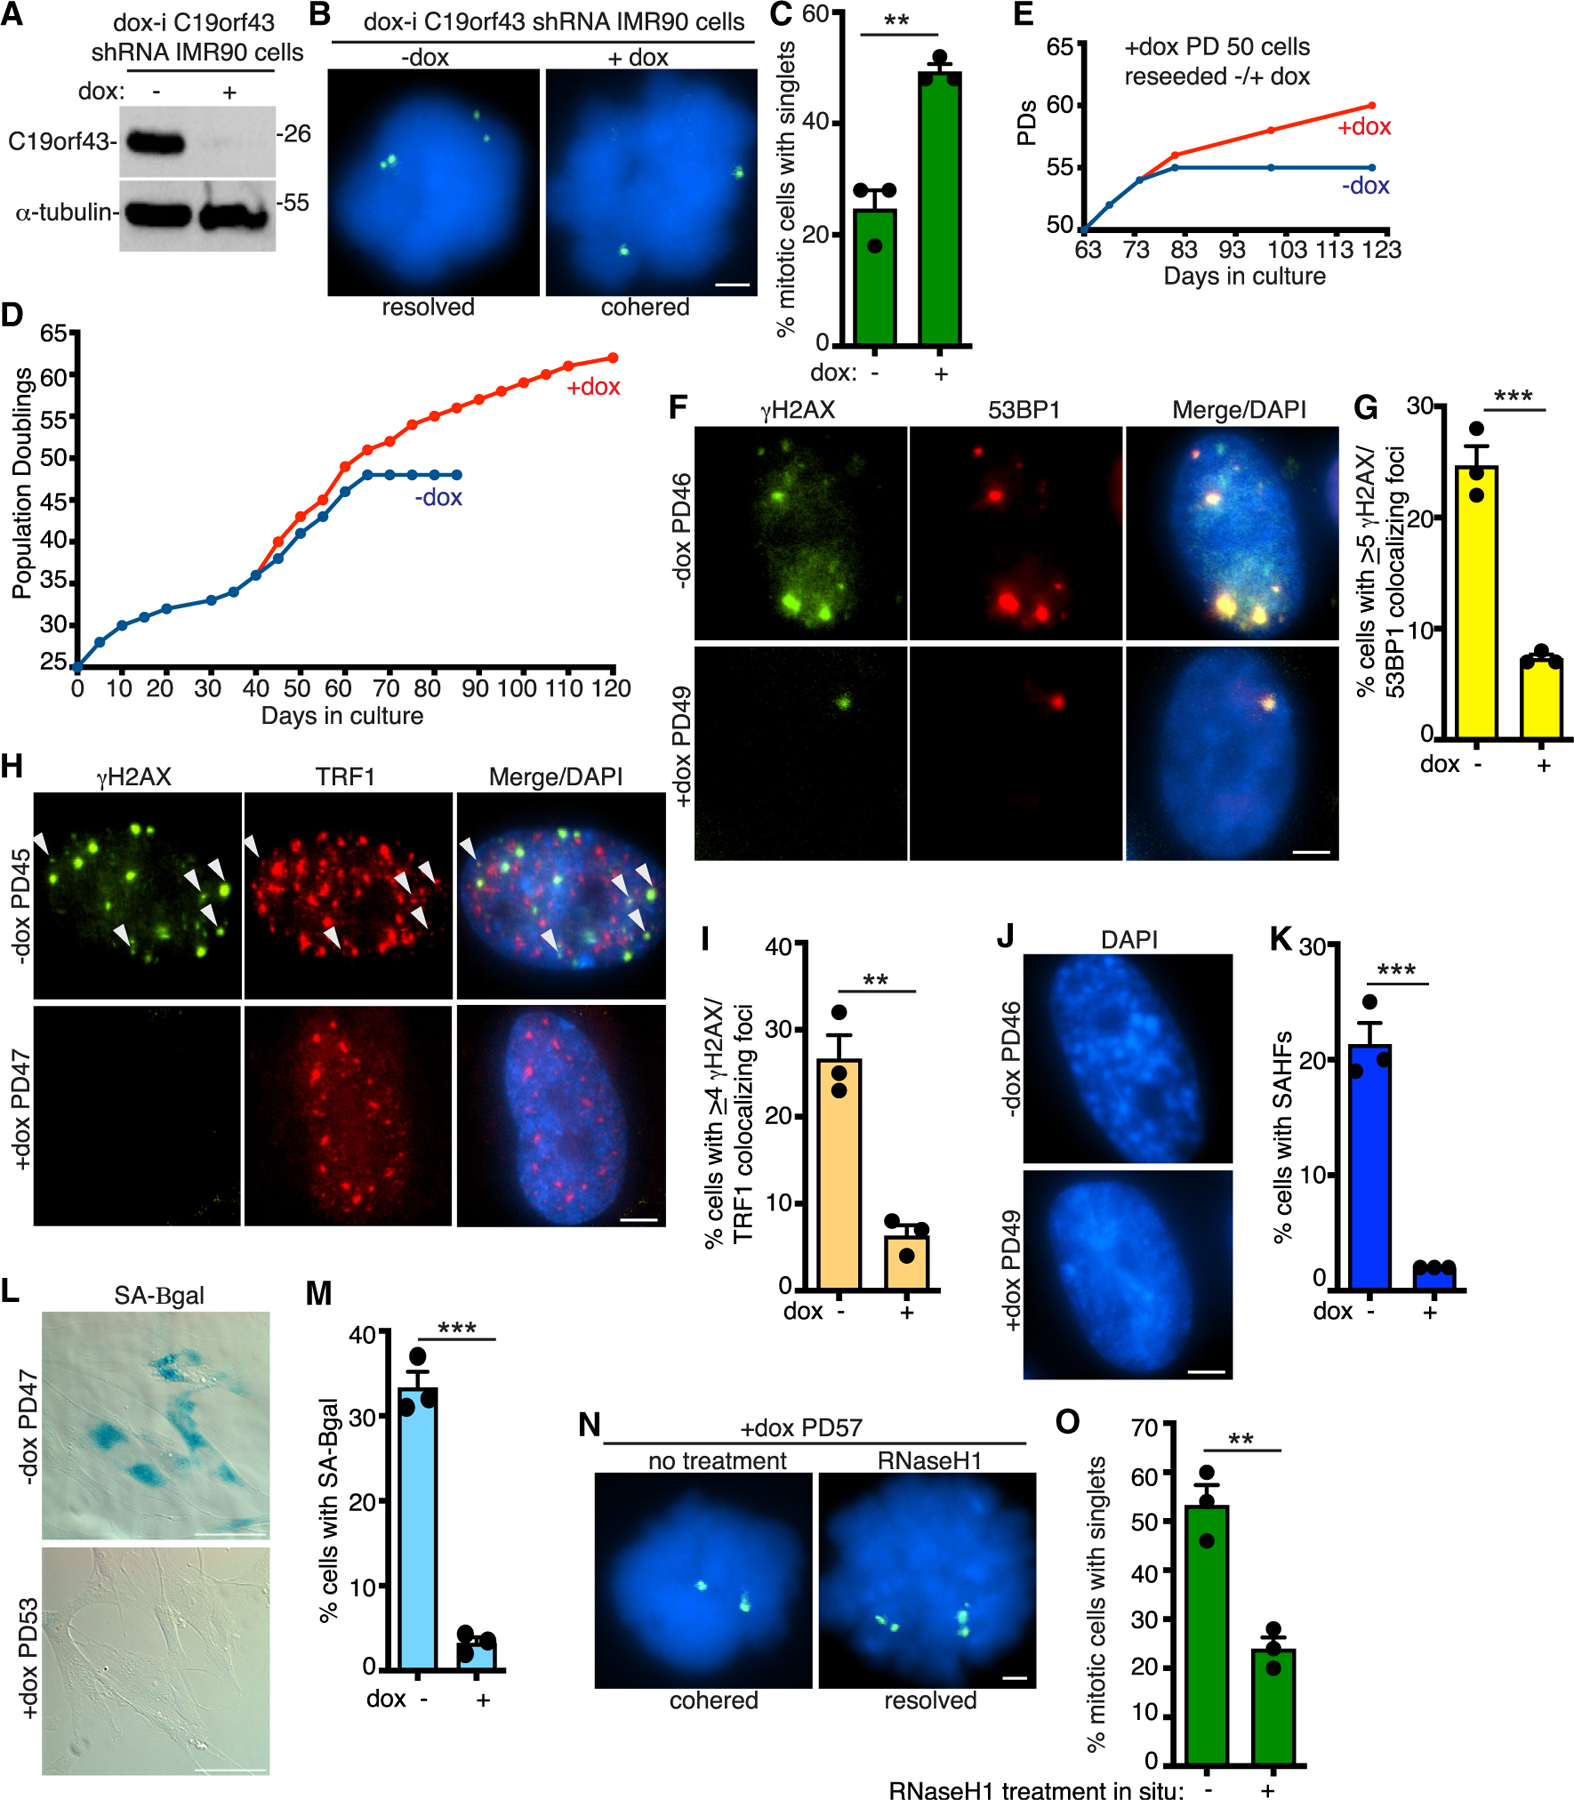
Resolution of cohesion between sister telomeres in human cells depends on TRF1-mediated recruitment of the polyADP-ribosyltransferase tankyrase to telomeres. In human aged cells, due to insufficient recruitment of TRF1/tankyrase to shortened telomeres, sisters remain cohered in mitosis. This persistent cohesion plays a protective role, but the mechanism by which sisters remain cohered is not well understood. Here we show that telomere repeat-containing RNA (TERRA) holds sister telomeres together through RNA-DNA hybrid (R-loop) structures. We show that a tankyrase-interacting partner, the RNA-binding protein C19orf43, is required for repression of TERRA R-loops. Persistent telomere cohesion in C19orf43-depleted cells is counteracted by RNaseH1, confirming that RNA-DNA hybrids hold sisters together. Consistent with a protective role for persistent telomere cohesion, depletion of C19orf43 in aged cells reduces DNA damage and delays replicative senescence. We propose that the inherent inability of shortened telomeres to recruit R-loop-repressing machinery permits a controlled onset of senescence.

Keywords: C19orf43; CP: Molecular biology; R-Loops; RNA-DNA hybrids; RNaseH; TERRA; TRF1; cohesion; senescence; tankyrase; telomeres.


Conflict of interest statement

Declaration of interests There are no competing interests.

Figures

Figure 1.
Figure 1.. C19orf43 is a tankyrase-binding protein that is required for resolution of telomere cohesion
(A) Schematic of C19orf43 with tankyrase-binding motifs (TBMs) indicated. (B) Immunoblot analysis of HEK293T cell extracts immunoprecipitated (IP) with control or anti-TNKS antibody. (C) Immunoblot analysis of cell extracts from HEK293T cells stably expressing control or C19orf43 shRNAs #1 or #4. (D) Immunoblot analysis of cell extracts from C19orf43 shRNA #1 HEK293T cells transfected with vector or C19orf43 WT, R7G, or R106G and immunoprecipitated with anti-FLAG antibody (FLAG IP). (E) FISH analysis of HEK293T control or C19orf43 shRNA (#1 or #4) mitotic cells using a 16p subtelo probe (green). (F) Quantification of the frequency of mitotic cells with cohered telomeres. Three independent experiments (n = 37–69 cells each) ± SEM. *p ≤ 0.05, Student’s unpaired t test. (G) FISH analysis of HEK293T control or C19orf43 shRNA (#1 or #4) mitotic cells with a dual 13q subtelo (green)/arm (red) probe. (H) Quantification of the frequency of mitotic cells with cohered telomeres and arms. Three independent experiments (n = 26–29 cells each) ± SEM. *p ≤ 0.05, **p≤ 0.01, Student’s unpaired t test; ns, not significant. (I) Immunoblot analysis of cell extracts from CRISPR-Cas9-generated HEK293T knockout (KO) cell lines #2 and #4. (J) Immunoblot analysis of cell extracts from CRISPR-Cas9-generated HEK293T mutant G12A cell line. (K) FISH analysis of WT, KO#4, or G12A HEK293T mitotic cells using a 16p subtelo probe (green). (L) Quantification of the frequency of mitotic cells with cohered telomeres. Three independent experiments (n = 44–56 cells each) ± SEM. *p ≤ 0.05, ***p ≤ 0.001, Student’s unpaired t test. (E, G, K) DNA was stained with DAPI (blue). Scale bars represent 2 μm.
Figure 2.
Figure 2.. C19orf43 (wild type, but not mutant) counteracts persistent telomere cohesion in C19orf43-depleted and aged cells
(A) Immunoblot analysis of cell extracts from C19orf43 shRNA#1 HEK293T cells transfected with vector or C19orf43 (WT, R7G, or R106G). (B) FISH analysis of vector or C19orf43 (WT, R7G, or R106G) transfected C19orf43 shRNA#1 HEK293T mitotic cells with a 16p subtelo probe (green). (C) Quantification of the frequency of mitotic cells with cohered telomeres. Three to four independent experiments (n = 27–68 cells each) ± SEM. ***p ≤ 0.001, Student’s unpaired t test. (D) Immunoblot analysis of cell extracts from C19orf43 KO#4 cells transfected with a vector control or C19orf43 WT. (E) FISH analysis of vector or C19orf43 WT transfected C19orf43 KO#4 cells using a 16p subtelo probe (green). (F) Quantification of FISH analysis showing the frequency of mitotic cells with cohered telomeres. Three independent experiments (n = 50–56 cells each) ± SEM. **p ≤ 0.01, Student’s unpaired t test. (G) Immunoblot analysis of cell extracts from vector or C19orf43 (WT or R7G) transfected aged WI38 cells. (H) FISH analysis of vector or C19orf43 (WT or R7G) transfected aged WI38 mitotic cells using a 16p subtelo probe (green). (I) Quantification of the frequency of mitotic cells with cohered telomeres. Three independent experiments (n = 36–50 cells each) ± SEM. **p ≤ 0.01, Student’s unpaired t test. (B, E, H) DNA was stained with DAPI (blue). Scale bars represent 2 μm.
Figure 3.
Figure 3.. C19orf43 depletion leads to a decrease in TERRA and an increase in TERRA R-loops
(A) RNA dot blot analysis of TERRA or 18S rRNA levels in control or C19orf43 KO#2 and #4 HEK293T cell lines. Samples were treated (−) or (+) RNaseA as a control. Blots were probed with a Telo C TERRA or 18S rRNA probe. (B) Quantification of TERRA levels normalized to 18S rRNA levels plotted as fold change over control cells. Three independent experiments ± SEM. *p ≤ 0.05, ****p ≤ 0.0001, Student’s unpaired t test. (C) Northern blot analysis of TERRA levels in control or C19orf43 shRNA #1 and #4 HEK293T cell lines. Blots were probed with a Telo C TERRA probe. (D) Quantification of TERRA levels normalized to 18S rRNA levels plotted as fold change over control cells. Three independent experiments ± SEM. ***p ≤ 0.001, Student’s unpaired t test. ns, not significant. (E) qRT-PCR analysis of RNA samples from control or C19orf43 shRNA #1 and #4 HEK293T cell lines. TERRA levels from individual sub-telomeres (2p, 9p, 16p, 18p) and all telomeres (Telo) were measured from total RNA, normalized to GAPDH, and plotted as fold change over control cells. The bars represent the average value from three to five independent experiments ± SEM. **p ≤ 0.01, ***p ≤ 0.001, ****p ≤ 0.0001, Student’s unpaired t test. ns, not significant. (F) Immunoblot analysis of cell extracts from HEK293T cells transfected with vector or C19orf43 and immunoprecipitated with anti-FLAG antibody (FLAG IP). (G) RNA immunoprecipitation (RIP) analysis using anti-FLAG antibody in extracts from vector or C19orf43 transfected HEK293T cells. Input and immunoprecipitated samples were analyzed by qRT-PCR using GAPDH and Telo primers and plotted as percent input. Three independent experiments ± SEM. **p ≤ 0.01, Student’s unpaired t test. ns, not significant. (H) Immunoblot analysis of dox-inducible (dox-i) C19orf43 shRNA HEK293T cells following 48 h of treatment (−) or (+) dox. (I) DNA:RNA immunoprecipitation (DRIP) analysis using S9.6 antibody in extracts from −dox and +dox dox-i C19orf43 HEK293T shRNA cells. In vitro digestion with RNaseH1 prior to immunoprecipitation served as a negative control for the specificity of S9.6 antibody. Immunoprecipitates and input samples were analyzed by qPCR with primer sets amplifying 2p, 9p, 18p subtelomeric DNA or telomeric DNA and plotted as percent input. Four independent experiments ± SEM. *p ≤ 0.05, ***p ≤ 0.001, Student’s unpaired t test. ns, not significant. See also Figure S3 and Table S1.
Figure 4.
Figure 4.. RNaseH1 counteracts persistent telomere cohesion
(A) Immunoblot analysis of vector, RNaseH1.WT, or RNaseH1.CD transfected C19orf43 shRNA#1 HEK293T cell extracts. (B) FISH analysis of vector, RNaseH1.WT, or RNaseH1.CD transfected C19orf43 shRNA#1 HEK293T mitotic cells using a 16p subtelo probe (green). (C) Quantification of the frequency of mitotic cells with cohered telomeres. Three independent experiments (n = 50 cells each) ± SEM. ****p ≤ 0.0001, Student’s unpaired t test. (D) Immunoblot analysis of vector, RNaseH1.WT, or RNaseH1.CD transfected HEK293T TNKS1/2 DKO cell extracts. (E) FISH analysis of vector, RNaseH1.WT, or RNaseH1.CD transfected HEK293T TNKS1/2 DKO mitotic cells using a 16p subtelo probe (green). (F) Quantification of the frequency of mitotic cells with cohered telomeres. Three independent experiments (n = 50 cells each) ± SEM. ****p ≤ 0.0001, Student’s unpaired t test. (G) Immunoblot analysis of vector, RNaseH1.WT, or RNaseH1.CD transfected aged IMR90 cell extracts. (H) FISH analysis of vector, RNaseH1.WT, or RNaseH1.CD transfected aged IMR90 mitotic cells using a 16p subtelo probe (green). (I) Quantification of the frequency of mitotic cells with cohered telomeres. Three independent experiments (n = 50 cells each) ± SEM. **p ≤ 0.01, Student’s unpaired t test. (J) Immunoblot analysis of control, RNaseH1#1, or RNaseH1#2 siRNA transfected HEK293T cell extracts. (K) FISH analysis of control, RNaseH1#1, or RNaseH1#2 siRNA transfected HEK293T mitotic cells using a 16p subtelo probe (green). (L) Quantification of the frequency of mitotic cells with cohered telomeres. Three independent experiments (n = 49–87 cells each) ± SEM. **p ≤ 0.01, Student’s unpaired t test. ns, not significant. (M) Immunoblot analysis of control or RNaseH2A siRNA transfected HEK293T cell extracts. (N) FISH analysis of control or RNaseH2A siRNA transfected HEK293T mitotic cells using a 16p subtelo probe (green). (O) Quantification of the frequency of mitotic cells with cohered telomeres. Three independent experiments (n = 41–50 cells each) ± SEM. **p ≤ 0.01, Student’s unpaired t test. (B, E, H, K, N) DNA was stained with DAPI (blue). Scale bars represent 2 μm.
Figure 5.
Figure 5.. RNaseH1 or nuclease S1 resolves cohered sister telomeres in situ, and RAD51 is required for induction of persistent cohesion in cells
(A) Schematic of experimental approach for enzyme incubations in situ prior to FISH analysis. (B) FISH analysis of C19orf43 shRNA#1 HEK293T mitotic cells following incubation in situ with no treatment, RNaseH1, RNaseA, nuclease S1, or S1 plus EDTA inhibitor, using a 16p subtelo probe (green). (C) Quantification of the frequency of mitotic cells with cohered telomeres. Three independent experiments (n = 50 cells each) ± SEM. ****p ≤ 0.0001, Student’s unpaired t test. (D) Immunoblot analysis of dox-i C19orf43 shRNA HEK293T cells following 64 h of treatment with control or RAD51 siRNA. Cells were treated with dox for 48 h prior to harvest. (E) FISH analysis of mitotic dox-i C19orf43 shRNA HEK293T cells following treatment with control or RAD51 siRNA and − or + dox using a 16p subtelo probe (green). (F) Quantification of the frequency of mitotic cells with cohered telomeres. Three independent experiments (n = 50 cells each) ± SEM. **p ≤ 0.01, Student’s unpaired t test. (B, E) DNA was stained with DAPI (blue). Scale bars represent 2 μm.
Figure 6.
Figure 6.. C19orf43 depletion delays replicative senescence
(A) Immunoblot analysis of dox-i C19orf43 shRNA IMR90 cells (−dox PD43) following 48 h (−) or (+) dox. (B) FISH analysis of mitotic dox-i C19orf43 shRNA IMR90 cells (−dox PD39) following 48 h (−) or (+) dox using a 16p subtelo probe (green). (C) Quantification of the frequency of mitotic cells with cohered telomeres. Three independent experiments (n = 50 cells each) ± SEM. **p ≤ 0.01, Student’s unpaired t test. (D) Growth curve analysis of dox-i C19orf43 shRNA IMR90 (PD25) cells generated by lentiviral infection and passaged (−) or (+) dox for 120 days. (E) Growth curve analysis of dox-i C19orf43 shRNA IMR90 (+dox PD50) cells reseeded (−) or (+) dox and passaged for an additional 60 days. (F) Immunofluorescence analysis of dox-i C19orf43 shRNA IMR90 −dox PD46 or +dox PD49 cells stained with γH2AX (green) and 53BP1 (red) antibodies. (G) Quantification of the frequency of cells displaying ≥5 γH2AX/53BP1 colocalizing foci from −dox PD43/45/46 or +dox PD45/47/49 cells. Three independent experiments (n = 105–124 cells each) ± SEM. ***p ≤ 0.001, Student’s unpaired t test. (H) Immunofluorescence analysis of dox-i C19orf43 shRNA IMR90 −dox PD45 or +dox PD47 cells stained with γH2AX (green) and TRF1 (red) antibodies. Arrowheads indicate colocalizing foci. (I) Quantification of the frequency of cells displaying ≥4 γH2AX/TRF1 colocalizing foci from −dox PD45 or +dox PD47 cells. Three independent experiments (n = 94–134 cells each) ± SEM. **p ≤ 0.01, Student’s unpaired t test. (J) Detection of senescence-associated heterochromatin foci (SAHF) in DAPI-stained dox-i C19orf43 shRNA IMR90 −dox PD46 or +dox PD49 cells. (K) Quantification of SAHF-positive DAPI-stained dox-i C19orf43 shRNA IMR90 −dox PD43/46 or +dox PD45/49 cells. Three independent experiments (n = 104–215 cells each) ± SEM. ***p ≤ 0.001, Student’s unpaired t test. (L) SA-β-gal analysis of dox-i C19orf43 shRNA IMR90 −dox PD47 or +dox PD53 cells. Scale bars represent 100 μm. (M) Quantification of SA-β-gal-positive cells. Three independent experiments (n = 173–207 cells each) ± SEM. ***p ≤ 0.001, Student’s unpaired t test. (N) FISH analysis using a 16p subtelo probe (green) of mitotic dox-i C19orf43 shRNA IMR90 +dox (PD57) cells following no treatment or RNaseH1 treatment in situ. (O) Quantification of the frequency of mitotic cells with cohered telomeres. Three independent experiments (n = 50 cells each) ± SEM. **p ≤ 0.01, Student’s unpaired t test. (B, F, H, J, N) DNA was stained with DAPI (blue). Scale bars represent 2 μm. See also Figure S6.

Similar articles

Cited by

References

    1. de Lange T (2005). Shelterin: the protein complex that shapes and sfeguards human telomeres. Genes Dev 19, 2100–2110. - PubMed
    1. Azarm K, and Smith S (2020). Nuclear PARPs and genome integrity. Genes Dev 34, 285–301. 10.1101/gad.334730.119. - DOI - PMC - PubMed
    1. de Lange T (2018). Shelterin-Mediated Telomere Protection. Annu. Rev. Genet 52, 223–247. 10.1146/annurev-genet-032918-021921. - DOI - PubMed
    1. Lim CJ, and Cech TR (2021). Shaping human telomeres: from shelterin and CST complexes to telomeric chromatin organization. Nat. Rev. Mol. Cell Biol 22, 283–298. 10.1038/s41580-021-00328-y. - DOI - PMC - PubMed
    1. Eisemann T, McCauley M, Langelier MF, Gupta K, Roy S, Van Duyne GD, and Pascal JM (2016). Tankyrase-1 Ankyrin Repeats Form an Adaptable Binding Platform for Targets of ADP-Ribose Modification. Structure 24, 1679–1692. 10.1016/j.str.2016.07.014. - DOI - PubMed

Publication types

LinkOut - more resources