. 2023 Oct 16;19(10):e1010979.
doi: 10.1371/journal.pgen.1010979. eCollection 2023 Oct.

A Rab6 to Rab11 transition is required for dense-core granule and exosome biogenesis in Drosophila secondary cells

Affiliations

A Rab6 to Rab11 transition is required for dense-core granule and exosome biogenesis in Drosophila secondary cells

Adam Wells et al. PLoS Genet. .

Abstract

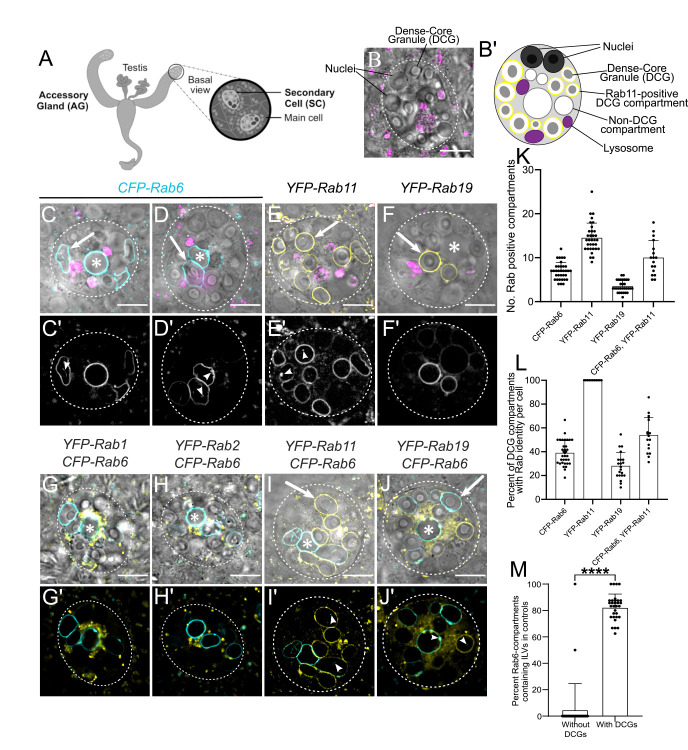
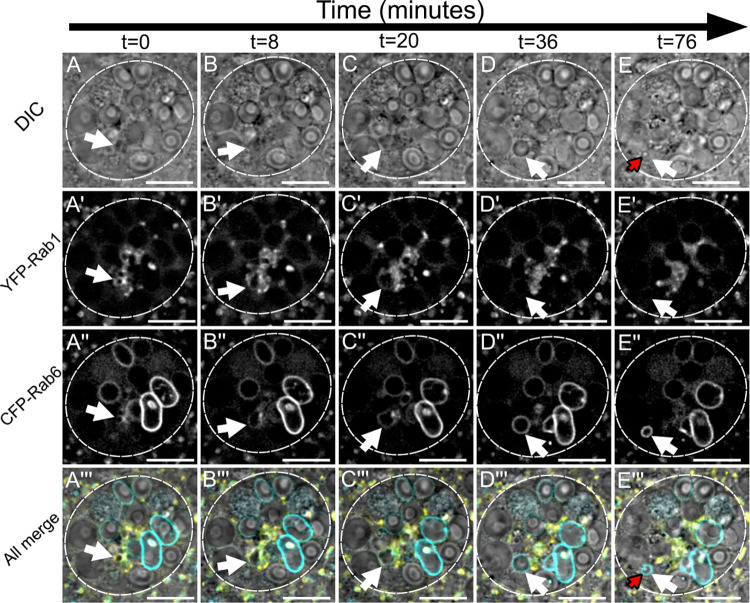
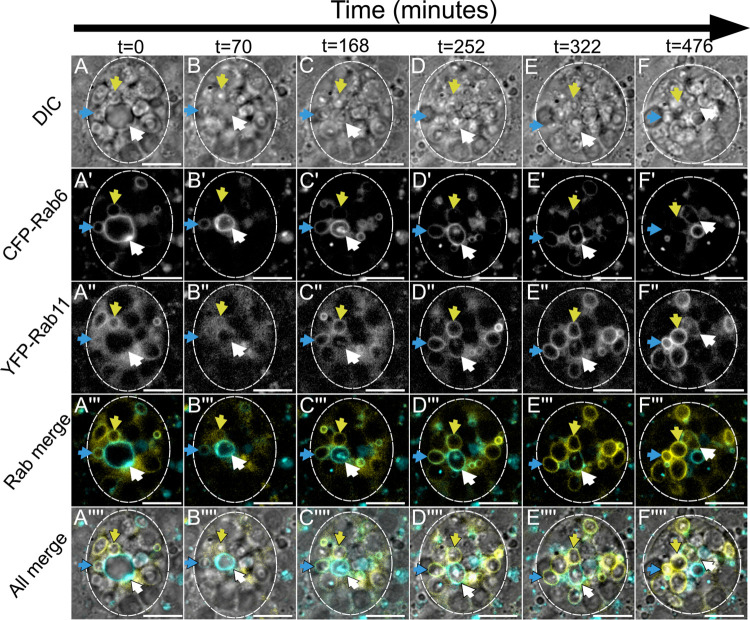
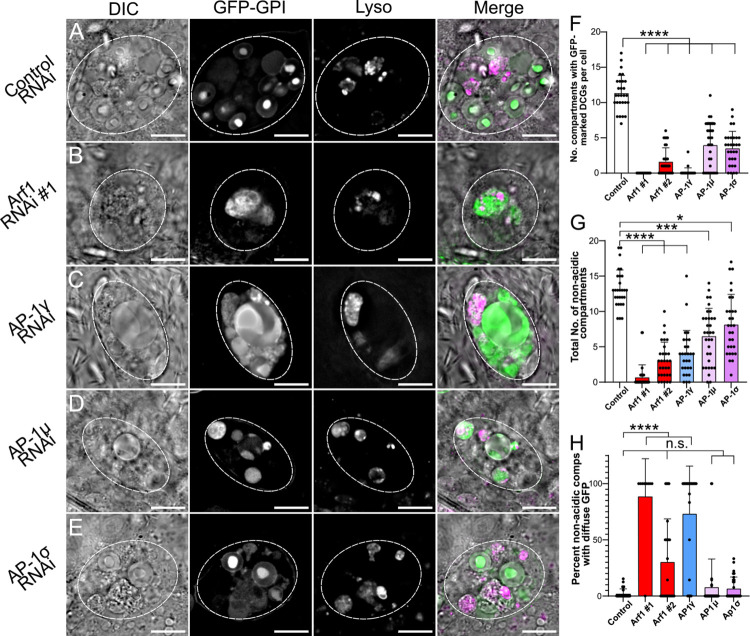
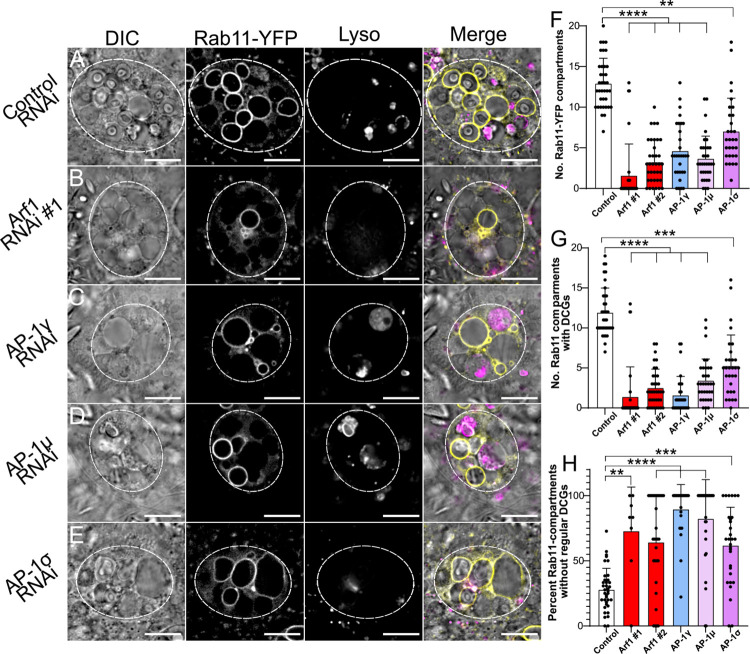
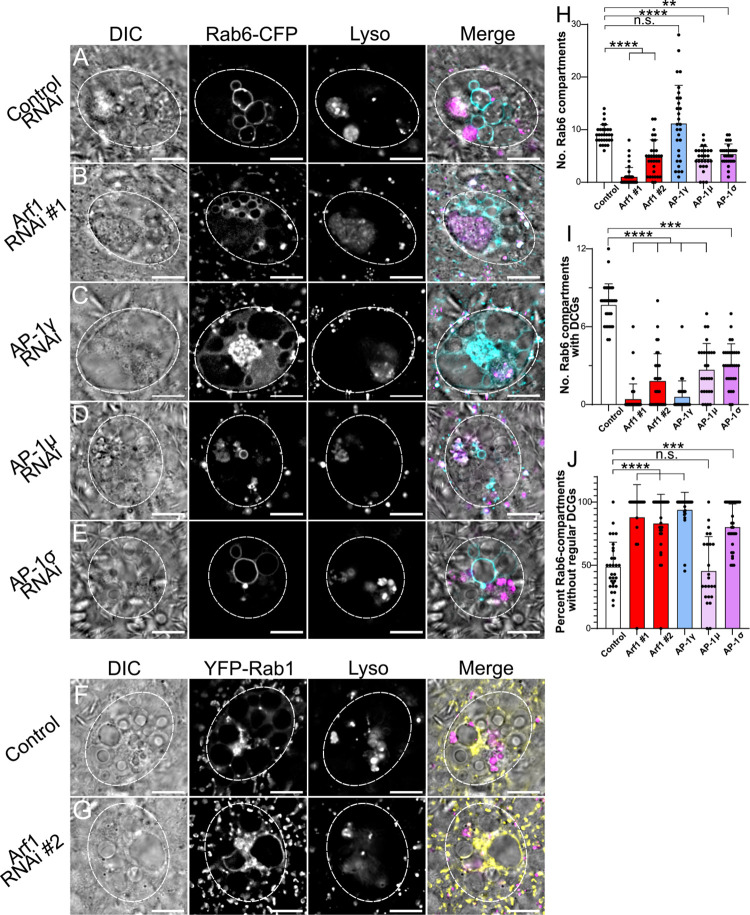
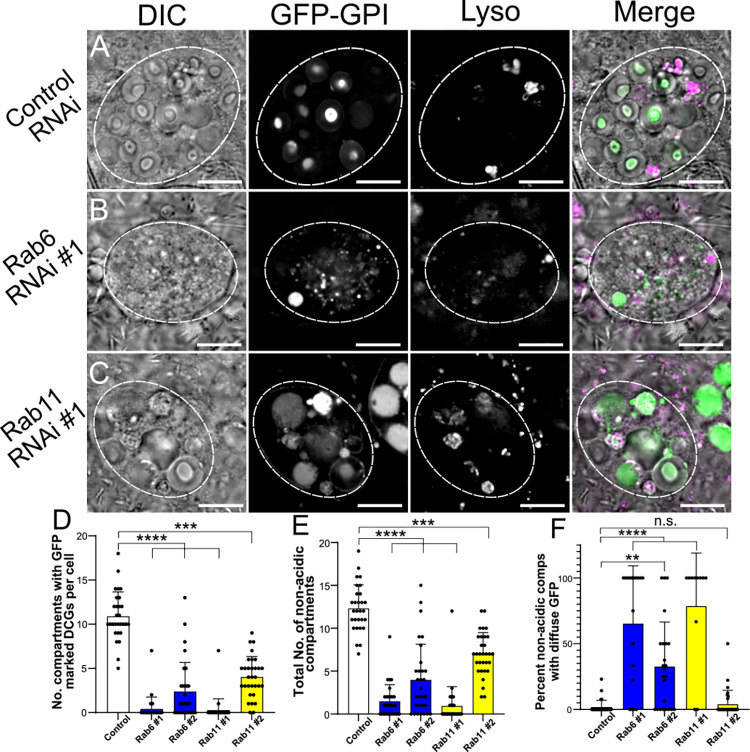
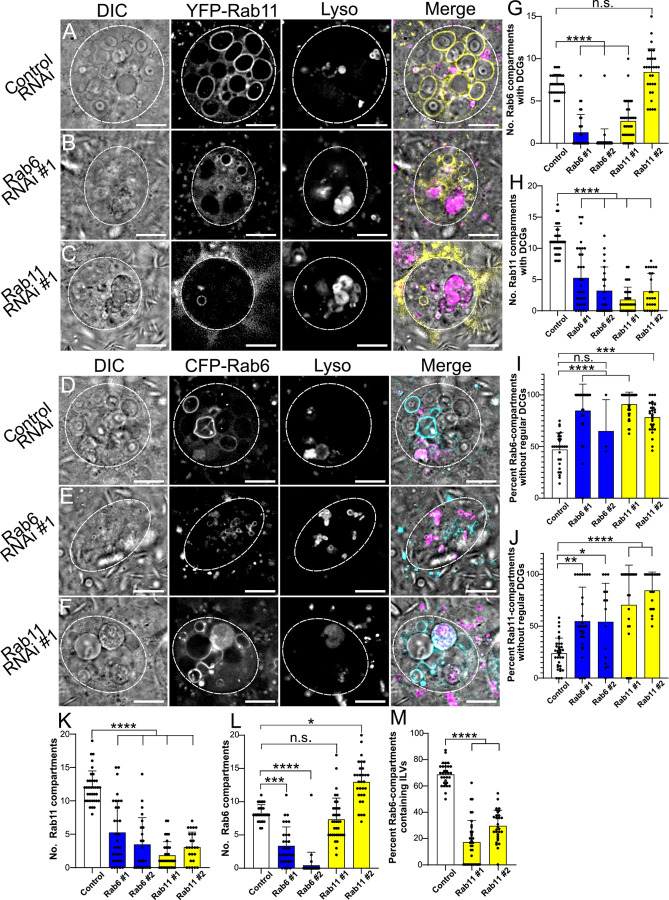
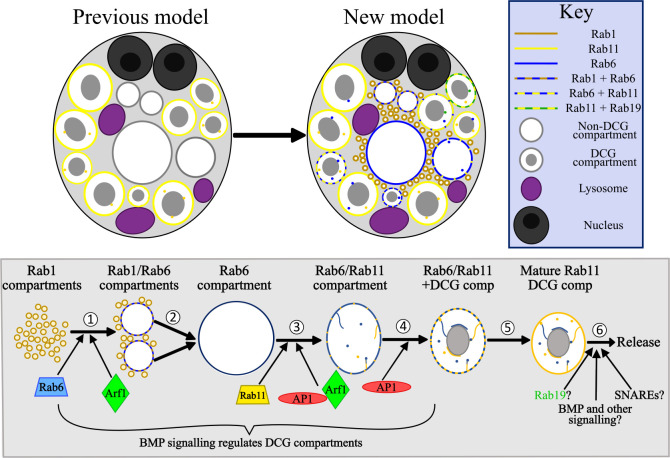
Secretory cells in glands and the nervous system frequently package and store proteins destined for regulated secretion in dense-core granules (DCGs), which disperse when released from the cell surface. Despite the relevance of this dynamic process to diseases such as diabetes and human neurodegenerative disorders, our mechanistic understanding is relatively limited, because of the lack of good cell models to follow the nanoscale events involved. Here, we employ the prostate-like secondary cells (SCs) of the Drosophila male accessory gland to dissect the cell biology and genetics of DCG biogenesis. These cells contain unusually enlarged DCGs, which are assembled in compartments that also form secreted nanovesicles called exosomes. We demonstrate that known conserved regulators of DCG biogenesis, including the small G-protein Arf1 and the coatomer complex AP-1, play key roles in making SC DCGs. Using real-time imaging, we find that the aggregation events driving DCG biogenesis are accompanied by a change in the membrane-associated small Rab GTPases which are major regulators of membrane and protein trafficking in the secretory and endosomal systems. Indeed, a transition from trans-Golgi Rab6 to recycling endosomal protein Rab11, which requires conserved DCG regulators like AP-1, is essential for DCG and exosome biogenesis. Our data allow us to develop a model for DCG biogenesis that brings together several previously disparate observations concerning this process and highlights the importance of communication between the secretory and endosomal systems in controlling regulated secretion.


Conflict of interest statement

The authors have declared that no competing interests exist.

Figures

Fig 1
Fig 1. Morphology and Rab identity of DCG compartments in Drosophila secondary cells.
(A) Schematic of Drosophila accessory gland (AG), showing secondary cells (SCs) at the distal tip of each lobe. (B) Ex vivo Differential Interference Contrast (DIC) image of an SC from the AG of a six-day-old w1118 virgin male fly, stained with LysoTracker Red. (B’) Schematic of SC, with equivalent structures labelled. (C-J) DIC images of SCs, overlaid with LysoTracker Red (C-F), and fluorescent signal from different endogenously tagged Rab genes (C-J). DIC images: grayscale, YFP: yellow, CFP: cyan, LysoTracker Red: magenta. (C’-J’) Fluorescence-only images showing expression of each Rab. Arrowheads indicate ILVs labelled by various Rabs, which lie inside compartments. (C, D) CFP-Rab6-labelled compartments have a range of morphologies including spherical non-DCG compartments (C, *), irregularly shaped, non-DCG compartments (D, *), and DCG-containing compartments (arrows). (E) YFP-Rab11 marks all DCG compartments. (F) YFP-Rab19 marks two or three DCG compartments. (G, H and G’, H’) Small YFP-Rab1- (G) and YFP-Rab2-positive (H) clustered compartments surround central non-DCG-containing, CFP-Rab6 compartments. (I) Some YFP-Rab11-positive DCG compartments are labelled with CFP-Rab6. CFP-Rab6 puncta are also observed inside some compartments that are not Rab6-positive (arrow) and in a compartment that is Rab6- and Rab11-positive, but lacks a DCG (I, *). (J) YFP-Rab19 compartments are not co-labelled with CFP-Rab6. However, YFP-Rab19 and CFP-Rab6 do co-label microdomains and internal membranes on Rab6-marked compartments, eg. arrowhead in centre (J’), while Rab6-positive internal puncta are also found inside Rab19-positive compartments (arrowhead on right). (K) Bar chart showing number of large compartments (> 1 μm diameter at its widest point) positive for different fluorescent Rabs in individual SCs. (L) Bar chart showing % of DCG compartments labelled with specific fluorescent Rabs in individual SCs. (M) Bar chart showing the proportion of CFP-Rab6-positive DCG compartments and coreless CFP-Rab6 compartments containing Rab6-positive ILVs in individual SCs expressing a control rosy-RNAi. Data for bar charts were collected from three SCs per gland derived from 10 glands, except for the genotype expressing CFP-Rab6 and YFP-Rab11, where the relative expression levels of both fusion proteins varied considerably between different cells, so only some cells were suitable for analysis. Approximate outlines of SCs are marked by dashed circles. Scale bars: 10 μm. * marks representative non-acidic compartments that lack a DCG. Arrows mark representative DCG compartments labelled by various Rabs. For K-M, bars show mean ± SD; CFP-Rab6, n = 34; YFP-Rab11, n = 33; YFP-Rab19, n = 30; CFP-Rab6/YFP-Rab11, n = 17; for M, n = 31; P<0.0001: ****. Genotypes for images: (C-D) w1118; TI{TI}Rab6EYFP/+; (E) w1118; TI{TI}Rab11EYFP/+; (F) w1118; TI{TI}Rab19EYFP/+; (G) w1118; TI{TI}Rab6EYFP/+; w1118; TI{TI}Rab1EYFP/+; (H) w1118; TI{TI}Rab6EYFP/TI{TI}Rab2EYFP; (I) w1118; TI{TI}Rab6EYFP/+; TI{TI}Rab11EYFP/+; and (J) w1118; TI{TI}Rab6EYFP/+; TI{TI}Rab19EYFP/+.
Fig 2
Fig 2. A Rab1 to Rab6 transition accompanies the maturation of secretory compartments at the trans-Golgi network of Drosophila SCs (related to S1 Movie).
Panels show ex vivo images of a single SC taken at five discrete timepoints with time since start of imaging shown above in minutes. Rows within panel display cellular organisation at each timepoint through DIC imaging (A-E), fluorescent YFP-Rab1 signal (A’-E’), fluorescent CFP-Rab6 signal (A”-E”), and combined images displaying all three (A”‘-E”‘). White arrows indicate the position of a secretory compartment as it matures through a Rab1 to Rab6 transition across time and red arrows indicate the position of a newly formed DCG inside that compartment. (A-C) A small, central compartment (white arrow; <1μm diameter) that is primarily labelled with YFP-Rab1 grows rapidly in size, losing most of the YFP-Rab1 signal from its surface and accumulating more CFP-Rab6. (D) The compartment loses all detectable YFP-Rab1 signal from its surface, obtains its greatest diameter, becomes perfectly spherical and starts to migrate peripherally. (E) The compartment retains its CFP-Rab6 identity but begins to contract again in diameter, as a DCG rapidly appears inside it (red arrow). The time interval between the formation of a large Rab6-positive compartment and DCG biogenesis varies between compartments, with this example being particularly rapid. Approximate outline of SC is marked by dashed circles. Scale bars: 10 μm. This Rab transition was observed four times with different accessory glands. Genotype for images: w1118; TI{TI}Rab6CFP/+; TI{TI}Rab1EYFP/+.
Fig 3
Fig 3. Rab6 to Rab11 transition on surface of maturing secretory compartments in Drosophila secondary cells coincides with exosome and DCG biogenesis (related to S3 Movie).
Panel shows ex vivo images of a single SC taken at six discrete timepoints with time since start of imaging shown above in minutes. Rows within panel display cellular organisation at each timepoint through DIC imaging (A-F), fluorescent CFP-Rab6 signal (A’-F’), fluorescent YFP-Rab11 signal (A”-F”), a combined fluorescence image (A”‘-F”‘) and a combined DIC and fluorescence image (A”“-F”“). Three coloured arrows (blue, yellow and white) each indicate the position of one maturing secretory compartment across time. (A-A”“) The compartments marked by either a blue or yellow arrow begin with CFP-Rab6 and YFP-Rab11 co-labelling and have DCGs already present. The compartment marked by the white arrow is significantly larger, is labelled strongly with CFP-Rab6, but has no YFP-Rab11 on its surface and no DCG. (B-B”“, C-C”“) The blue and yellow arrowed compartments lose CFP-Rab6 labelling over time and become more heavily marked by YFP-Rab11. The compartment marked with a white arrow significantly contracts in size and is only weakly labelled by CFP-Rab6 by the end of the time course. In contrast, YFP-Rab11 begins to accumulate on the compartment. Simultaneously, this compartment begins forming internal structures, with ILVs appearing first (B’) and then a DCG (C). ILVs are marked by both CFP-Rab6 and YFP-Rab11 and at least partly surround the DCG (C). (D-D”“, E-E”“, F-F”“). The two more mature highlighted compartments (marked with blue and yellow arrows) lose CFP-Rab6 identity and are strongly labelled by YFP-Rab11 by the end of the time course. The compartment labelled with a white arrow still retains some CFP-Rab6, but YFP-Rab11 continues to increase in levels. Approximate outline of SC is marked by dashed circles. Scale bars: 10 μm. This Rab transition and concurrent DCG formation was observed four times with different accessory glands. Genotype for images: w1118; TI{TI}Rab6CFP/+; TI{TI}Rab11EYFP/+.
Fig 4
Fig 4. The conserved trafficking regulators Arf1 and AP-1 are essential for DCG biogenesis in SCs.
(A-E) Representative images of SCs expressing the DCG marker GFP-GPI together with a control RNAi (A) or RNAis targeting Arf1 (RNAi #1; B), AP-1γ (C), AP-1μ (D) or AP-1σ (E). Cellular organisation was assessed using DIC imaging, GFP-GPI fluorescence and Lysotracker Red fluorescence; a merged image is also shown for each cell. Note that the knockdowns generally reduce the number of large non-acidic compartments and the number of DCG compartments, though some remaining compartments can be expanded in size. (F) Bar chart showing number of compartments containing GFP-labelled DCGs in control SCs and following knockdown of Arf1 and AP-1 subunits. (G) Bar chart showing number of non-acidic compartments in these different genotypes. (H) Bar chart showing the percentage of non-acidic compartments with diffuse GFP-GPI in these different genotypes. Approximate outlines of SCs are marked by dashed circles. Scale bars: 10 μm. Data are typically for three cells per accessory gland; accessory glands from ≥10 individual males were imaged during three to six separate imaging sessions, for this and subsequent knockdown experiments. For F-H, bars show mean ± SD; Control, n = 28; Arf1 #1, n = 31; Arf1 #2, n = 30; AP-1γ, n = 28; AP-1μ, n = 32; AP-1σ, n = 30. P<0.05: *, P<0.01: **, P<0.001: ***, P<0.0001: ****. Genotypes for images: (A) w1118; P{tub-GAL80ts}/P{ryTRiP.HMS02827}; dsx-GAL4, P{UAS-GFP.GPI}/+; (B) w1118; P{tub-GAL80ts}/+; dsx-GAL4, P{UAS-GFP.GPI}/P{Arf1GD12522}; (C) w1118; P{tub-GAL80ts}/+; dsx-GAL4, P{UAS-GFP.GPI}/P{AP-1γTRiP.JF02684}; (D) w1118; P{tub-GAL80ts}/+; dsx-GAL4, P{UAS-GFP.GPI}/P{AP-1μGD14206}; (E) w1118; P{tub-GAL80ts}/P{AP-1σKK108869}; dsx-GAL4, P{UAS-GFP.GPI}/+.
Fig 5
Fig 5. Arf1 and AP-1 regulate Rab11-compartment identity and subsequent DCG biogenesis.
(A-E) Representative images of SCs expressing the YFP-Rab11 fusion gene from the endogenous Rab locus together with a control RNAi (A) or RNAis targeting Arf1 (RNAi #1; B), AP-1γ (C), AP-1μ (D) or AP-1σ (E). Cellular organisation is assessed using DIC imaging, YFP-Rab11 fluorescence and Lysotracker Red fluorescence, and a merged image is provided for each cell. Note that in the knockdown cells, there are fewer Rab11-positive compartments and more of them either do not contain DCGs, or contain abnormally shaped or multiple DCGs, when compared to controls. (F) Bar chart showing number of YFP-Rab11-labelled compartments in control SCs and following knockdown of Arf1 and AP-1. (G) Bar chart showing the number of YFP-Rab11 compartments containing DCGs in these different genotypes. (H) Bar chart showing the percentage of YFP-Rab11 compartments which fail to produce regularly shaped DCGs in these different genotypes. Approximate outlines of SCs are marked by dashed circles. Scale bars: 10 μm. For F-H, bars show mean ± SD; Control, n = 35; Arf1 #1, n = 31; Arf1 #2, n = 36; AP-1γ, n = 30; AP-1μ, n = 34; AP-1σ, n = 30. P<0.05: *, P<0.01: **, P<0.001: ***, P<0.0001: ****. Genotypes for images: (A) w1118; P{tub-GAL80ts}/P{ryTRiP.HMS02827}; dsx-GAL4, TI{TI}Rab11EYFP/+; (B) w1118; P{tub-GAL80ts}/+; dsx-GAL4, TI{TI}Rab11EYFP/P{Arf1GD12522}; (C) w1118; P{tub-GAL80ts}/+; dsx-GAL4, TI{TI}Rab11EYFP/P{AP-1γTRiP.JF02684}; (D) w1118; P{tub-GAL80ts}/+; dsx-GAL4, TI{TI}Rab11EYFP/P{AP-1μGD14206}; (E) w1118; P{tub-GAL80ts}/P{AP-1σKK108869}; dsx-GAL4, TI{TI}Rab11EYFP/+.
Fig 6
Fig 6. Arf1 and AP-1 regulate Rab6-compartment identity and the maturation of DCG compartments.
(A-E) Representative images of SCs expressing the CFP-Rab6 fusion gene from the endogenous Rab locus together with a control RNAi (A) or RNAis targeting Arf1 (RNAi #1; B), AP-1γ (C), AP-1μ (D) or AP-1σ (E). Cellular organisation is assessed through DIC imaging, CFP-Rab6 fluorescence and Lysotracker Red fluorescence, and a merged image is presented for each cell. Note the number of CFP-Rab6-positive compartments is reduced in all knockdown backgrounds, except AP-1γ, where a central cluster of small Rab6-positive compartments is often also observed, and in all knockdowns, few labelled compartments contain DCGs. (F, G) Representative SCs expressing the YFP-Rab1 fusion gene either alone (F) or together with an Arf1 RNAi #2 (G). Note that in control YFP-Rab1 SCs, no large non-acidic compartments are Rab1-positive. When SCs are subjected to Arf1 knockdown, by contrast, YFP-Rab1 does mark several large non-acidic compartments which do not contain DCGs. (H) Bar chart showing number of CFP-Rab6-labelled compartments in control SCs and following knockdown of Arf1 and AP-1. (I) Bar chart showing number of CFP-Rab6-compartments containing DCGs in these different genotypes. (J) Bar chart showing the percentage of CFP-Rab6-compartments, which fail to produce regularly shaped DCGs in these different genotypes. Approximate outlines of SCs are marked by dashed circles. Scale bars: 10 μm. For H-J, bars show mean ± SD; Control, n = 30; Arf1 #1, n = 39; Arf1 #2, n = 32; AP-1γ, n = 29; AP-1μ, n = 27; AP-1σ, n = 30. P<0.05: *, P<0.01: **, P<0.001: ***, P<0.0001: ****. Genotypes for images: (A) w1118; P{tub-GAL80ts}, TI{TI}Rab6CFP/P{ryTRiP.HMS02827}; dsx-GAL4/+; (B) w1118; P{tub-GAL80ts}, TI{TI}Rab6CFP/+; dsx-GAL4/P{Arf1GD12522}; (C) w1118; P{tub-GAL80ts}, TI{TI}Rab6CFP/+; dsx-GAL4/P{AP-1γTRiP.JF02684}; (D) w1118; P{tub-GAL80ts}, TI{TI}Rab6CFP/+; dsx-GAL4/P{AP-1μGD14206}; (E) w1118; P{tub-GAL80ts}, TI{TI}Rab6CFP/P{AP-1σKK108869}; dsx-GAL4/+; (F) w1118; +; TI{TI}Rab1CFP/+; (G) w1118; P{tub-GAL80ts}/P{Arf1KK101396}; dsx-GAL4/TI{TI}Rab1EYFP.
Fig 7
Fig 7. Rab6 and Rab11 are both required for DCG biogenesis in SCs.
(A-C) Representative images of SCs expressing the DCG marker GFP-GPI with a control RNAi (A) or RNAis targeting Rab6 (B) or Rab11 (C). Cellular organisation is assessed by DIC imaging, GFP-GPI fluorescence and Lysotracker Red fluorescence, and a merged image for each cell. Note the reduction in large non-acidic compartments in these backgrounds with fewer containing DCGs and in some cases, the remaining compartments often filled with diffuse GFP. (D) Bar chart showing the number of compartments containing GFP-labelled DCGs in control SCs and following knockdown of Rab6 and Rab11. (E) Bar chart showing the number of large non-acidic compartments in these different genotypes. (F) Bar chart showing the percentage of large non-acidic compartments with diffuse GFP-GPI present in these different genotypes. Approximate outlines of SCs are marked by dashed circles. Scale bars: 10 μm. For D-F, bars show mean ± SD; Control, n = 29; Rab6 #1, n = 29; Rab6 #2, n = 32; Rab11 #1, n = 30; Rab11 #2, n = 31. P<0.05: *, P<0.01: **, P<0.001: ***, P<0.0001: ****. Genotypes for images: (A) w1118; P{tub-GAL80ts}/P{ryTRiP.HMS02827}; dsx-GAL4, P{UAS-GFP.GPI}/+; (B) w1118; P{tub-GAL80ts}/+; dsx-GAL4, P{UAS-GFP.GPI}/P{Rab6TRiP.HMS01486}; (C) w1118; P{tub-GAL80ts}/+; dsx-GAL4, P{UAS-GFP.GPI}/P{Rab11TRiP.JF02812}.
Fig 8
Fig 8. The Rab6 to Rab11 transition on secretory compartments controls exosome as well as DCG biogenesis in SCs.
(A-C) Representative images of SCs expressing the YFP-Rab11 fusion gene from the endogenous Rab locus with a control RNAi (A) or RNAis targeting Rab6 (B) or Rab11 (C). (D-F) Representative images of SCs expressing the CFP-Rab6 fusion gene from the endogenous Rab locus with a control RNAi (D) or RNAis targeting Rab6 (E) or Rab11 (F). Cellular organisation in all genotypes is assessed through DIC imaging, tagged Rab fluorescence and Lysotracker Red fluorescence, as well as a merged image for each cell. Note that when Rab6 is knocked down, there are reduced numbers of Rab11-compartments and fewer of those that remain contain normal DCGs (H, J, K). By contrast, Rab11 knockdown does not reduce the number of Rab6-positive compartments, but fewer of these compartments contain normal DCGs or ILVs (G, I, L, M). Also, note that some Rab11 fusion gene fluorescence is still visible even after knockdown of Rab11 (C), and similarly for CFP-Rab6 in the Rab6 knockdown (E). (G) Bar chart showing the number of CFP-Rab6-compartments containing DCGs in control SCs and following Rab6 and Rab11 knockdown. (H) Bar chart showing the number of YFP-Rab11-compartments containing DCGs in these different genotypes. (I) Bar chart showing the percentage of CFP-Rab6 compartments which fail to produce regular DCGs in these different genotypes. (J) Bar chart showing the percentage of YFP-Rab11 compartments which fail to produce regular DCGs in these different genotypes. (K) Bar chart showing the number of YFP-Rab11-compartments in these different genotypes. (L) Bar chart showing the number of CFP-Rab6 compartments in these different genotypes. (M) Bar chart showing the percentage of CFP-Rab6 compartments which contain CFP-Rab6-labelled ILVs following knockdown of Rab11 in SCs versus controls. Approximate outlines of SCs are marked by dashed circles. Scale bars: 10 μm. For G-M, bars show mean ± SD. For G, I and L, Control, n = 29; Rab6 #1, n = 30; Rab6 #2, n = 32; Rab11 #1, n = 36; Rab11 #2, n = 27. For H, J and K, Control, n = 36; Rab6 #1, n = 32; Rab6 #2, n = 23; Rab11 #1, n = 33; Rab11 #2, n = 25. For M, Control, n = 31; Rab11 #1, n = 36; Rab11 #2, n = 30. P<0.05: *, P<0.01: **, P<0.001: ***, P<0.0001: ****. Genotypes for images: (A) w1118; P{tub-GAL80ts}/P{ryTRiP.HMS02827}; dsx-GAL4, TI{TI}Rab11EYFP/+; (B) w1118; P{tub-GAL80ts}/+; dsx-GAL4, TI{TI}Rab11EYFP/P{Rab6TRiP.HMS01486}; (C) w1118; P{tub-GAL80ts}/+; dsx-GAL4, TI{TI}Rab11EYFP/P{Rab11TRiP.JF02812}; (D) w1118; P{tub-GAL80ts}, TI{TI}Rab6CFP/P{ryTRiP.HMS02827}; dsx-GAL4/+; (E) w1118; P{tub-GAL80ts}, TI{TI}Rab6CFP/+; dsx-GAL4/P{Rab6TRiP.HMS01486}; (F) w1118; P{tub-GAL80ts}, TI{TI}Rab6CFP/+; dsx-GAL4/P{Rab11TRiP.JF02812}.
Fig 9
Fig 9. Model for the regulation of DCG compartment biogenesis in SCs.
(A) A schematic illustrating our previous and updated model of SC secretory and endosomal compartment organisation. Whereas previously it was recognised that DCG compartments in SCs were labelled by Rab11, we have now shown that Rab6 and Rab19 also mark large secretory compartments and can co-label compartments alongside Rab11. We have also demonstrated that Rab1 marks a population of smaller compartments near the cell centre and can colocalise with Rab6 on the surface of growing compartments. Finally, as well as the Rab11-positive ILVs which were recognised beforehand, we have also described the existence of ILVs marked by Rab6 and Rab19, which can be found in compartments labelled by Rab11, and will be secreted as Rab11-exosomes. (B) Schematic outlining the genetic regulation of secretory compartment maturation and DCG biogenesis in SCs. Our results have highlighted at least 6 discrete stages which occur during secretory compartment maturation. (1) In the earliest stage, small Rab1-compartments fuse together and recruit Rab6 to their limiting membrane, creating enlarged Rab1/Rab6-positive compartments. (2) These compartments continue to grow, at least in part via fusion events, until they eventually lose all Rab1. They are then marked solely by Rab6, and contain neither DCGs nor ILVs. The Rab1 to Rab6 transition is regulated by Arf1 and Rab6 recruitment is required to progress to later maturation steps. (3) Soon after formation, Rab6-positive compartments contract in size. They subsequently recruit Rab11 to their limiting membrane, inducing the formation of ILVs, some of which appear to coalesce into the long ILV chains we have observed (internal lines in compartments). The recruitment of Rab11 is regulated by Arf1 and the AP-1 complex, without which most Rab11-compartments fail to form. Any that do form usually do not mature normally. (4) As Rab11 continues to be recruited to membranes, DCG biogenesis occurs within compartments. BMP signalling regulates the rate of DCG-compartment biogenesis, indicating that BMP acts at one or more points upstream of this event [32]. Additionally, AP-1 regulates normal DCG biogenesis. (5) Over several more hours, Rab6 is fully shed from the limiting membrane, leaving a mature secretory compartment which contains a DCG and a mix of ILVs. (6) Matured compartments are eventually secreted following fusion with the plasma membrane. Secretory compartment release is regulated by BMP signalling [32], but the other factors involved remain unclear. Specific SNARE proteins are likely required for fusion to the plasma membrane, and compartments may undergo further maturation steps, possibly regulated by factors such as Rab19 and additional signalling pathways.

Similar articles

Cited by

References

    1. Gondré-Lewis MC, Park JJ, Loh YP. Cellular mechanisms for the biogenesis and transport of synaptic and dense-core vesicles. Int Rev Cell Mol Biol. 2012;299: 27–115. doi: 10.1016/B978-0-12-394310-1.00002-3 - DOI - PubMed
    1. Haeberlé AM, Bailly Y, Billuart P, Vitale N, Bader MF, Ory S, et al.. Oligophrenin-1 Connects Exocytotic Fusion to Compensatory Endocytosis in Neuroendocrine Cells. J Neurosci. 2015;35: 11045–55. doi: 10.1523/JNEUROSCI.4048-14.2015 - DOI - PMC - PubMed
    1. Tsuchiya M, Hosaka M, Moriguchi T, Zhang S, Suda M, Yokota-Hashimoto H, et al.. Cholesterol biosynthesis pathway intermediates and inhibitors regulate glucose-stimulated insulin secretion and secretory granule formation in pancreatic beta-cells. Endocrinology. 2010;151: 4705–16. doi: 10.1210/en.2010-0623 - DOI - PubMed
    1. Giudici AM, Sher E, Pelagi M, Clementi F, Zanini A. Immunolocalization of secretogranin II, chromogranin A, and chromogranin B in differentiating human neuroblastoma cells. Eur J Cell Biol. 1992;58: 383–9. - PubMed
    1. Siddhanta A, Backer JM, Shields D. Inhibition of phosphatidic acid synthesis alters the structure of the Golgi apparatus and inhibits secretion in endocrine cells. J Biol Chem. 2000;275: 12023–31. doi: 10.1074/jbc.275.16.12023 - DOI - PubMed

LinkOut - more resources