. 2023 Oct 16;19(10):e1011571.
doi: 10.1371/journal.pcbi.1011571. eCollection 2023 Oct.

Establishing brain states in neuroimaging data

Affiliations

Establishing brain states in neuroimaging data

Zalina Dezhina et al. PLoS Comput Biol. .

Abstract

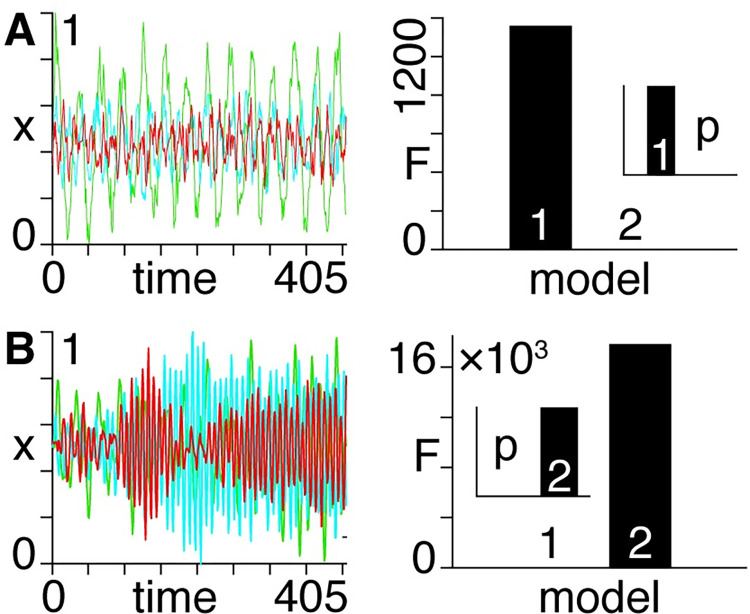
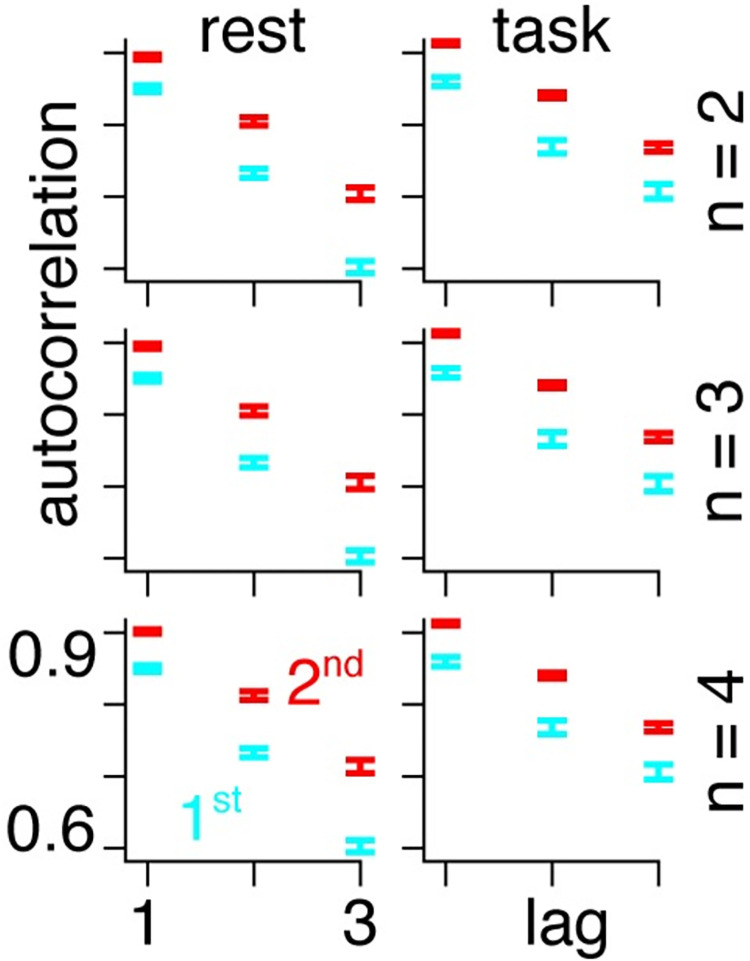
The definition of a brain state remains elusive, with varying interpretations across different sub-fields of neuroscience-from the level of wakefulness in anaesthesia, to activity of individual neurons, voltage in EEG, and blood flow in fMRI. This lack of consensus presents a significant challenge to the development of accurate models of neural dynamics. However, at the foundation of dynamical systems theory lies a definition of what constitutes the 'state' of a system-i.e., a specification of the system's future. Here, we propose to adopt this definition to establish brain states in neuroimaging timeseries by applying Dynamic Causal Modelling (DCM) to low-dimensional embedding of resting and task condition fMRI data. We find that ~90% of subjects in resting conditions are better described by first-order models, whereas ~55% of subjects in task conditions are better described by second-order models. Our work calls into question the status quo of using first-order equations almost exclusively within computational neuroscience and provides a new way of establishing brain states, as well as their associated phase space representations, in neuroimaging datasets.


Conflict of interest statement

The authors declare no competing interests.

Figures

Fig 1
Fig 1. The state of a three-node system in which the regions are coupled only to themselves (i.e., not to one another), as indicated by the looped grey arrows.
Each region is acted upon by a driving input, as indicated by the dashed central grey arrows. The future of the system is determined by its own present.
Fig 2
Fig 2. Same as Fig 1, except the state of the system (and hence its future) now depends upon its past as well as its present.
Fig 3
Fig 3
A) Left: first-order synthetic timeseries with normalized dependent variable (x). Right: Approximate log model evidence (variational free energy, ’F’) and associated probabilities (’p’, inset) following Bayesian model inversion, demonstrating that this timeseries is correctly associated with a first-order model. B) Same as A), except the timeseries on the left is second-order, as identified by the associated model comparison on the right.
Fig 4
Fig 4
Left: gradient-based timeseries with normalized dependent variables for single subjects. Right: approximate log model evidence (variational free energy, ’F’) and associated probabilities (’p’, inset) for first and second-order dynamics following Bayesian model inversion. A) An example of rest condition better described by a first-order model. B) An example of rest condition better described by a second-order model. C) An example of task condition better described by a first-order model. D) An example of task condition better described by a second-order model.
Fig 5
Fig 5
The proportion of subjects (s) that are better described by 1st and 2nd order models in rest (top) and task (bottom) conditions for n = 2, n = 3, and n = 4 gradients.
Fig 6
Fig 6
The proportion of subjects (s) that are better described by 1st and 2nd order models in rest (top) and task (bottom) conditions for n = 2, n = 3, and n = 4 gradients, for circularly shifted timeseries.
Fig 7
Fig 7
Temporal autocorrelation (y-axis) as a function of the lag (x-axis) for rest (left column) and task (right column) for n = 2 (first row), n = 3 (middle row) and n = 4 (bottom row) gradients. The results show that the subjects that are better described by second-order models (red) have consistently higher auto-correlations than the subjects that are better described by first-order models (blue).

References

    1. Structure Sporns O. and function of complex brain networks. Dialogues in clinical neuroscience. 2022. - PMC - PubMed
    1. Buzsaki G. Rhythms of the Brain: Oxford University Press; 2006.
    1. Kringelbach ML, Deco G. Brain states and transitions: insights from computational neuroscience. Cell Reports. 2020;32(10):108128. doi: 10.1016/j.celrep.2020.108128 - DOI - PubMed
    1. Hallermann S, De Kock CP, Stuart GJ, Kole MH. State and location dependence of action potential metabolic cost in cortical pyramidal neurons. Nature neuroscience. 2012;15(7):1007–14. doi: 10.1038/nn.3132 - DOI - PubMed
    1. Hopfield JJ. Neurons with graded response have collective computational properties like those of two-state neurons. Proceedings of the national academy of sciences. 1984;81(10):3088–92. doi: 10.1073/pnas.81.10.3088 - DOI - PMC - PubMed