. 2023 Nov;623(7989):1053-1061.
doi: 10.1038/s41586-023-06696-z. Epub 2023 Oct 16.

Targeting myeloid chemotaxis to reverse prostate cancer therapy resistance

Affiliations

Targeting myeloid chemotaxis to reverse prostate cancer therapy resistance

Christina Guo et al. Nature. 2023 Nov.

Abstract

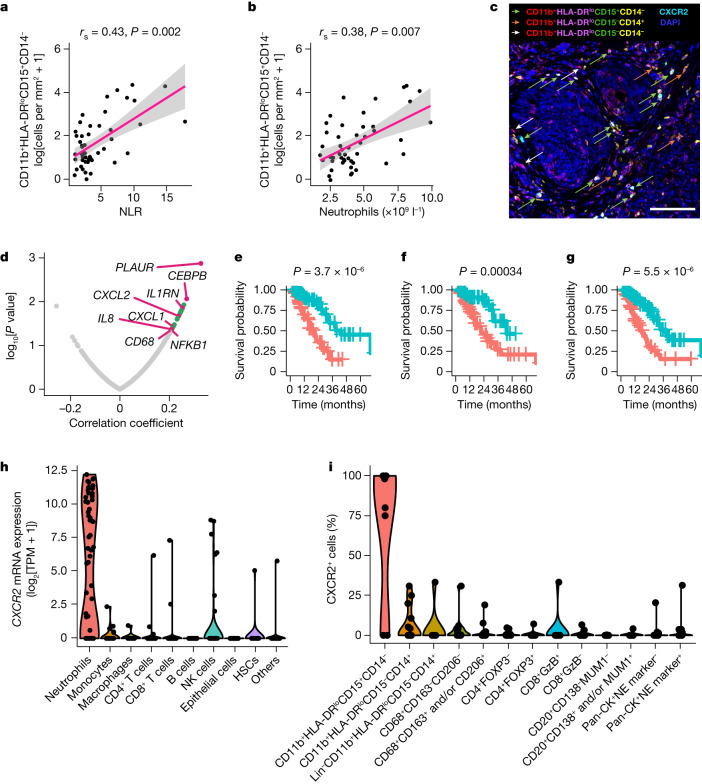
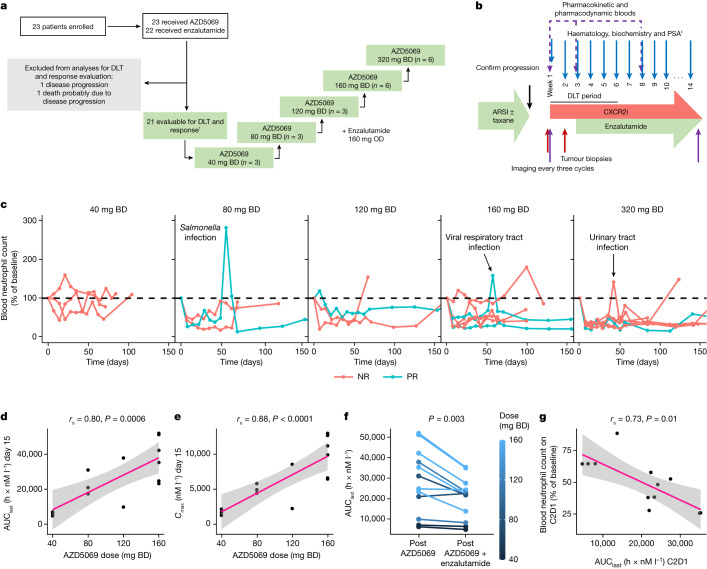
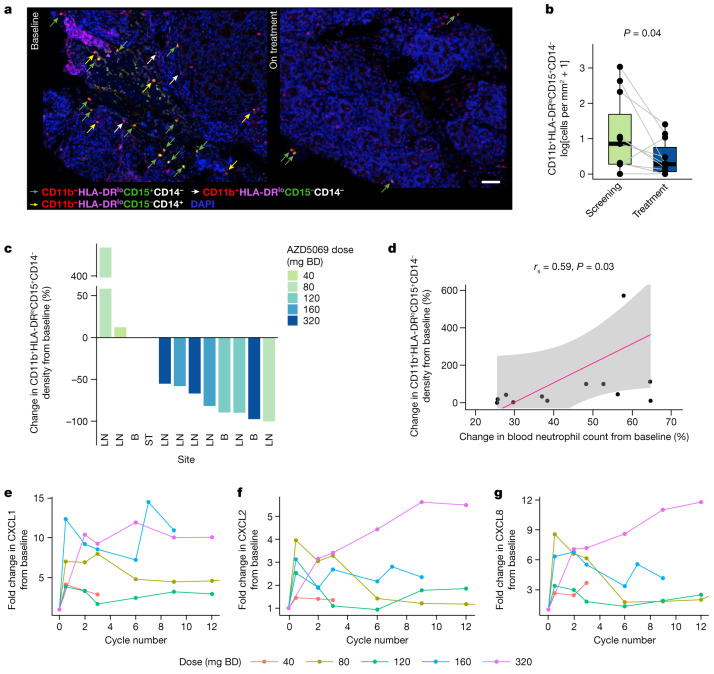
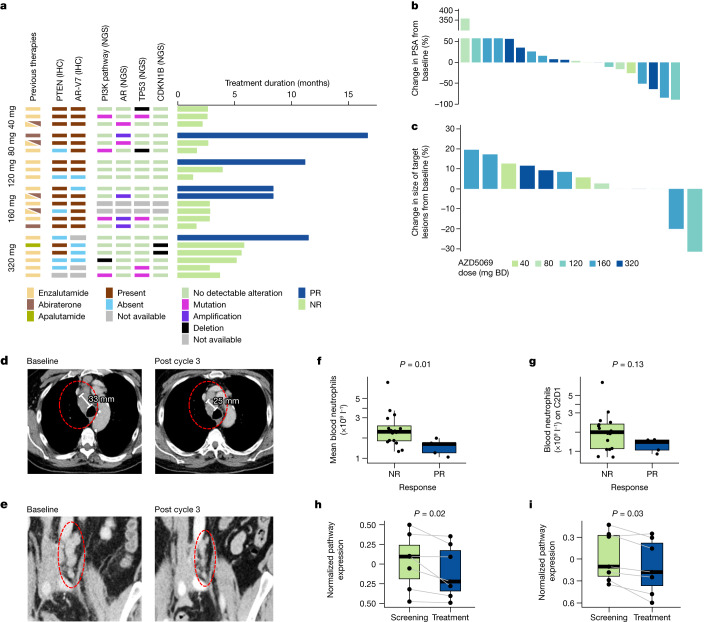
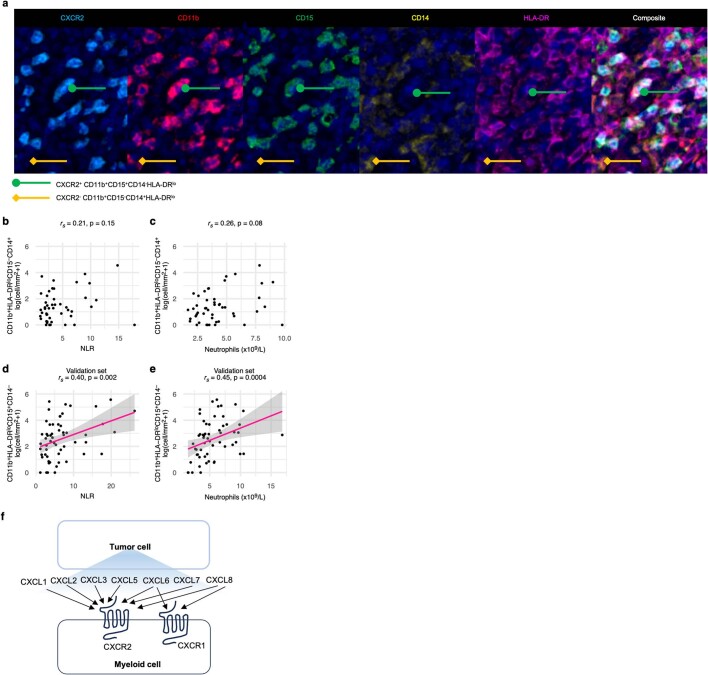
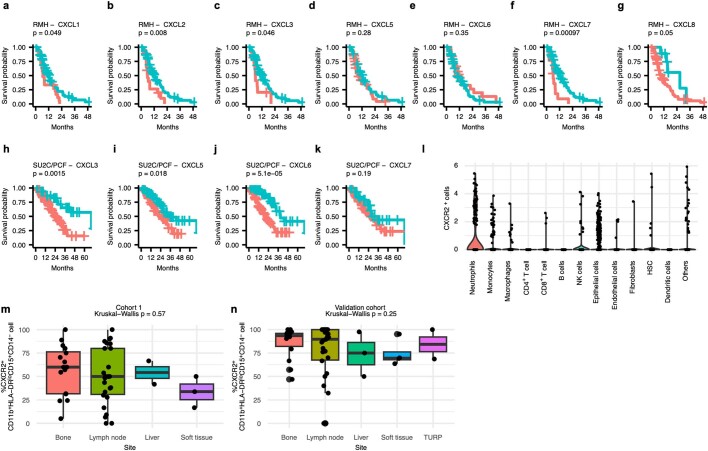
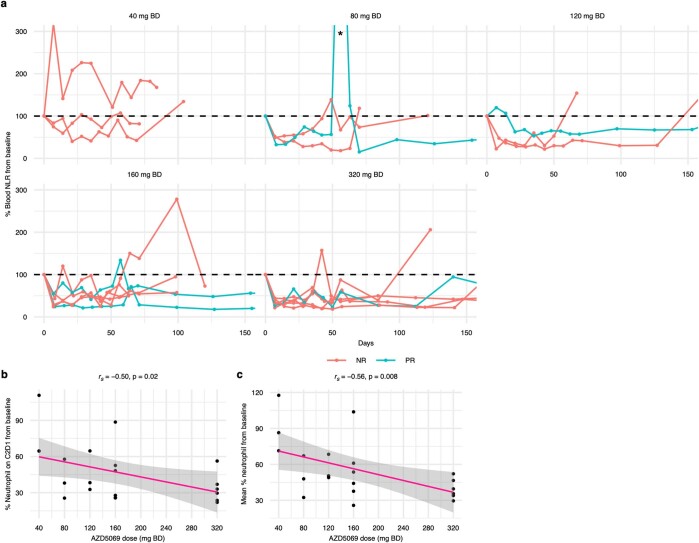
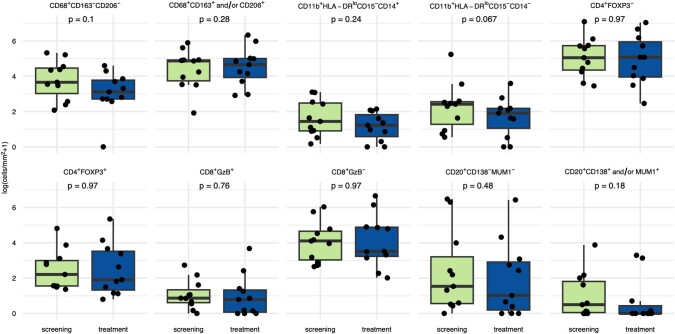
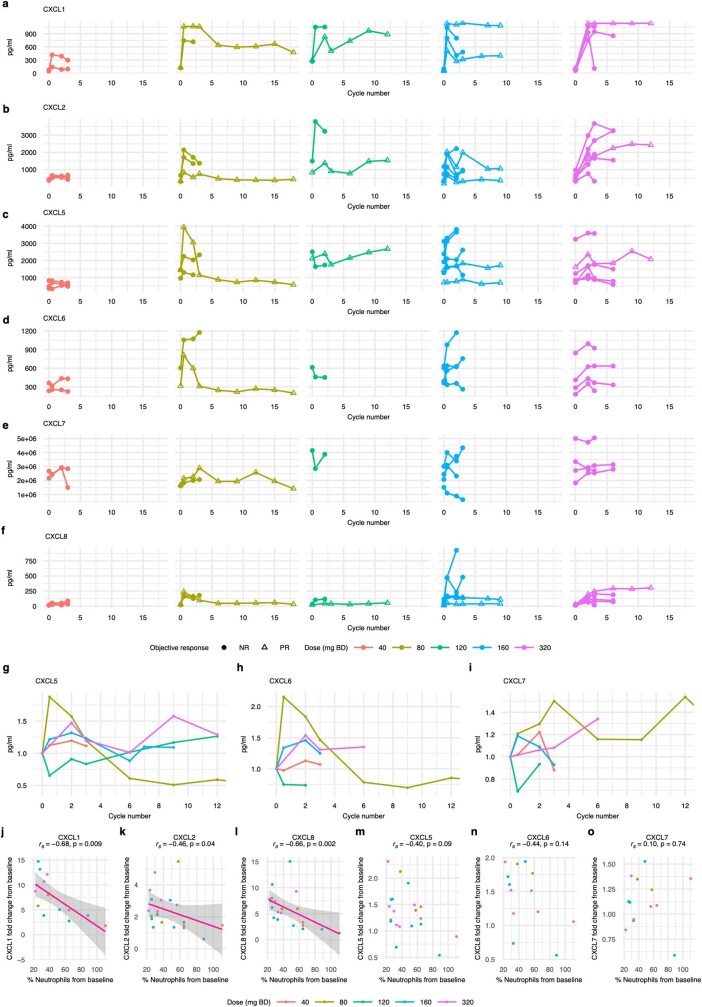
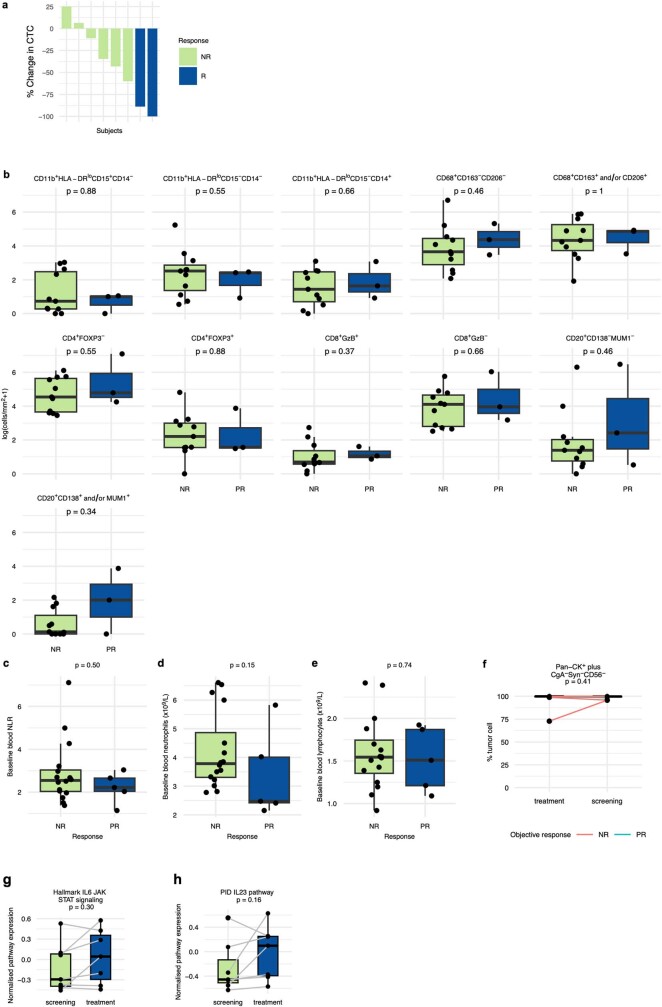
Inflammation is a hallmark of cancer1. In patients with cancer, peripheral blood myeloid expansion, indicated by a high neutrophil-to-lymphocyte ratio, associates with shorter survival and treatment resistance across malignancies and therapeutic modalities2-5. Whether myeloid inflammation drives progression of prostate cancer in humans remain unclear. Here we show that inhibition of myeloid chemotaxis can reduce tumour-elicited myeloid inflammation and reverse therapy resistance in a subset of patients with metastatic castration-resistant prostate cancer (CRPC). We show that a higher blood neutrophil-to-lymphocyte ratio reflects tumour myeloid infiltration and tumour expression of senescence-associated mRNA species, including those that encode myeloid-chemoattracting CXCR2 ligands. To determine whether myeloid cells fuel resistance to androgen receptor signalling inhibitors, and whether inhibiting CXCR2 to block myeloid chemotaxis reverses this, we conducted an investigator-initiated, proof-of-concept clinical trial of a CXCR2 inhibitor (AZD5069) plus enzalutamide in patients with metastatic CRPC that is resistant to androgen receptor signalling inhibitors. This combination was well tolerated without dose-limiting toxicity and it decreased circulating neutrophil levels, reduced intratumour CD11b+HLA-DRloCD15+CD14- myeloid cell infiltration and imparted durable clinical benefit with biochemical and radiological responses in a subset of patients with metastatic CRPC. This study provides clinical evidence that senescence-associated myeloid inflammation can fuel metastatic CRPC progression and resistance to androgen receptor blockade. Targeting myeloid chemotaxis merits broader evaluation in other cancers.


Conflict of interest statement

A. Sharp, B.G., M.C., I.F., J.R., M.R., L.G., W.Y., S.C., K.C., A.P., C.B., G.S., J. Goodall, F.R., R. Ruddle, K.E.S., J.M., D.B., C.T., A.N., N.T., D. Westaby, J.C., M.D.F., C.Y., R.M., H.B., T.P., A.T., M.P., H.T., R. Riisnaes, A.F., P.F., S.D., A. Schlag and J.S.d.B. are employees of The ICR, which has a commercial interest in abiraterone, PARP inhibition in DNA-repair-defective cancers and PI3K–AKT pathway inhibitors. C.G. was an employee of The ICR during the conduct of this work, as well as submission, review, and revision of the manuscript, and is now an employee of Roche-Genentech. A. Sharp has received travel support from Sanofi, Roche-Genentech and Nurix, and speaker honoraria from Astellas Pharma and Merck Sharp & Dohme; has served as an advisor to DE Shaw Research and CHARM Therapeutics; and has been the chief or principal investigator of industry-sponsored clinical trials. J.S.d.B. has served on advisory boards and received fees from companies including Amgen, AstraZeneca, Astellas, Bayer, Bioxcel Therapeutics, Boehringer Ingelheim, Cellcentric, Daiichi, Eisai, Genentech/Roche, Genmab, GSK, Harpoon, Janssen, Merck Serono, Merck Sharp & Dohme, Menarini/Silicon Biosystems, Orion, Pfizer, Qiagen, Sanofi Aventis, Sierra Oncology, Taiho, Terumo and Vertex Pharmaceuticals. J.S.d.B. receives funding or other support for his research work from Daiich Sankyo, AstraZeneca, Astellas, Bayer, Cellcentric, Daiichi, Roche-Genentech, Genmab, GSK, Janssen, Merck Serono, MSD, Menarini/Silicon Biosystems, Orion, Sanofi Aventis, Sierra Oncology, Taiho, Pfizer and Vertex. J.S.d.B. was named as an inventor, with no financial interest, on US patent 8,822,438. J.S.d.B. has been the chief or principal investigator of many industry-sponsored clinical trials. S.J. has served on advisory boards and received fees from companies including Accord, AstraZeneca, Astellas, Bayer, Boston Scientific, Janssen and Pfizer; and reports research funding from Boston Scientific for other research projects. I.C. reports speaker, consultancy or advisory role activities for GSK, AstraZeneca, Novartis and MSD; travel grants from Tesaro, GSK, AstraZeneca and Janssen; and research funding (to institution as the principal investigator) from MSD, Bayer, Incyte, AstraZeneca and Vivesto. U.V. reports an advisory role (institutional) to Janssen, Astellas, Merck, MSD, Pfizer, Roche, Bayer, BMS and Novartis AAA; travel support from Janssen, Merck and Ipsen; being part of the speaker bureau for (compensated, institutional) Janssen, Astellas, Pfizer, Roche, SAMO, BMS and Ipsen; and grant funding from Fond’Action. A. Stathis serves as a principal investigator and receives institutional funding for clinical trials sponsored by AstraZeneca, Bayer, Incyte, Roche, Abbvie, ADC Therapeutics, Amgen, Cellestia, Loxo Oncology, Merck MSD, Novartis, Pfizer, Philogen and Roche; received travel grants from AstraZeneca and Incyte; served on advisory boards for Janssen and Roche; provided expert testimony to Bayer and Eli Lilly. M.D.F. received travel funding from Astellas, AstraZeneca, Pfizer, Pierre Fabre, Roche, Bristol Meiers Squibb, Novartis, MSD, Janssen and Bayer, and personal fees from Janssen, Pierre Fabre and Roche (all funding and fees were outside the submitted work). J. Gil has acted as a consultant for Unity Biotechnology, Geras Bio, Myricx Pharma and Merck KGaA. Pfizer and Unity Biotechnology have financially supported research in J. Gil’s laboratory (unrelated to the work presented here). J. Gil owns equity in Geras Bio. J. Gil is a named inventor on MRC and Imperial College patents, both related to senolytic therapies (the patents are not related to the work presented here). A.A. has been the principal investigator of industry-sponsored clinical trials sponsored by Astellas Pharma Inc., AstraZeneca, Sun Pharma Global FZE; has received consulting fees from Debiopharm; and owns shares in Oncosence. B.C., D. Waugh., R.C. and C.A. do not have any competing interest to declare.

Figures

Fig. 1
Fig. 1. Prostate tumour cells generate CXCR2 chemokines associated with tumour and peripheral myeloid inflammation.
a,b, Scatter plots of log-transformed intratumour CD11b+HLA-DRloCD15+CD14 cell density versus NLR (a) and neutrophil count (b) in patients with mCRPC (cohort 1, n = 48). Shown are estimated linear regression lines (pink) with 95% confidence intervals (grey), correlation coefficients, and P values from the two-sided Spearman’s rank correlation analyses. c, Micrograph showing a six-colour IF panel example of a human mCRPC biopsy stained for CD11b, HLA-DR, CD15, CD14 and CXCR2 and with DAPI, with arrows depicting different myeloid subsets. Scale bar, 100 μm. Entire slides were scanned and analysable slide areas were quantified for a,b. d, Volcano plot of the top 20 immune transcripts (green and pink) expressed in mCRPC biopsy bulk transcriptomes (RMH cohort, n = 95) that most positively associated with NLR. Pink, SASP genes and CXCR2 chemokines. eg, Kaplan–Meier plots of overall survival from the time of CRPC biopsy based on gene expression of CXCL1 (e), CXCL2 (f) and CXCL8 (g) in CRPC bulk transcriptomes from the SU2C–PCF (n = 141) cohort. Gene expression cutoff was determined using the optimized Maxstat method. Blue line, low expression; red line, high expression. P values were calculated using the log-rank test. h, Violin plot of CXCR2 mRNA expression from single-cell RNA-seq data from 15 advanced prostate cancer biopsies (14 patients). TPM, transcripts per million; NK, natural killer; HSCs, haematopoietic stem cells. i, Violin plots by proportion of intratumour immune cell and tumour cells staining for CXCR2 protein in human mCRPC biopsies (n = 14). NE, neuroendocrine. Source Data
Fig. 2
Fig. 2. CXCR2 blockade leads to dose-dependent, on-target neutropaenia.
a, Patient disposition per Consolidated Standards of Reporting Trials guidelines. Two patients were replaced per protocol after coming off study before completing the DLT period for a reason other than a DLT, and therefore were not evaluable for the primary endpoint or response. b, Clinical trial schema. Patients had confirmed disease progression on androgen deprivation therapy and at least one ARSI. Week count relative to the commencement of AZD5069 administration is shown. Cohorts 1–4 started AZD5069 2 weeks before enzalutamide; cohort 5 started drugs concurrently. PSA test was carried out on day 1 of each cycle. c, By-patient, serial, peripheral blood neutrophil counts for each dose level of AZD5069. All available data points up to day 150 are shown. NR, patient classed as a non-responder; PR, patient classed as a partial responder. d, Scatterplot of AZD5069 dose versus AUClast (h × nM l−1) for AZD5069 monotherapy on day 15 of AZD5069 administration at 40 to 160 mg BD (n = 14). e, Scatterplot of AZD5069 dose and peak concentration (Cmax (nM l−1)) on day 15 of AZD5059 administration in patients treated with AZD5069 at 40 to 160 mg BD (n = 14). f, AZD5069 plasma concentration (AUClast (h × nM l−1)) at steady state for AZD5069 monotherapy (after 14 days of monotherapy) versus combination therapy (after 28 days of combined administration of AZD5069 and enzalutamide; n = 12 pairs). Two-sided paired Wilcoxon signed-rank test P value is shown. Line colour indicates AZD5069 dose. g, Scatterplot of AZD5069 plasma concentration on cycle 2 day 1 (C2D1) (x axis) and  blood neutrophil count on C2D1 as a percentage of the value at baseline. For d,e,g, estimated linear regression lines (pink) with 95% confidence interval (grey band), and correlation coefficients and P values from the two-sided Spearman’s rank correlation analyses are shown.
Fig. 3
Fig. 3. CXCR2 blockade reduces myeloid infiltration in some patients with CRPC.
a, Example of a pair of CRPC biopsies showing myeloid cell changes before and after starting treatment. Green arrow: CD11b+HLA-DRloCD15+CD14 cells; yellow arrow: CD11b+HLA-DRloCD15CD14+ cells; white arrows: CD11b+HLA-DRloCD15CD14 cells. Nuclei were counterstained with DAPI. Scale bar, 100 µm. b, Comparison of CD11b+HLA-DRloCD15+CD14 myeloid cell densities (log-transformed cells per mm2) in mCRPC biopsies pre-treatment and on treatment in patients with blood neutrophil decrease of >30% (>40 mg BD dose levels; n = 11 pairs). Data are presented individually and as boxplots in which the middle horizontal line is the median, the lower and upper hinges are the first and third quartiles, and the upper and lower whiskers extend from the hinge to the minimum and maximum values. Grey lines link results from paired same-patient samples. Two-sided paired Wilcoxon signed-rank test P value is shown. c, Waterfall plot of percentage change in the density of CD11b+HLA-DRloCD15+CD14 myeloid cells in mCRPC biopsies before and after CXCR2i. The biopsy sites are annotated as LN for lymph node, B for bone, and ST for soft tissue. d, Scatter plot of the percentage of blood neutrophils on cycle 2 day 1 compared with baseline and the percentage of intratumour CD11b+HLA-DRloCD15+CD14 cell density after CXCR2i compared with baseline (for c,dn = 13, but note that one outlier for which myeloid cell density increased from a baseline of zero (fold change = infinity) is not shown on the graph). An estimated linear regression line (pink) with 95% confidence interval (grey band), and correlation coefficients and P values from the two-sided Spearman’s rank correlation analyses, are shown. eg, By-dose-level, mean fold change in circulating CXCL1 (n = 14 patients), CXCL2 (n = 20 patients) and CXCL8 (n = 20 patients) levels on study compared with baseline, pre-treatment levels. Data for patients from whom samples were not collected, or whose samples failed quality control for enzyme-linked immunosorbent assay, are not included. Line colour indicates AZD5069 dose.
Fig. 4
Fig. 4. CXCR blockade can reverse ARSI resistance in patients with mCRPC.
a, Treatment duration of response-evaluable patients grouped by AZD5069 dose (n = 21). Blue, patient classed as a partial responder; green, patient classed as a non-responder. Legend and coloured tiles indicate previous ARSI: enzalutamide (yellow), abiraterone (brown), apalutamide (dark green); AR-V7 protein status: nuclear Histo-score (HS) ≥ 10 (brown), nuclear HS < 10 (blue); PTEN protein status: nuclear or cytoplasmic HS ≥ 10 (brown), nuclear and cytoplasmic HS < 10 (blue), not available (grey); TP53, AR and PTEN–PI3K pathway genes, and CDKN1B genomic aberration status: no detectable alteration (green), pathogenic mutation (magenta), amplification (purple) and deletion (black) in baseline biopsies or cell-free DNA. b, Best PSA responses (n = 20). One patient was not evaluable for PSA response owing to early clinical disease progression. c, Best radiologic response in patients with measurable disease (n = 13). d,e, Example computerized tomography scan images of measurable disease taken pre-treatment and on treatment in two patients classed as partial responders treated at AZD5069 160 mg BD (d) and AZD5069 120 mg BD (e). White bars in d demarcate the short axis of a lymph node metastasis. f,g, Boxplots of mean blood neutrophil counts on treatment (f) and cycle 2 day 1 (C2D1) neutrophil counts (g) in patients classed as partial responders (n = 5) versus those classed as non-responders (n = 16). In f,g, data are presented individually and as boxplots in which the middle horizontal line is the median, the lower and upper hinges are the first and third quartiles, and the whisker extends from the hinge to the largest and smallest values no further than 1.5 × interquartile range (IQR) from the hinge. Two-sided Mann–Whitney U-test P values are shown. h,i, Expression of AR activity (h) and AR-V7 mRNA signatures (i) in same-patient pre- and on-treatment tumour biopsies (n = 7 pairs) with myeloid count decrease. In h,i, data are presented individually and as boxplots for which the middle line is the median, the lower and upper hinges are the first and third quartiles, and the upper and lower whiskers extend from the hinge to the maximum and minimum values. Grey lines link same-patient, paired samples. Two-sided paired Wilcoxon signed-rank test P values are shown.
Extended Data Fig. 1
Extended Data Fig. 1. Associations between CRPC myeloid cell density and NLR.
a, Example images from the six-colour IF panel for identifying myeloid cells (example of staining of appendix) of CXCR2, CD15, CD11b, CD14, HLA-DR, and DAPI. Green pointer: CD11b+HLA-DRloCD15+CD14, yellow arrow: CD11b+HLA-DRloCD15CD14+. Scale bar = 20 µm. b,c, Scatter plot of peripheral blood NLR (d) and neutrophil count (x109/L) (e) versus log-transformed intratumor CD11b+HLA-DRloCD15CD14+ cell density (cells/mm2) in cohort 1 (n = 48). d,e, Scatter plot of peripheral blood NLR (b) and neutrophil count (x109/L) (c) versus intratumor CD11b+HLA-DRloCD15+CD14 myeloid cell density (cells/mm2) in the validation cohort (n = 57). For ae, correlation coefficients and p-values from the two-sided Spearman’s rank correlation analyses are shown. For d,e, estimated linear regression lines (pink) with 95% confidence interval (grey band). f, diagram of known CXCR1 and CXCR2 ligands. Source data are presented in the source data file. Source Data
Extended Data Fig. 2
Extended Data Fig. 2. Clinical relevance of targeting the CXCR2 axis on myeloid cells in CRPC.
ak, Kaplan-Meier curves showing survival of mCRPC patients from the time of CRPC biopsy based on gene expression of CXCR2 chemokines in the RMH cohort (n = 94) (ag) and SU2C/PCF cohort (n = 141) (hk). Gene expression cut-offs were determined using the Maxstat method. p-values were calculated using the log-rank test. For (a–k), blue line represents low expression, red line represents high expression. l, Violin plot of CXCR2 mRNA expression on single cells from single-cell RNASeq data from 11 primary prostate tumour samples. m,n, Proportion of CD11b+HLA-DRloCD15+CD14 myeloid cells expressing CXCR2 by biopsy site in cohort 1 (n = 48) (m) and validation cohort (n = 57) (n). For m, n, data are presented individually and as boxplots where the middle line is the median, the lower and upper hinges are the first and third quartiles, the upper whisker extends from the hinge to the largest value no further than 1.5 × inter-quartile range (IQR) from the hinge and the lower whisker extends from the hinge to the smallest value at most 1.5 × IQR from the hinge. Kruskal-Wallis p-values comparing the percentage of CXCR2+ myeloid cells across biopsy sites are shown. Source data for ak, m,n are presented in the source data file. Source Data
Extended Data Fig. 3
Extended Data Fig. 3. CXCR2 inhibition led to dose-dependent decreases in blood neutrophils.
a, By-patient, serial, peripheral blood NLR for each dose level of AZD5069. Aqua line: responder, Pink line: non-responder. *Outlier with NLR peak of 789% from baseline on cycle 2 day 15 in the setting of salmonella infection. b, Scatterplot of AZD5069 dose administered twice daily versus percentage peripheral blood neutrophil counts on cycle 2 day 1 compared with baseline. c, Scatterplot showing of AZD5069 dose versus mean percentage blood neutrophil count on treatment compared with baseline. For b,c, estimated linear regression lines (pink) with 95% confidence interval (grey band), and correlation coefficients and p-values from the two-sided Spearman’s rank correlation analyses are shown.
Extended Data Fig. 4
Extended Data Fig. 4. Immune cell densities in CRPC biopsies with CXCR2 inhibition.
Intratumor immune cells densities (log-transformed density (cells/mm2)) in mCRPC biopsies taken during pre- (green) and on-treatment (blue), evaluating the immune cell subsets shown in all patients where on-target neutropenia (>30% mean decrease in neutrophils) was observed (n = 11 pairs). Data are represented by immune cell subset, individually, and as boxplots where the middle line is the median, the lower and upper hinges are the first and third quartiles, the upper whisker extends from the hinge to the largest value no further than 1.5 × interquartile range (IQR) from the hinge and the lower whisker extends from the hinge to the smallest value at most 1.5 × IQR from the hinge. Two-sided paired Wilcoxon signed-rank test p-values are shown.
Extended Data Fig. 5
Extended Data Fig. 5. Blood CXCR1 and CXCR2 cytokines after CXCR2i and enzalutamide.
af, Individual patient circulating levels of CXCL1 (n = 14), CXCL2 (n = 20), CXCL5 (n = 20), CXCL6 (n = 13), CXCL7 (n = 13), CXCL8 (n = 20) by dose level. Missing patients did not have samples collected or samples that failed quality control. g,h,i, By-dose level, mean fold change in circulating CXCL5 (g, n = 20), CXCL6 (h, n = 13), and CXCL7 (i, n = 13) levels compared with baseline over time. Samples were taken at baseline, on day 1 of each cycle and day 15 of the first cycle. j,k,l, Scatterplot of CXCL1 (j, n = 14), CXCL2 (k, n = 20), CXCL8 (l, n = 20) fold change from baseline versus percent blood neutrophil count from baseline on cycle 2 day 1. Estimated linear regression lines (pink) with 95% confidence interval (grey band), and correlation coefficients and p-values from the two-sided Spearman’s rank correlation analyses are shown. m,n,o, Scatterplot of CXCL5 (n = 20) (m), CXCL6 (n = 13) (n), CXCL7 (n = 13) (o) fold change from baseline versus percent blood neutrophil count from baseline on cycle 2 day 1. Correlation coefficient and p-value from the two-sided Spearman’s rank correlation test are shown. Colour of the lines and dots represent AZD5069 dose. NR = non-responder, PR = partial responder. BD = twice daily.
Extended Data Fig. 6
Extended Data Fig. 6. Prior treatment history of responders.
Systemic therapies administered after CRPC diagnosis in responders. Patients are ordered as per Fig. 4a. Each rectangle represents a two-month interval. All patients received androgen deprivation therapy throughout this period. Dose represents AZD5069 dose. AR-V7+ indicates the presence of AR-V7 protein expression in the pre-treatment CRPC biopsy. BD = twice daily.
Extended Data Fig. 7
Extended Data Fig. 7. Biomarker and bulk RNAseq analyses.
a, Waterfall plot showing maximum percentage CTC count decline from baseline in patients with CTC count ≥5 cells/7.5 ml at baseline. The two responding (R) patients with CTC count conversion from ≥5/7.5 ml of blood to <5 cells/7.5 ml of blood are shown in blue; patients also need to be on treatment for at least three cycles to be considered a responder. Non-responders (NR) are in green. b, Baseline immune cell densities (log-transformed (cells/mm2)) in mCRPC biopsies of responders (n = 3) versus non-responders at baseline (n = 11). Missing patients did not have analysable paired tumour sample for analysis by IF assays. c,d,e, Baseline blood NLR (c), neutrophil (x109/L) (d), and lymphocyte (x109/L) (e) in responders (n = 5) versus non-responders (n = 16). In be, data are presented individually and as boxplots where the middle horizontal line is the median, the lower and upper hinges are the first and third quartiles, the upper whisker extend from the hinge to the largest value no further than 1.5 × interquartile range (IQR) from the hinge and the lower whisker extends from the hinge to the smallest value at most 1.5 × IQR from the hinge. Two-sided Mann-Whitney U test p-values are shown. f, Chromogranin (CgA)synaptophysin (Syn)CD56 pan-CK+ cells as a proportion of all pan-CK+ cells in paired tumour biopsies (n = 11 pairs). Lines link paired samples and colour denotes response. NR = non-responder (red), PR = partial responder (green). Two-sided paired Wilcoxon signed-rank test p-value is shown. g,h, Boxplot of gene expression of the Hallmark IL-6-JAK2-STAT3 signalling gene signature (g) and PID IL-23 signature (h) in RNA profiling data from paired CRPC biopsies with CD11b+HLA-DRloCD15+CD14 cell decrease (n = 7 pairs). In g,h, data are presented individually and with boxplots where the middle line is the median, the lower and upper hinges are the first and third quartiles, and the upper and lower whiskers extend from the hinge to the largest value no further than 1.5 × IQR from the hinge and the lower whisker extends from the hinge to the smallest value at most 1.5 × IQR from the hinge. Lines link paired, same-patient samples. Two-sided paired Wilcoxon signed-rank test p-values are shown.

References

    1. Hanahan D. Hallmarks of cancer: new dimensions. Cancer Discov. 2022;12:31–46. doi: 10.1158/2159-8290.CD-21-1059. - DOI - PubMed
    1. Templeton AJ, et al. Simple prognostic score for metastatic castration-resistant prostate cancer with incorporation of neutrophil-to-lymphocyte ratio. Cancer. 2014;120:3346–3352. doi: 10.1002/cncr.28890. - DOI - PubMed
    1. Leibowitz-Amit R, et al. Clinical variables associated with PSA response to abiraterone acetate in patients with metastatic castration-resistant prostate cancer. Ann. Oncol. 2014;25:657–662. doi: 10.1093/annonc/mdt581. - DOI - PMC - PubMed
    1. Valero C, et al. Pretreatment neutrophil-to-lymphocyte ratio and mutational burden as biomarkers of tumor response to immune checkpoint inhibitors. Nat. Commun. 2021;12:729. doi: 10.1038/s41467-021-20935-9. - DOI - PMC - PubMed
    1. Howard R, Kanetsky PA, Egan KM. Exploring the prognostic value of the neutrophil-to-lymphocyte ratio in cancer. Sci. Rep. 2019;9:19673. doi: 10.1038/s41598-019-56218-z. - DOI - PMC - PubMed

Publication types

MeSH terms

Substances