. 2023 Dec 6;43(49):8336-8347.
doi: 10.1523/JNEUROSCI.0185-23.2023.

Protein 4.1N Plays a Cell Type-Specific Role in Hippocampal Glutamatergic Synapse Regulation

Affiliations

Protein 4.1N Plays a Cell Type-Specific Role in Hippocampal Glutamatergic Synapse Regulation

Anna N Pushkin et al. J Neurosci. .

Abstract

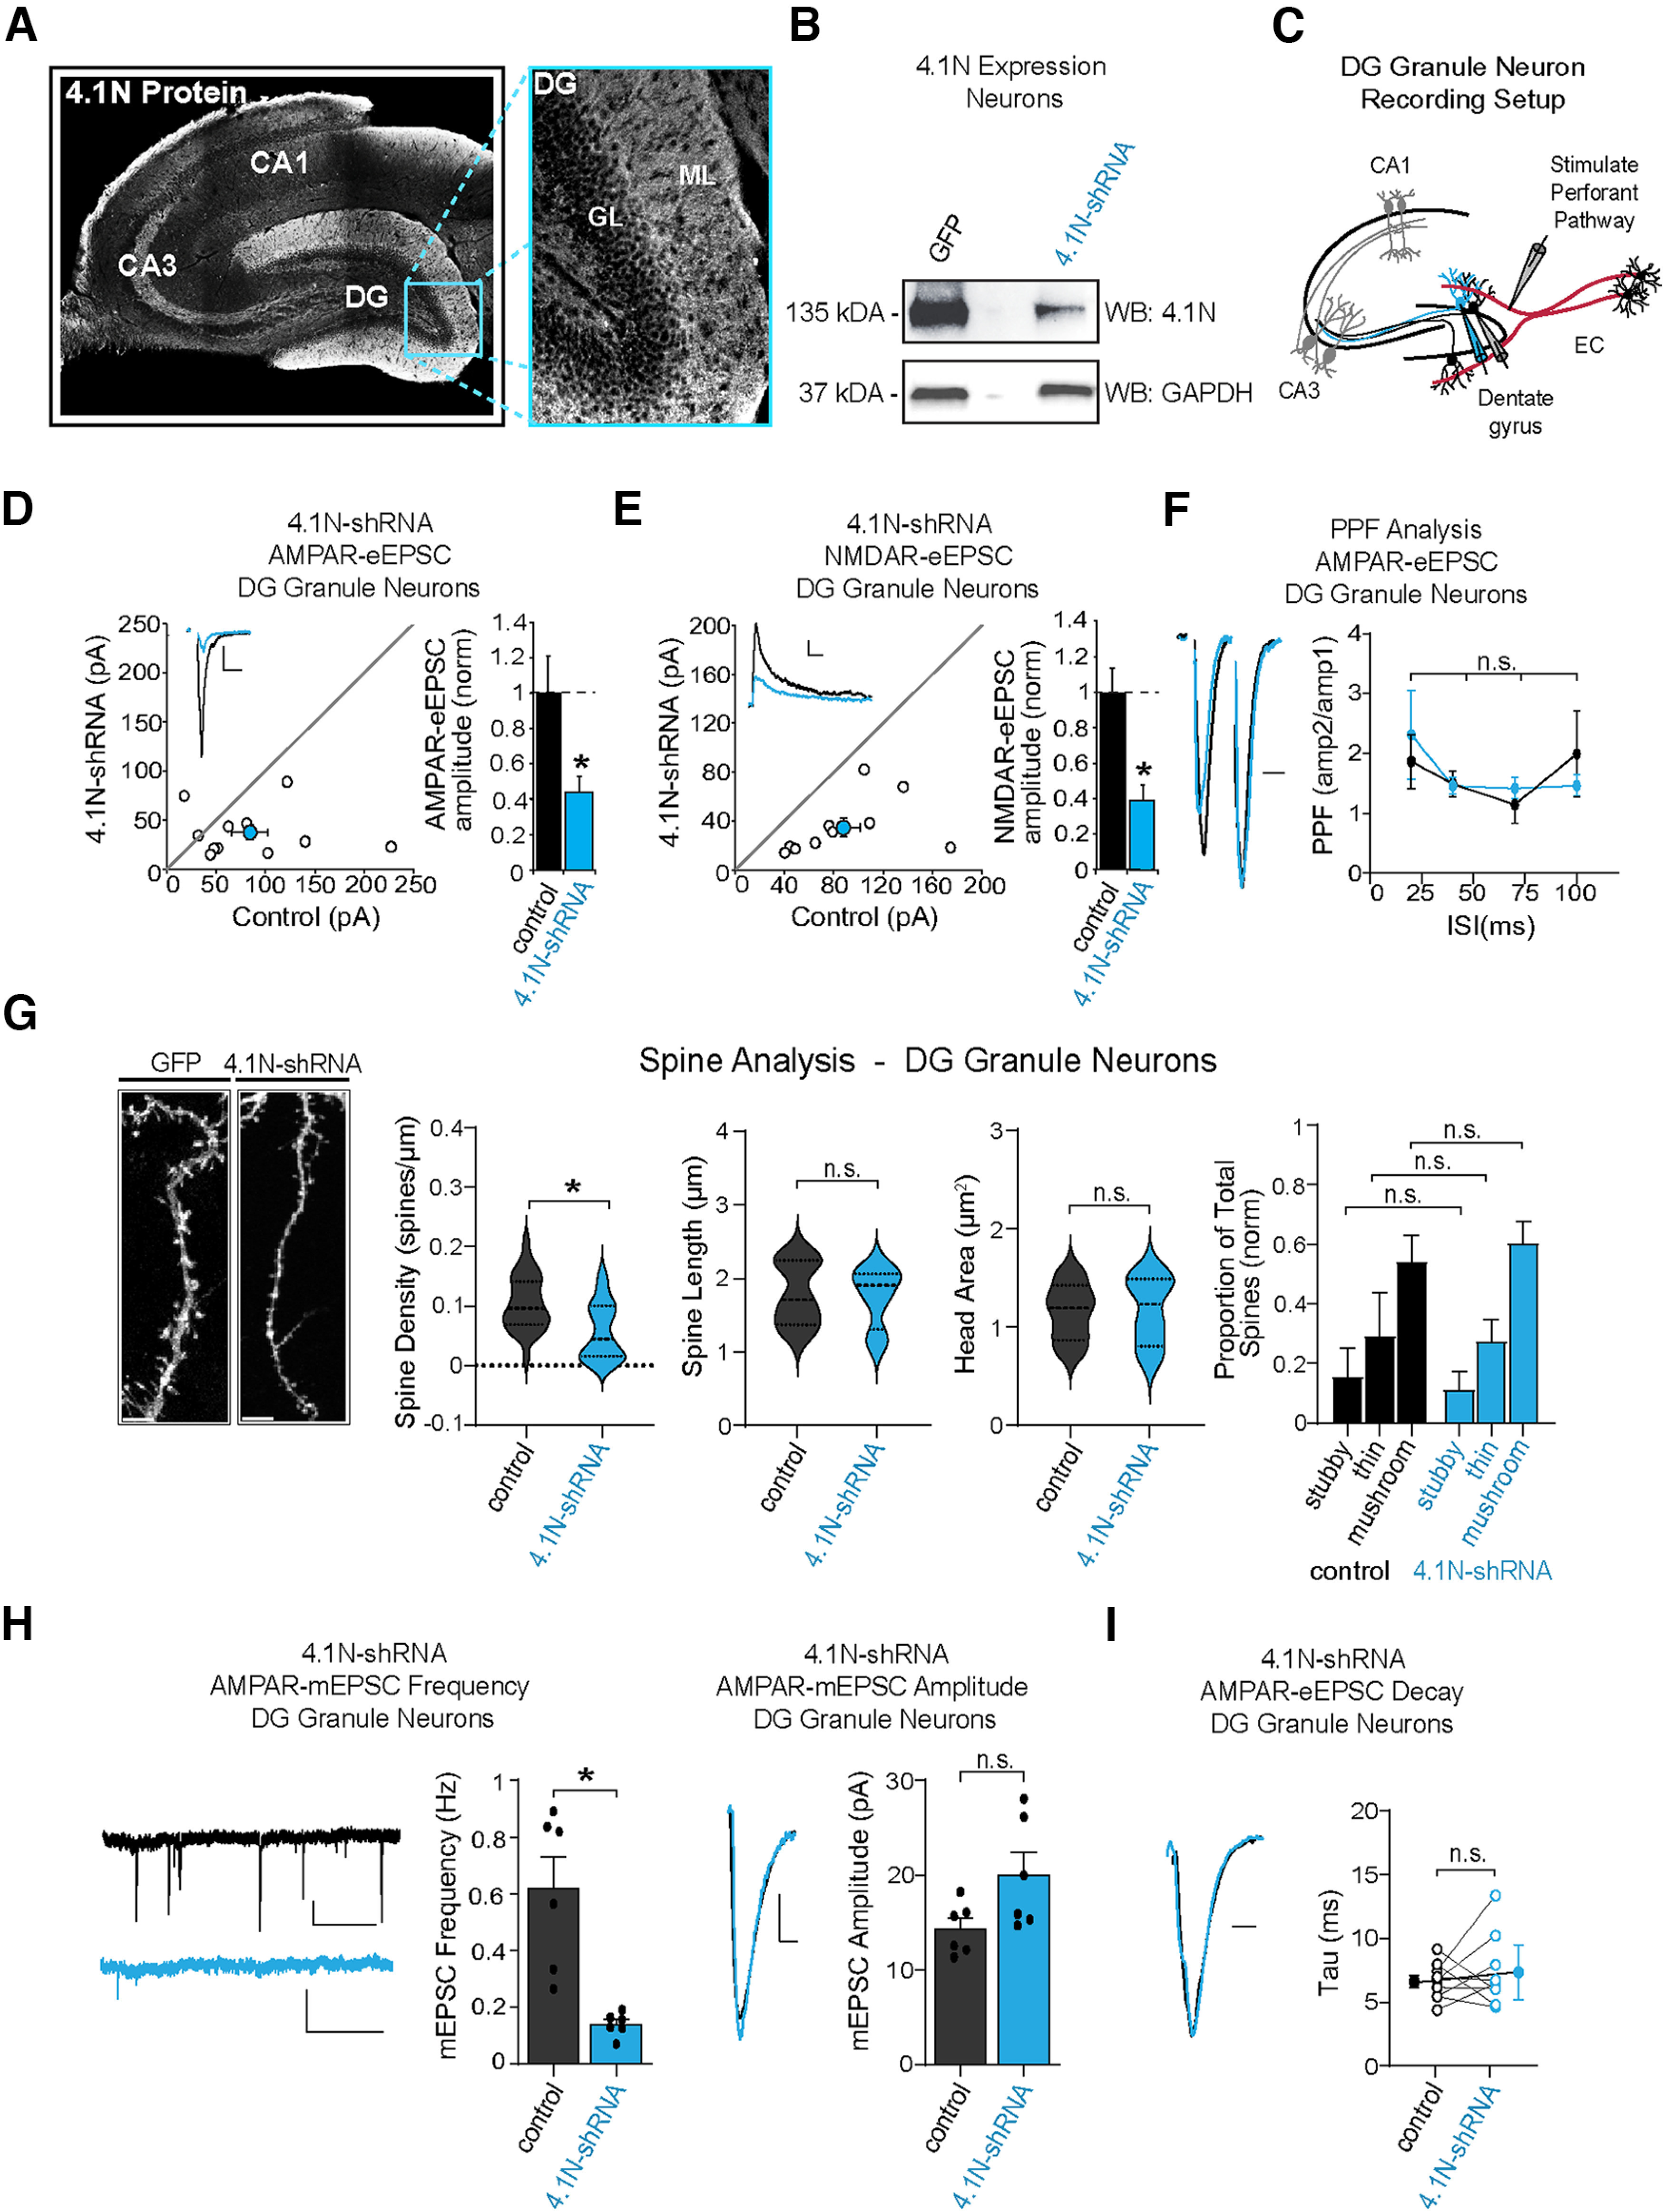
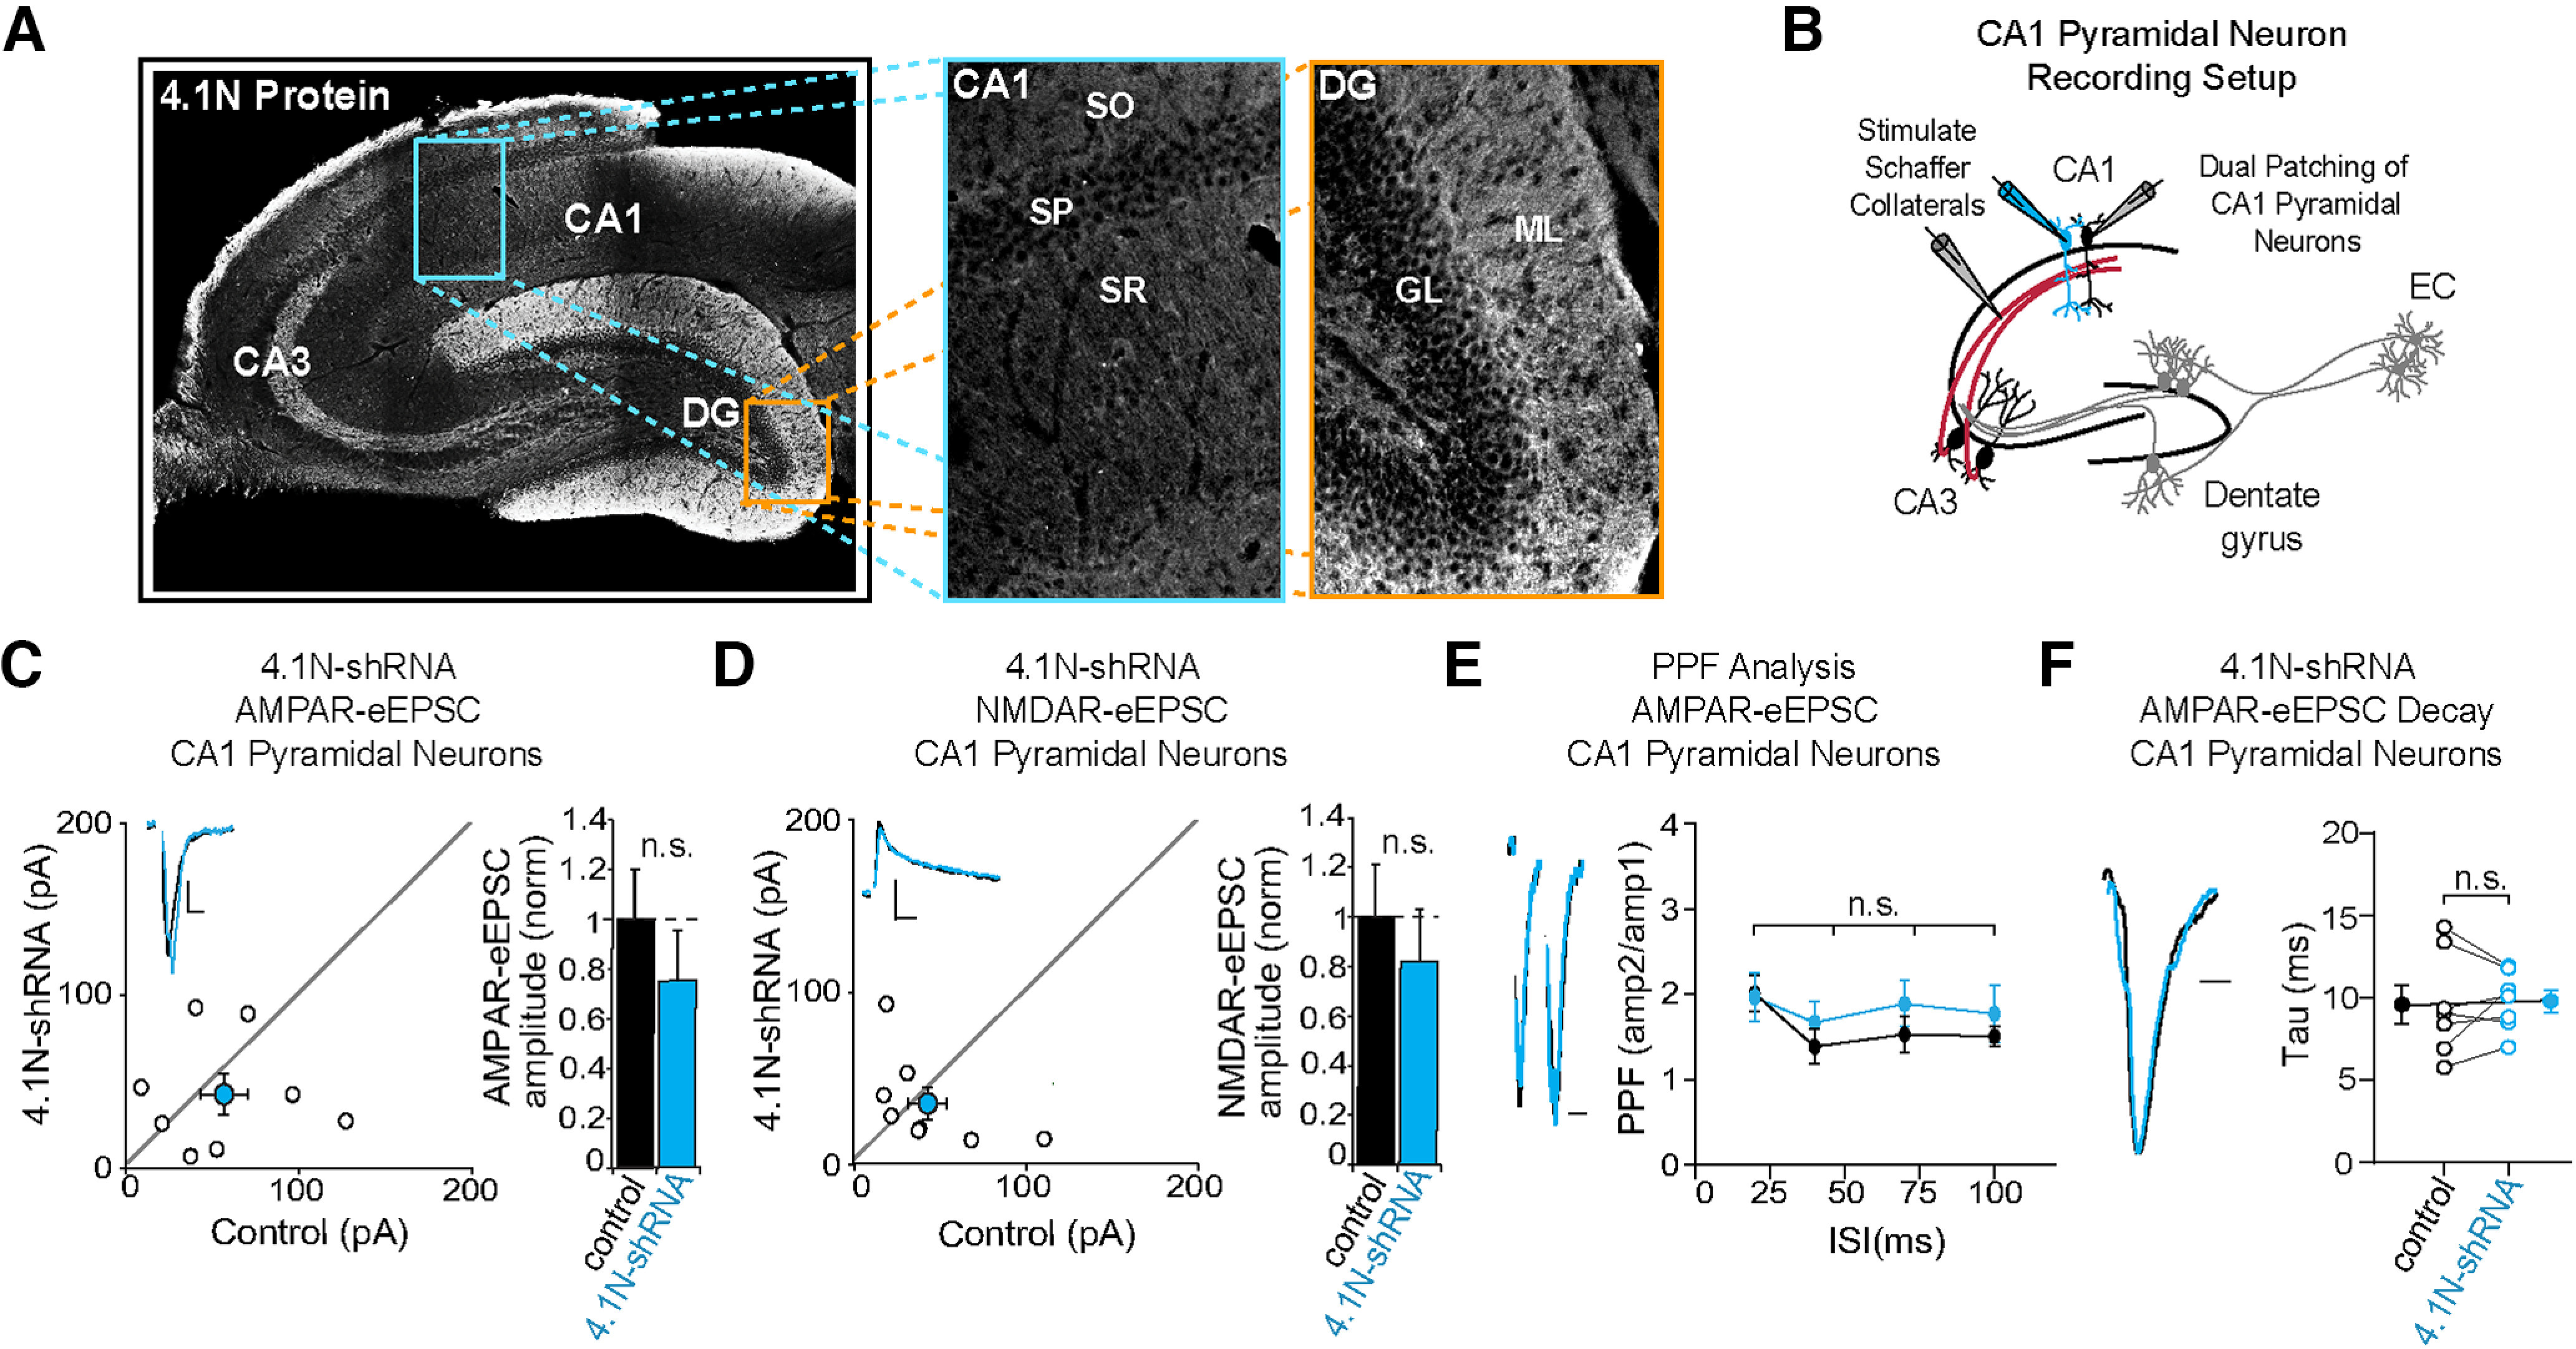
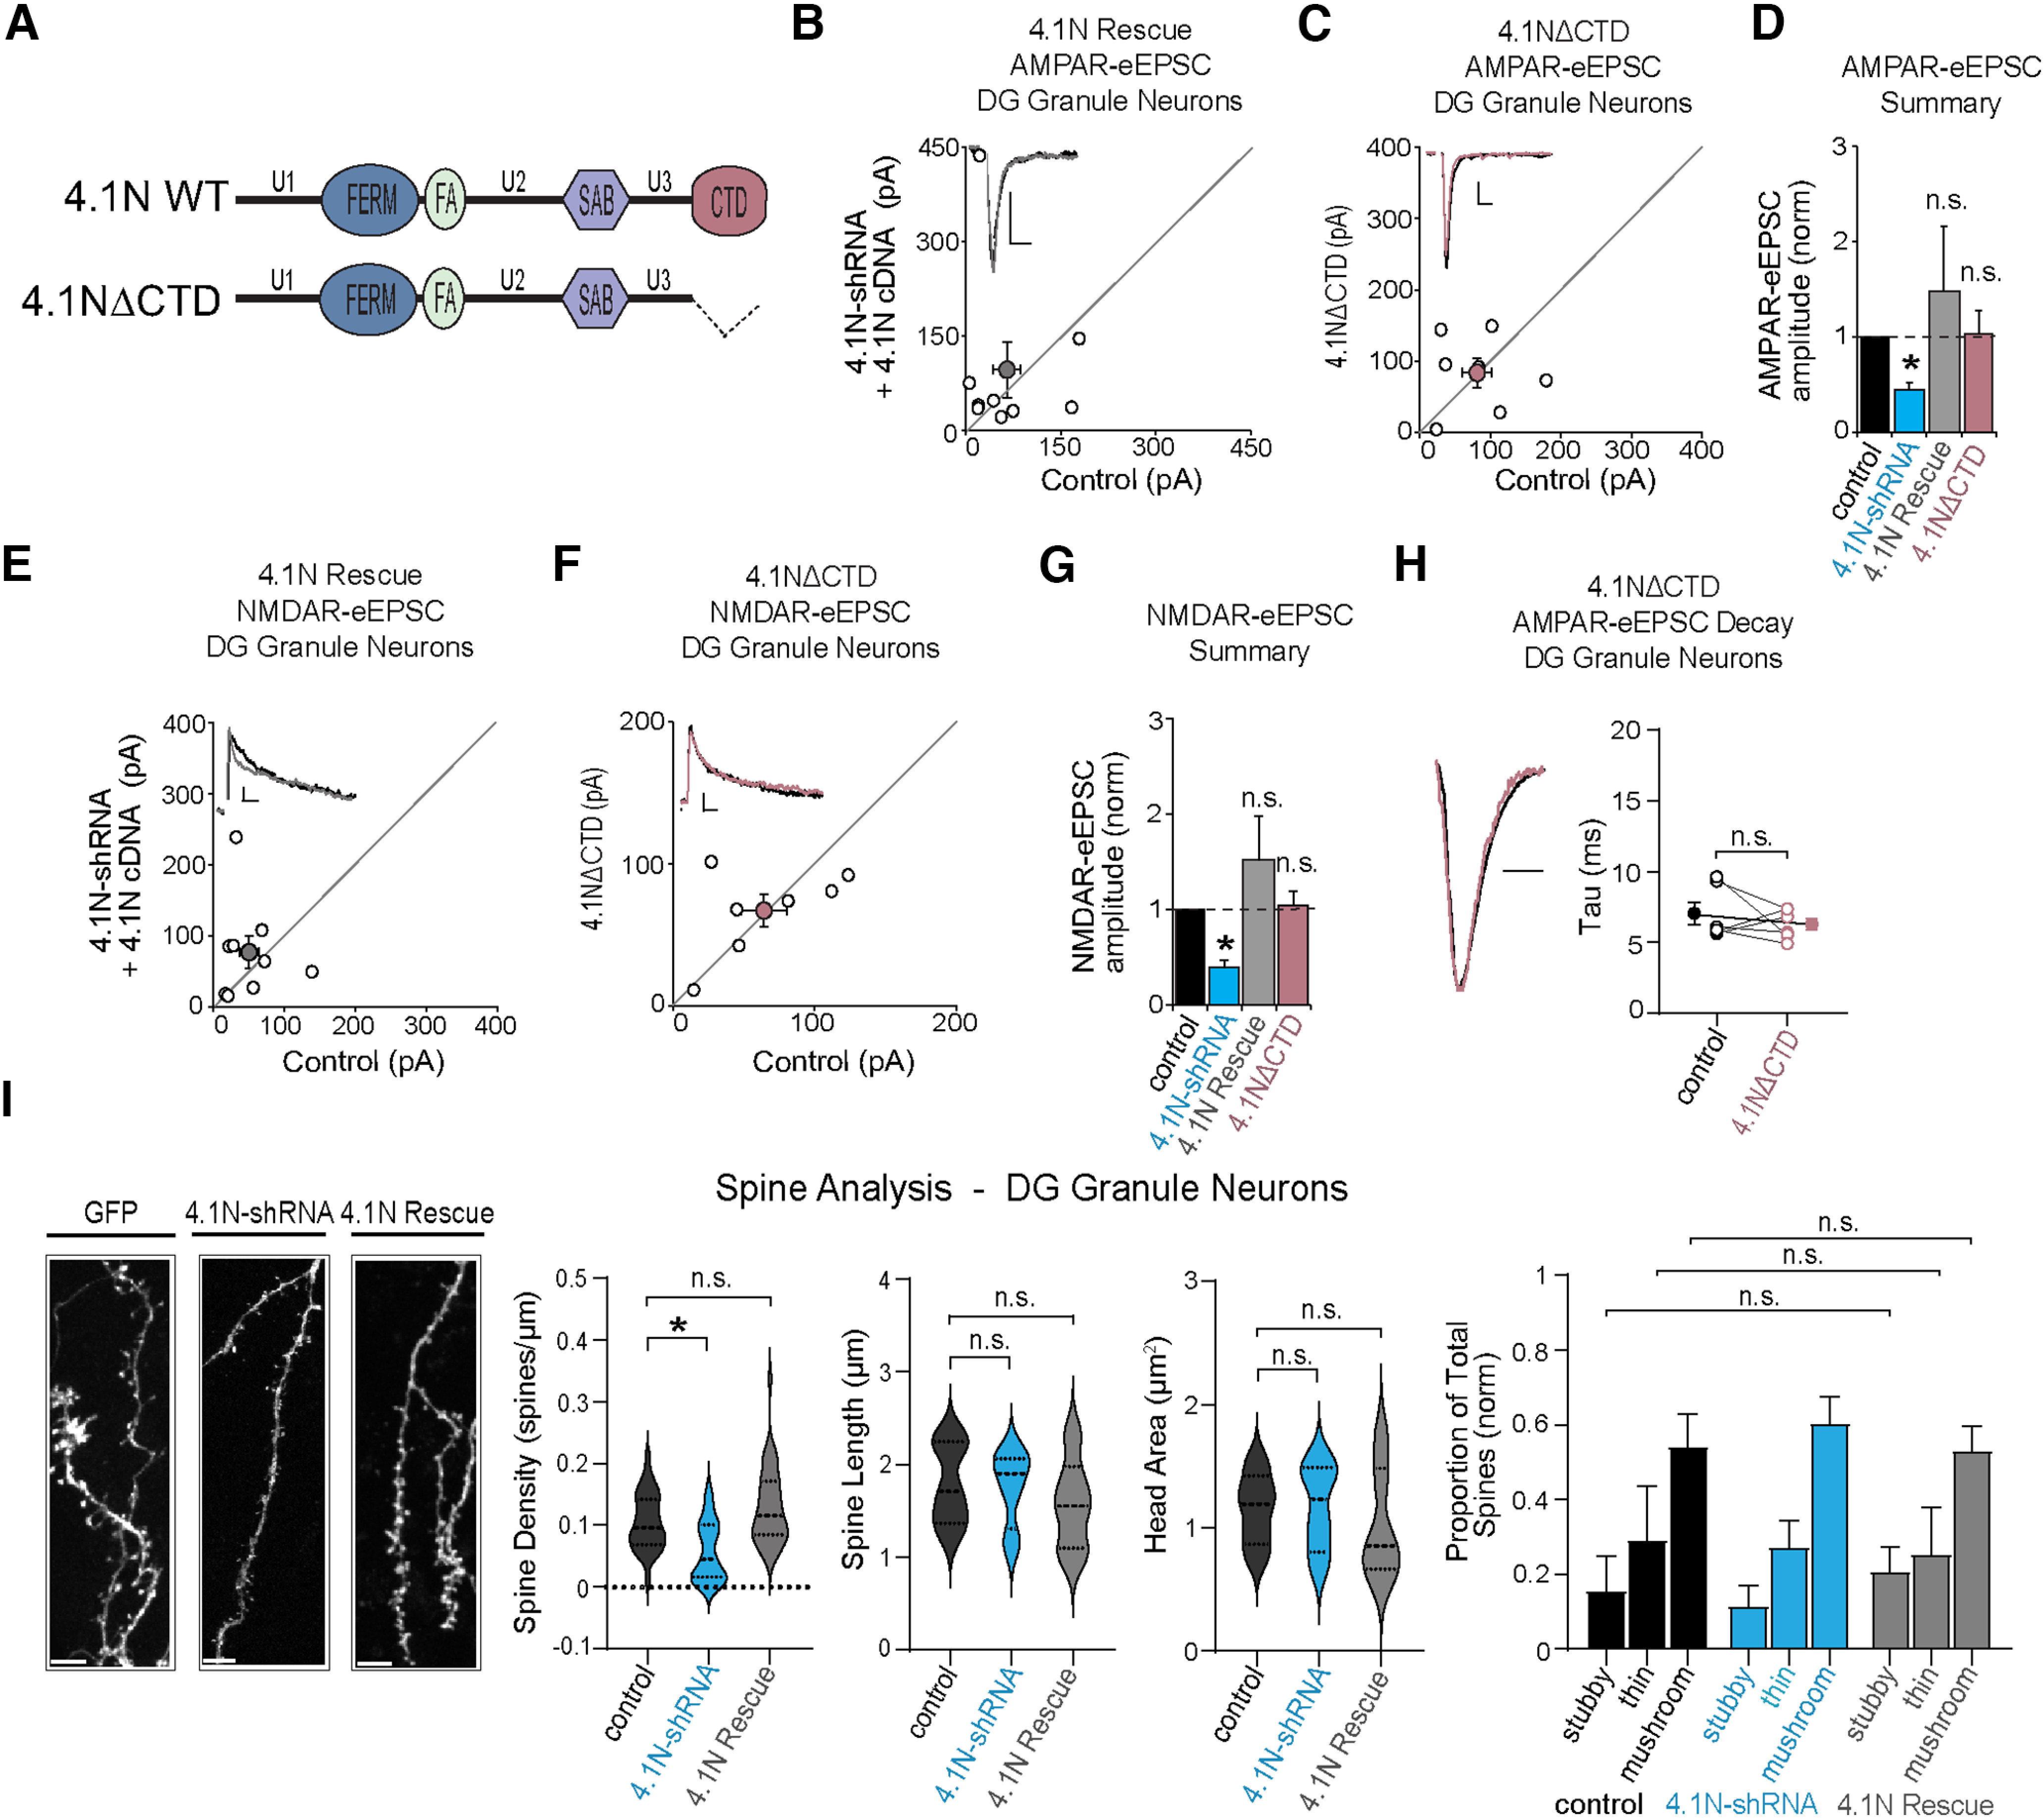
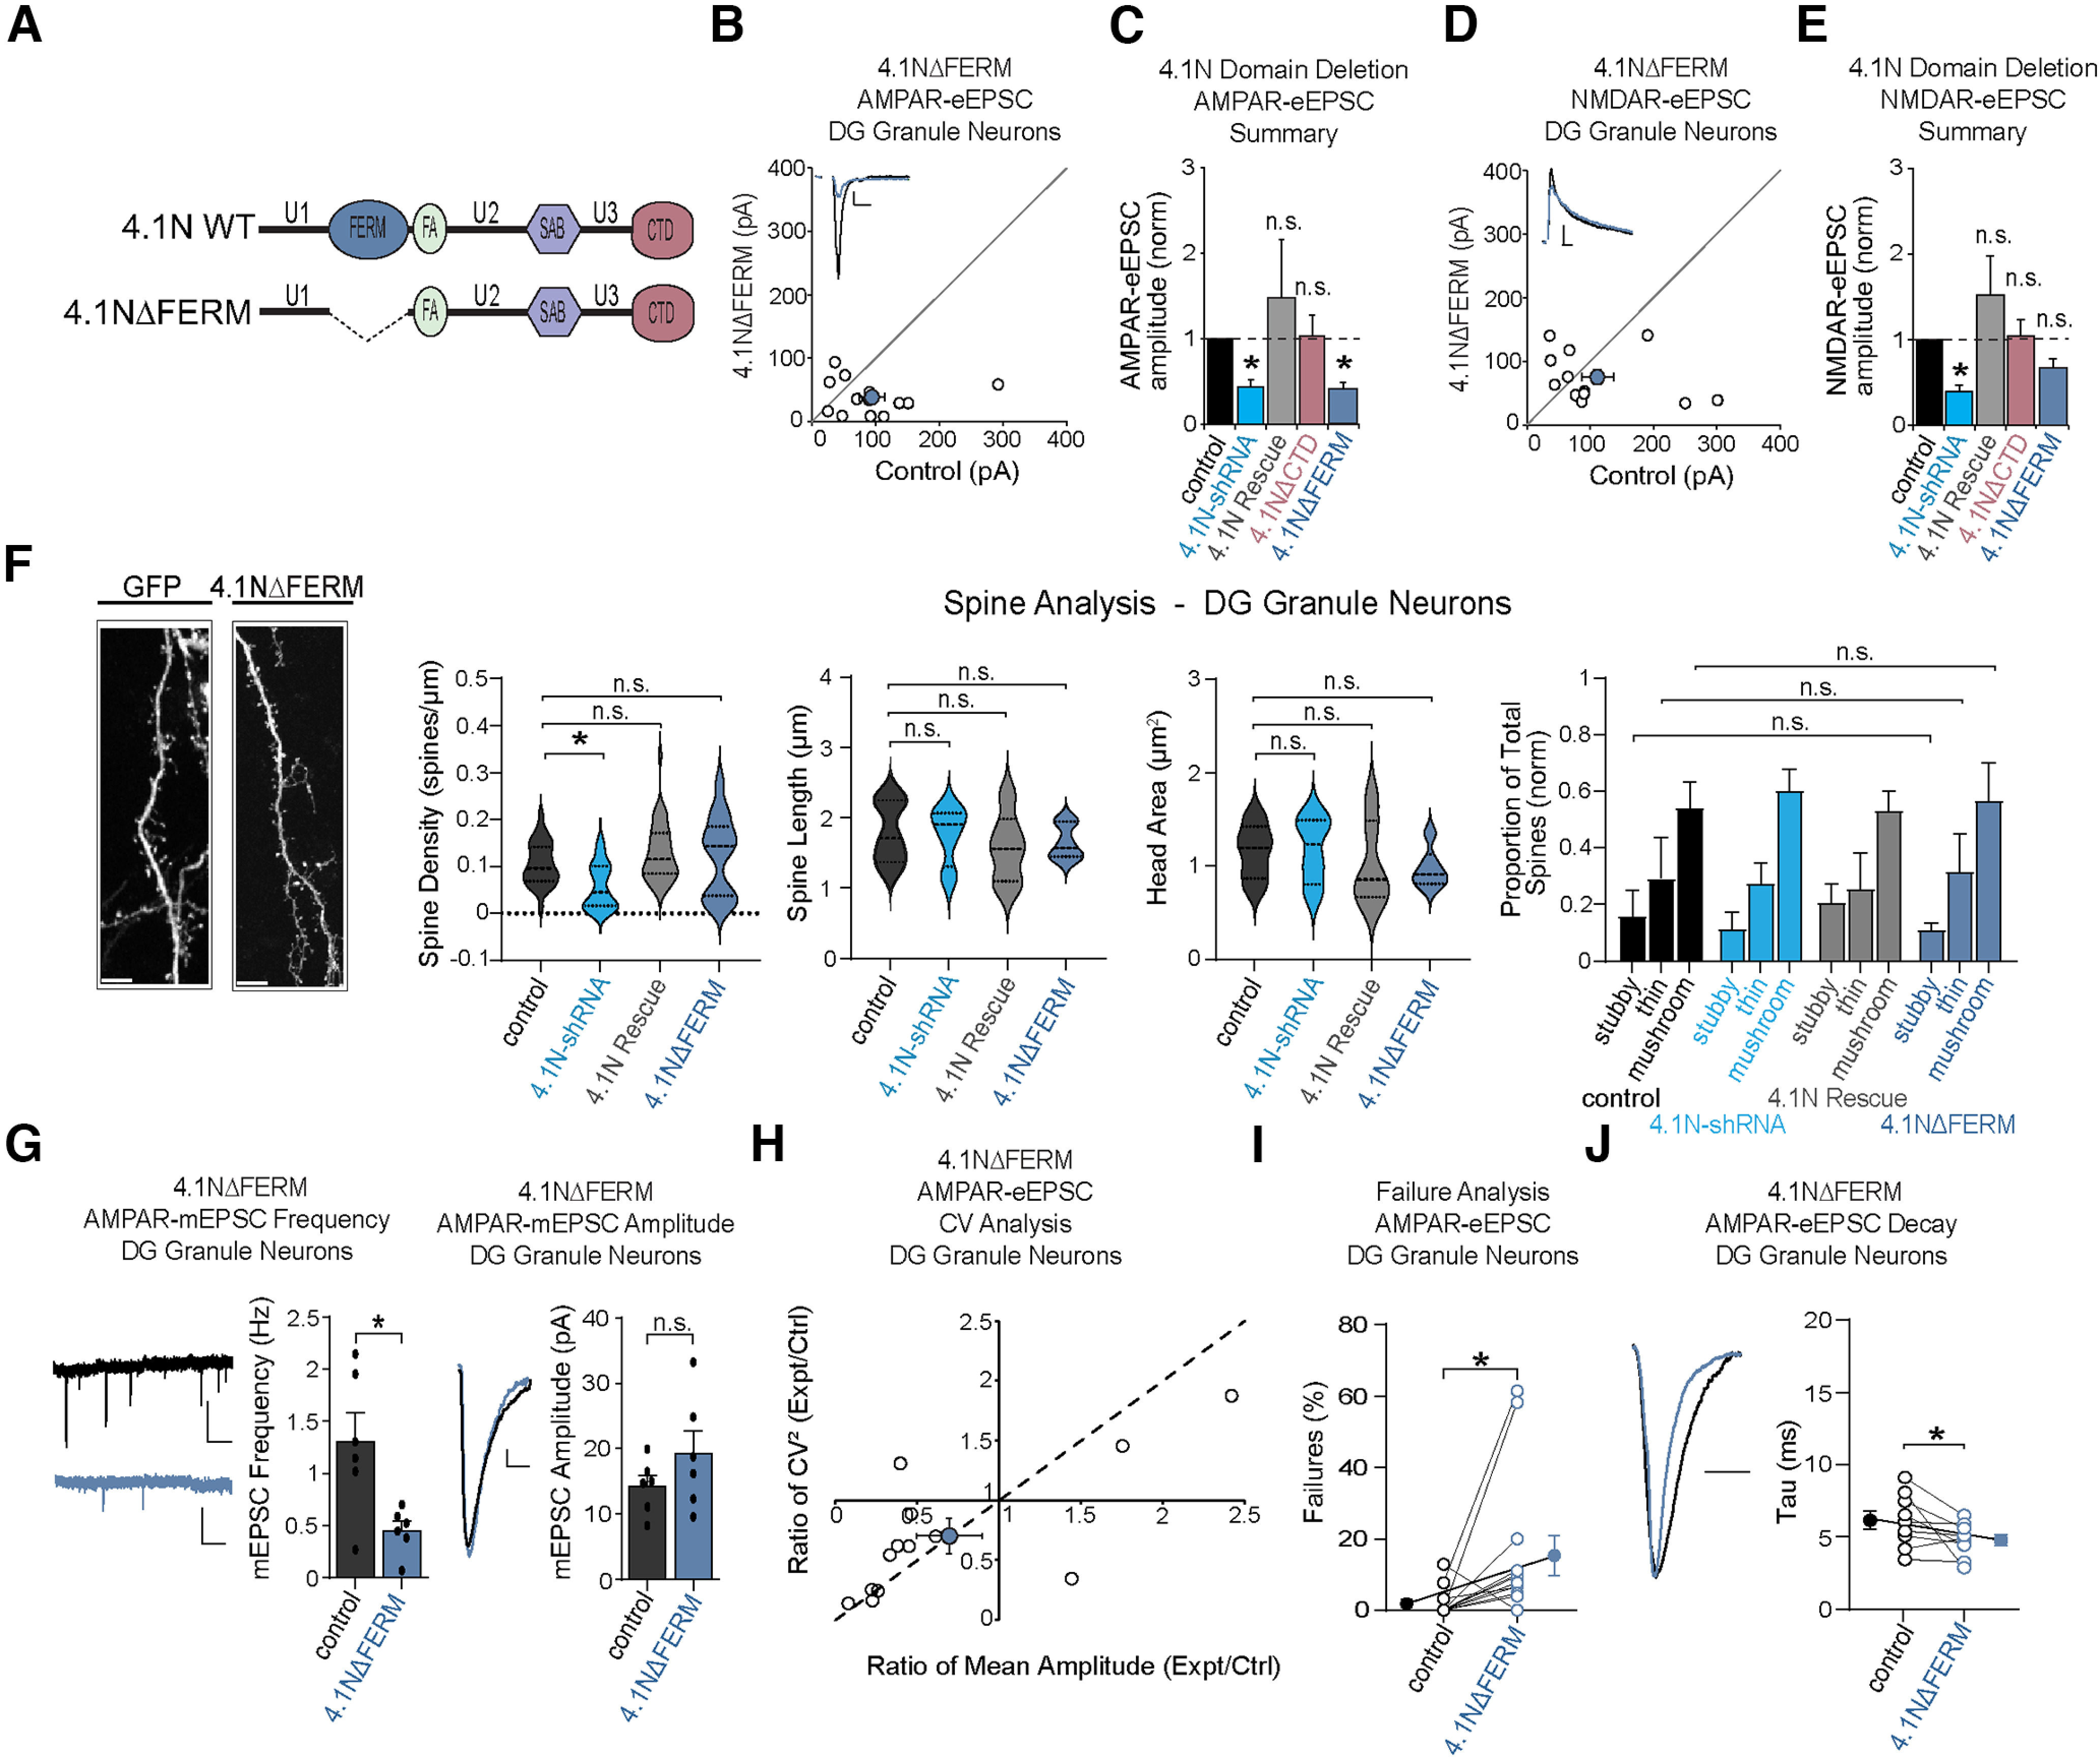
Many glutamatergic synapse proteins contain a 4.1N protein binding domain. However, a role for 4.1N in the regulation of glutamatergic neurotransmission has been controversial. Here, we observe significantly higher expression of protein 4.1N in granule neurons of the dentate gyrus (DG granule neurons) compared with other hippocampal regions. We discover that reducing 4.1N expression in rat DG granule neurons of either sex results in a significant reduction in glutamatergic synapse function that is caused by a decrease in the number of glutamatergic synapses. By contrast, we find reduction of 4.1N expression in hippocampal CA1 pyramidal neurons has no impact on basal glutamatergic neurotransmission. We also find 4.1N's C-terminal domain (CTD) to be nonessential to its role in the regulation of glutamatergic synapses of DG granule neurons. Instead, we show that 4.1N's four-point-one, ezrin, radixin, and moesin (FERM) domain is essential for supporting synaptic AMPA receptor (AMPAR) function in these neurons. Altogether, this work demonstrates a novel, cell type-specific role for protein 4.1N in governing glutamatergic synapse function.SIGNIFICANCE STATEMENT Glutamatergic synapses exhibit immense molecular diversity. In comparison to heavily studied Schaffer collateral, CA1 glutamatergic synapses, significantly less is known about perforant path-dentate gyrus (DG) synapses. Our data demonstrate that compromising 4.1N function in CA1 pyramidal neurons produces no alteration in basal glutamatergic synaptic transmission. However, in DG granule neurons, compromising 4.1N function leads to a significant decrease in the strength of glutamatergic neurotransmission at perforant pathway synapses. Together, our data identifies 4.1N as a cell type-specific regulator of synaptic transmission within the hippocampus and reveals a unique molecular program that governs perforant pathway synapse function.

Keywords: 4.1N; AMPA receptor; dendritic spines; dentate gyrus; synapse.


Figures

Figure 1.
Figure 1.
Protein 4.1N is required for glutamatergic synapse structure and function in DG granule neurons. A, Representative immunolabeling showing enrichment of protein 4.1N in the molecular layer of the DG in a rat hippocampal slice. Blue box shows enlarged DG region. GL: granule layer, ML: molecular layer. B, Western blotting showing shRNA-mediated reduction of 4.1N protein in dissociated hippocampal neurons. C, Schematic representation of electrophysiological recording setup for DG granule neurons. D, Knocking down 4.1N significantly decreases both AMPAR-eEPSC (n = 11 pairs) and (E) NMDAR-eEPSC amplitudes (n = 10 pairs) in DG granule neurons. D, E, Scatterplots show eEPSC amplitudes for pairs of untransfected and transfected cells (open circles) with corresponding mean ± SEM (filled circles). Insets show representative current traces from control and transfected (blue) neurons with stimulation artifacts removed. Scale bars: 20 ms, 20 pA for both AMPAR-eEPSCs and NMDAR-eEPSCs. Bar graphs show the average AMPAR-eEPSC and NMDAR-eEPSC amplitudes (±SEM) of DG granule neurons expressing the 4.1N-shRNA (blue) normalized to their respective control cell average eEPSC amplitudes (black). F, Paired-pulse facilitation (PPF) ratios (mean ± SEM) for 4.1N-shRNA-expressing DG granule neurons and paired control neurons show no detectable differences in facilitation at a variety of interstimulus intervals (ISIs; n = 6 pairs, ISI: 20, 40, 70, and 100 ms). Peak 2-scaled current traces from control (black) and transfected (blue) neurons. Scale bars: 20 ms. G, 4.1N-shRNA-expressing DG granule neurons have significantly lower dendritic spine density in comparison to GFP-expressing control neurons. Leftmost images display representative dendritic segments of GFP-expressing (left) and 4.1N-shRNA-expressing (right) DG granule neurons. Scale bars: 10 µm. Violin plots show a significant difference in the spine density of DG granule neurons expressing the 4.1N-shRNA when compared with GFP-expressing control neurons (GFP: n = 31 segments, 4.1N-shRNA: n = 37 segments), but no differences in total spine length or head area. Bar graph (right) shows no changes to the proportion of spine types between 4.1N-shRNA-expressing neurons compared with GFP-expressing control neurons (GFP: n = 5 cells, 4.1N-shRNA: n = 4 cells). H, AMPAR-mEPSC analysis reveals a significant reduction in the frequency, but not the amplitude, of AMPAR-mEPSCs in 4.1N-shRNA-expressing DG granule neurons compared with control DG granule neurons (control: n = 6 cells, 4.1N-shRNA: n = 6 cells). Bar graphs show the averaged frequency and amplitude of AMPAR-mEPSC events ± SEM, with each point representing the averaged value from one neuron. Leftmost panel shows sample traces of control AMPAR-mEPSC events (black/top), compared with 4.1N-shRNA AMPAR-mEPSC events (blue/bottom). Scale bars: 1 s, 20 pA. Left of the amplitude bar graph displays an averaged representative trace from a control (black) and transfected (blue) neuron. Scale bars: 5 ms, 5 pA. I, Paired scatterplot shows no differences in decay kinetics between averaged AMPAR-eEPSCs from 4.1N-shRNA-expressing and control DG granule neurons (n = 9 pairs). Inset shows peak-normalized sample traces from control (black) and transfected (blue) neurons. Scale bar: 10 ms. *p < 0.05; n.s., not significant.
Figure 2.
Figure 2.
Protein 4.1N is not required for glutamatergic neurotransmission in CA1 pyramidal neurons. A, Representative immunolabeling showing minimal 4.1N expression in the CA1 region of a rat hippocampal slice. Blue box shows enlarged CA1 region. SO: stratum oriens, SP: stratum pyramidale, SR: stratum radiatum. Orange box shows enlarged DG region. GL: granule layer, ML: molecular layer. B, Schematic representation of electrophysiological recording setup for CA1 pyramidal neurons. C, Knock-down of 4.1N in CA1 pyramidal neurons does not significantly affect AMPAR-eEPSC (n = 8 pairs) or (D) NMDAR-eEPSC amplitude (n = 8 pairs). C, D, Scatterplots show eEPSC amplitudes for pairs of untransfected and transfected cells (open circles) with corresponding mean ± SEM (filled circles). Insets show representative current traces from control (black) and transfected (blue) neurons with stimulation artifacts removed. Scale bars: 20 ms, 20 pA for AMPAR-eEPSCs; 50 ms, 50 pA for NMDAR-eEPSCs. Bar graphs show the average AMPAR-eEPSC and NMDAR-eEPSC amplitudes (±SEM) of CA1 pyramidal neurons expressing the 4.1N-shRNA (blue) normalized to their respective control cell average eEPSC amplitudes (black). E, Paired-pulse facilitation ratios (mean ± SEM) for 4.1N-shRNA-expressing CA1 pyramidal neurons and paired control neurons show no detectable differences in facilitation at a variety of interstimulus intervals (n = 6 pairs, ISIs: 20, 40, 70, and 100 ms). Peak 2- scaled current traces from control (black) and transfected (blue) neurons. Scale bars: 20 ms. F, Paired scatterplot shows no differences in decay kinetics between averaged AMPAR-eEPSCs from 4.1N-shRNA-expressing and paired control neurons (n = 7 pairs). Inset shows peak-normalized sample traces from control (black) and transfected (blue) neurons. Scale bar: 10 ms; n.s., not significant.
Figure 3.
Figure 3.
Protein 4.1N's C-Terminal domain is not required for glutamatergic synapse function in DG granule neurons. A, Schematic depicting the domain structure of full length 4.1N protein, followed by the domain structure of 4.1NΔCTD. B, Molecular replacement of endogenous 4.1N with shRNA-resistant 4.1N cDNA (4.1N Rescue) rescues both AMPAR-eEPSC (n = 9 pairs) and (E) NMDAR-eEPSC amplitudes (n = 9 pairs) in DG granule neurons. Molecular replacement of endogenous 4.1N with 4.1NΔCTD also rescues both (C) AMPAR-eEPSC (n = 7 pairs) and (F) NMDAR-eEPSC amplitudes (n = 7 pairs) in DG granule neurons. B, C, E, F, Scatterplots show eEPSC amplitudes for pairs of untransfected and transfected cells (open circles) with corresponding mean ± SEM (filled circles). Insets show representative current traces from control (black) and transfected (4.1N Rescue: gray, 4.1NΔCTD: red) neurons with stimulation artifacts removed. Scale bars: 20 ms, 20 pA for both AMPAR-eEPSCs; 50 ms, 20 pA for 4.1N Rescue NMDAR-eEPSCs; 20 ms, 50 pA for 4.1NΔCTD NMDAR-eEPSCs. D, G, Bar graphs show the average AMPAR-eEPSC and NMDAR-eEPSC amplitudes (±SEM) of DG granule neurons co-expressing: 4.1N-shRNA and 4.1N-shRNA-resistant cDNA (gray) or 4.1N-shRNA and 4.1NΔCTD (red) normalized to their respective control cell average eEPSC amplitudes (black). H, Paired scatterplot shows no differences in the decay kinetics of averaged AMPAR-eEPSCs from 4.1NΔCTD-expressing compared with control DG granule neurons (n = 6 pairs). Inset shows peak-normalized sample traces from control (black) and transfected (red) neurons. Scale bar: 10 ms. I, Co-transfection of DG granule neurons with 4.1N-shRNA and 4.1N-shRNA-resistant cDNA (4.1N Rescue) rescues the 4.1N-shRNA-mediated reduction in dendritic spine density. Leftmost images display representative dendritic segments of GFP-expressing (left), 4.1N-shRNA-expressing (middle), and 4.1N Rescue-expressing (right) DG granule neurons. Scale bars: 10 µm. Violin plots show no significant differences in dendritic spine density, spine length, or head area in DG granule neurons co-expressing the 4.1N-shRNA with 4.1N-shRNA-resistant cDNA when compared with GFP-expressing control neurons (GFP: n = 31 segments, 4.1N Rescue: n = 48 segments). Bar graph (right) shows no significant differences in proportion of spine types between neurons co-expressing 4.1N-shRNA and 4.1N-shRNA-resistant cDNA compared with GFP-expressing control neurons (GFP: n = 5 cells, 4.1N Rescue: n = 6 cells). *p < 0.05; n.s., not significant.
Figure 4.
Figure 4.
Protein 4.1N's FERM domain is required for maintaining synaptic AMPA receptor function in DG granule neurons. A, Schematic depicting the domain structure of 4.1NΔFERM. Molecular replacement of endogenous 4.1N with 4.1NΔFERM rescues (D) NMDAR-eEPSC (n = 12 pairs) but fails to rescue (B) AMPAR-eEPSC amplitudes (n = 13 pairs) in DG granule neurons. B, D, Scatterplots show eEPSC amplitudes for pairs of untransfected and transfected cells (open circles) with corresponding mean ± SEM (filled circles). Insets show representative current traces from control (black) and transfected (deep blue) neurons with stimulation artifacts removed. Scale bars: 20 ms, 20 pA for AMPAR-eEPSCs; 50 ms, 50 pA for NMDAR-eEPSCs. C, E, Bar graphs show the average AMPAR-eEPSC and NMDAR-eEPSC amplitudes (±SEM) of DG granule neurons co-expressing 4.1N-shRNA and 4.1NΔFERM (deep blue) normalized to their respective control cell average eEPSC amplitudes (black). F, Molecular replacement of endogenous 4.1N with 4.1NΔFERM rescues the 4.1N-shRNA-mediated reduction in dendritic spine density. Representative dendritic segment of GFP-expressing (left) and 4.1N-shRNA + 4.1NΔFERM-expressing (right) DG granule neurons. Scale bars: 10 µm. Violin plots show no significant differences in dendritic spine density, spine length, or head area in DG granule neurons co-expressing the 4.1N-shRNA with 4.1NΔFERM in comparison to GFP-expressing control neurons (GFP: n = 31 segments, 4.1NΔFERM: n = 31 segments). Bar graph (right) shows no significant differences in proportion of spine types between neurons co-expressing 4.1N-shRNA and 4.1NΔFERM compared with GFP-expressing control neurons (GFP: n = 5 cells, 4.1NΔFERM construct: n = 6 cells). G, AMPAR-mEPSC analysis reveals a significant reduction in the frequency, but not the amplitude, of AMPAR-mEPSCs in 4.1NΔFERM-expressing DG granule neurons compared with control DG granule neurons (control: n = 6 cells, 4.1NΔFERM: n = 6 cells). Bar graphs show the averaged frequency and amplitude of AMPAR-mEPSCs ± SEM, with each point representing the averaged value of one neuron. Leftmost panel shows sample traces of control AMPAR-mEPSC events (black/top), compared with 4.1NΔFERM AMPAR-mEPSC events (deep blue/bottom). Scale bars: 500 ms, 20 pA. Left of the amplitude bar graph displays an averaged representative trace from a control (black) and transfected (deep blue) neuron. Scale bars: 5 ms, 2 pA. H, Coefficient of variation analysis of AMPAR-eEPSCs from pairs of control and 4.1NΔFERM-expressing DG granule neurons. Coefficient of variation analysis reveals the reduction in AMPAR-eEPSC amplitude caused by the loss of the FERM domain is because of a reduction in quantal content (n = 13 pairs). CV−2 values are plotted against corresponding ratios of mean amplitudes within each pair (open circles) with mean ± SEM (filled circle). I, Failure analysis of AMPAR-eEPSCs reveals that 4.1NΔFERM-expressing DG granule neurons exhibit significantly higher rates of failure compared with control DG granule neurons (n = 13 pairs). J, Paired scatterplot shows a significant speeding in the decay kinetics of 4.1NΔFERM AMPAR-eEPSCs when compared with control DG granule neurons (n = 9 pairs). Inset shows peak-normalized sample traces from control (black) and transfected (deep blue) neurons. Scale bar: 10 ms. *p < 0.05; n.s., not significant.

Similar articles

References

    1. Baines AJ, Lu HC, Bennett PM (2014) The protein 4.1 family: hub proteins in animals for organizing membrane proteins. Biochim Biophys Acta 1838:605–619. 10.1016/j.bbamem.2013.05.030 - DOI - PubMed
    1. Bekkers JM, Stevens CF (1990) Presynaptic mechanism for long-term potentiation in the hippocampus. Nature 346:724–729. 10.1038/346724a0 - DOI - PubMed
    1. Biederer T, Südhof TC (2001) CASK and protein 4.1 support F-actin nucleation on neurexins. J Biol Chem 276:47869–47876. 10.1074/jbc.M105287200 - DOI - PubMed
    1. Bonnet C, Charpentier J, Retailleau N, Choquet D, Coussen F (2023) Regulation of different phases of AMPA receptor intracellular transport by 4.1N and SAP97. Elife 12:e85609. 10.7554/eLife.85609 - DOI - PMC - PubMed
    1. Bonnici B, Kapfhammer JP (2009) Modulators of signal transduction pathways can promote axonal regeneration in entorhino-hippocampal slice cultures. Eur J Pharmacol 612:35–40. 10.1016/j.ejphar.2009.04.007 - DOI - PubMed

Publication types

LinkOut - more resources