. 2023 Nov 22;43(47):8000-8017.
doi: 10.1523/JNEUROSCI.1473-23.2023.

A Neural Mechanism in the Human Orbitofrontal Cortex for Preferring High-Fat Foods Based on Oral Texture

Affiliations

A Neural Mechanism in the Human Orbitofrontal Cortex for Preferring High-Fat Foods Based on Oral Texture

Putu A Khorisantono et al. J Neurosci. .

Abstract

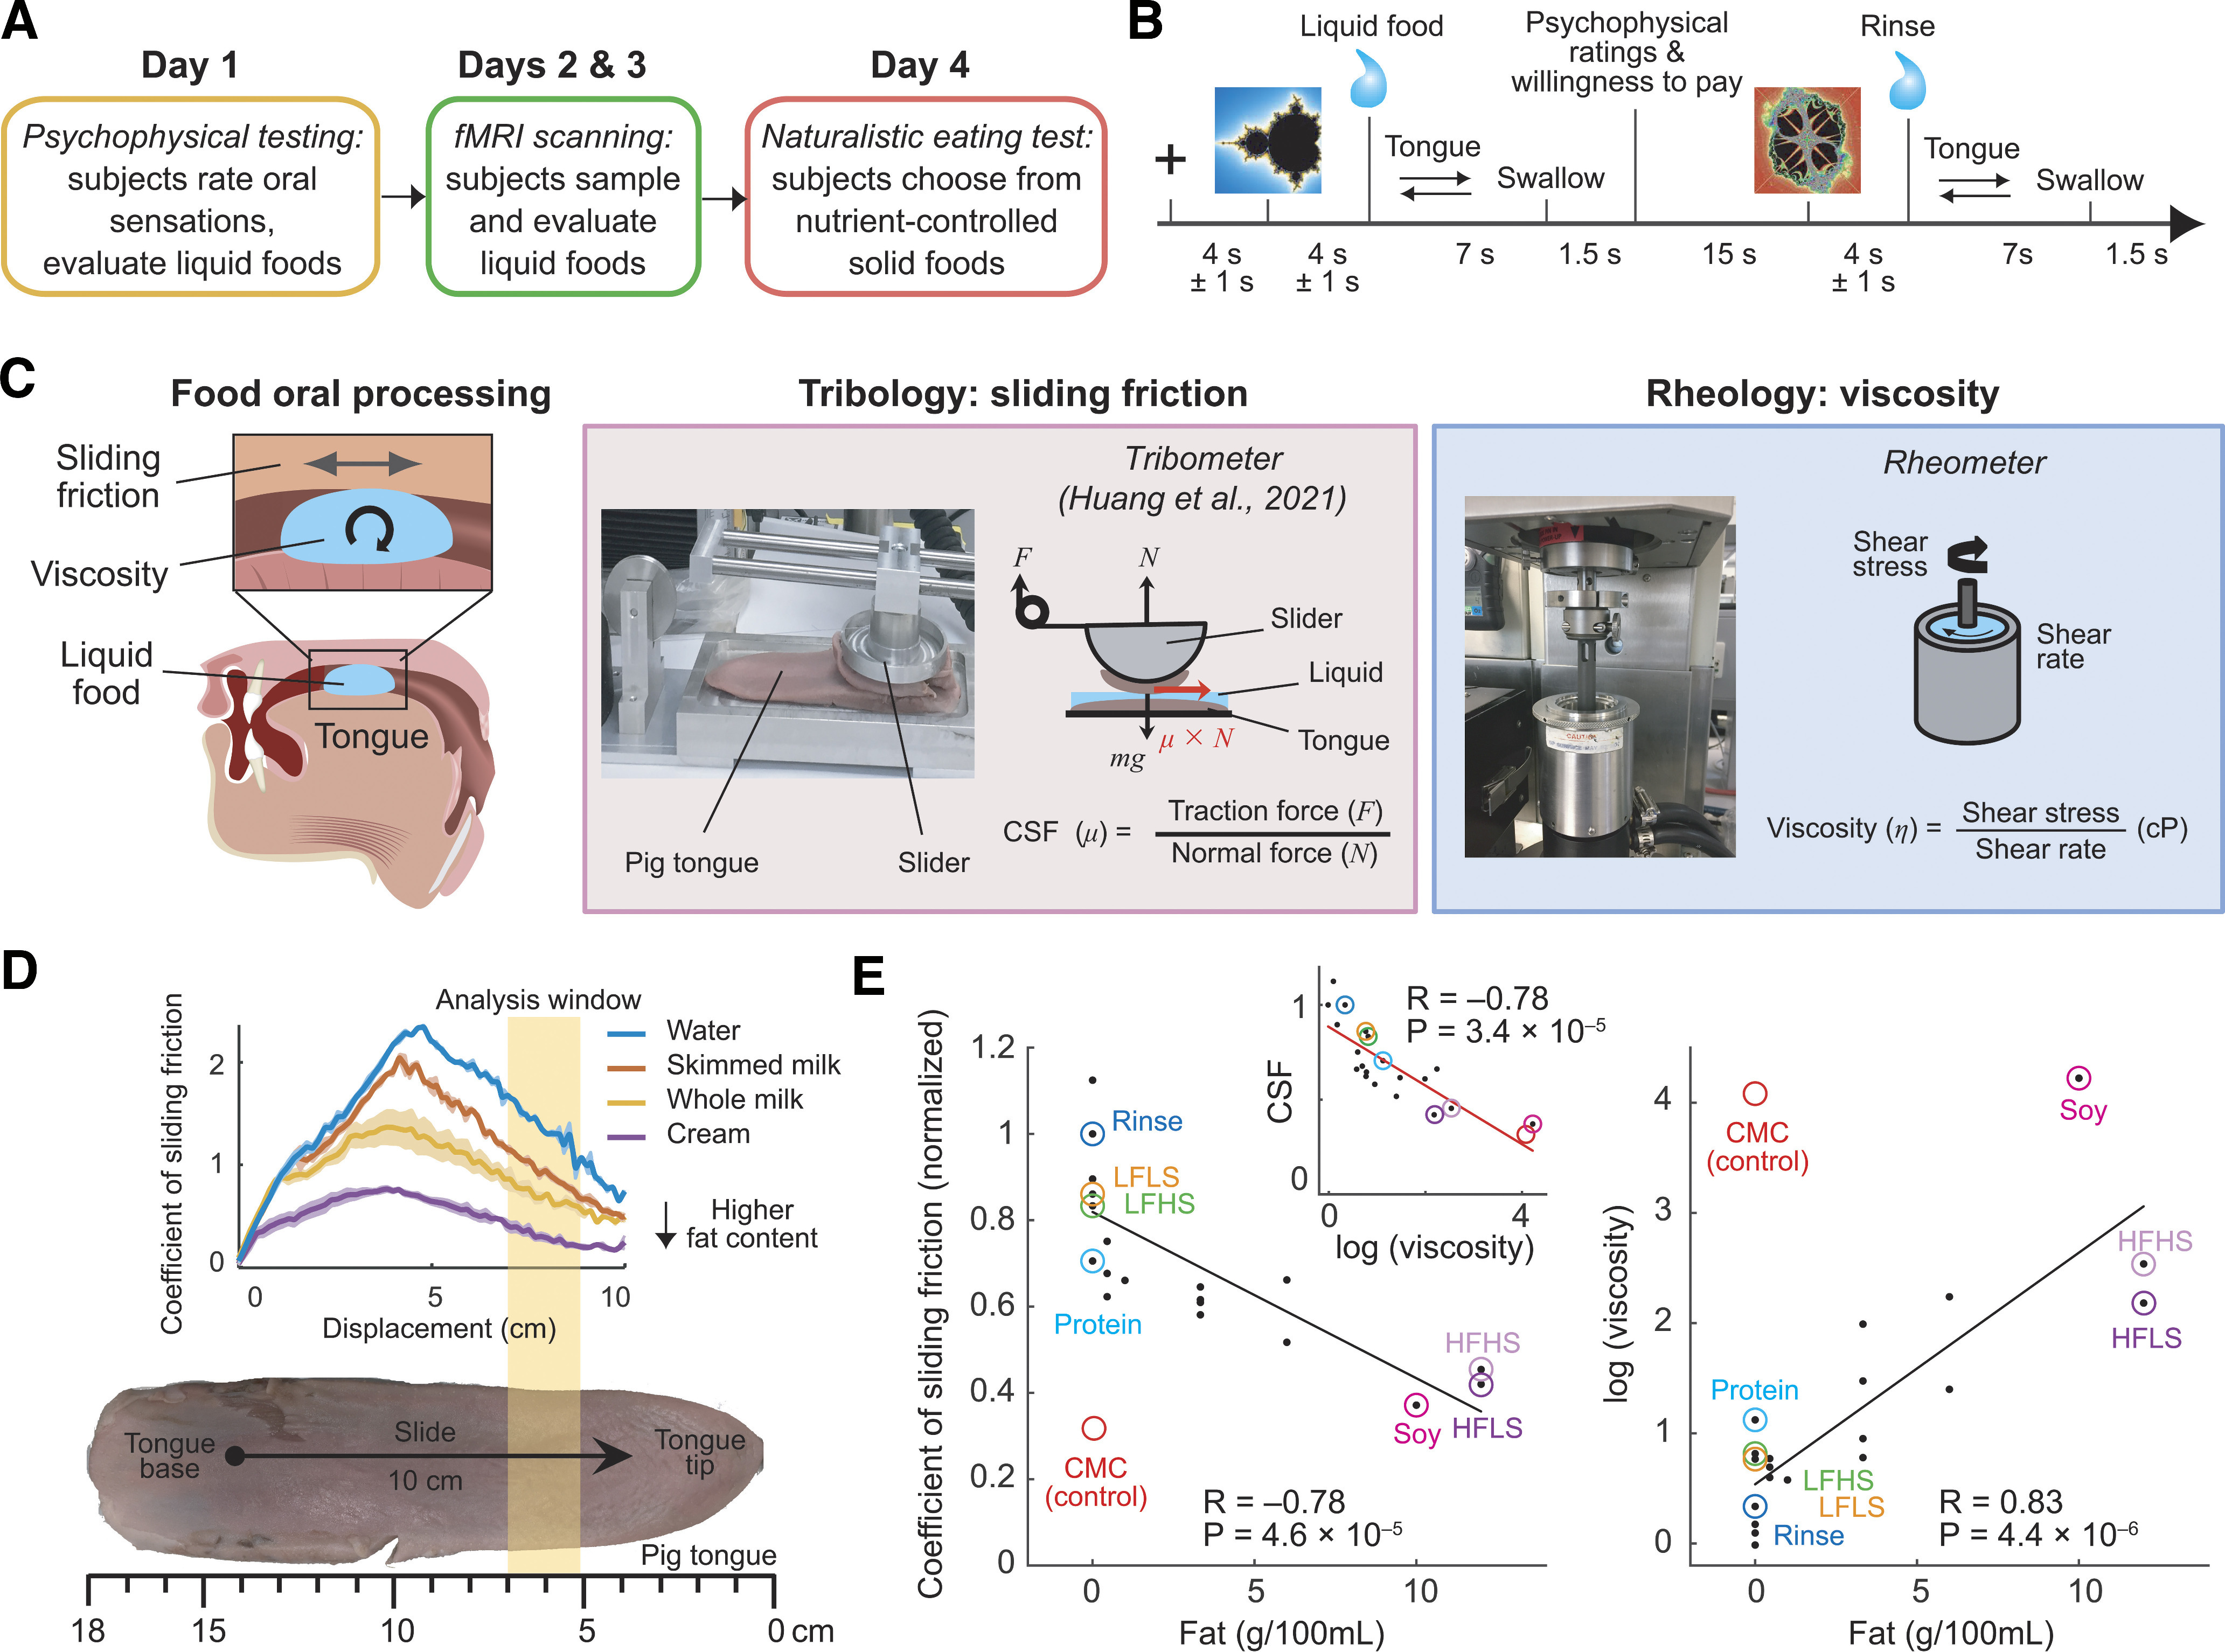
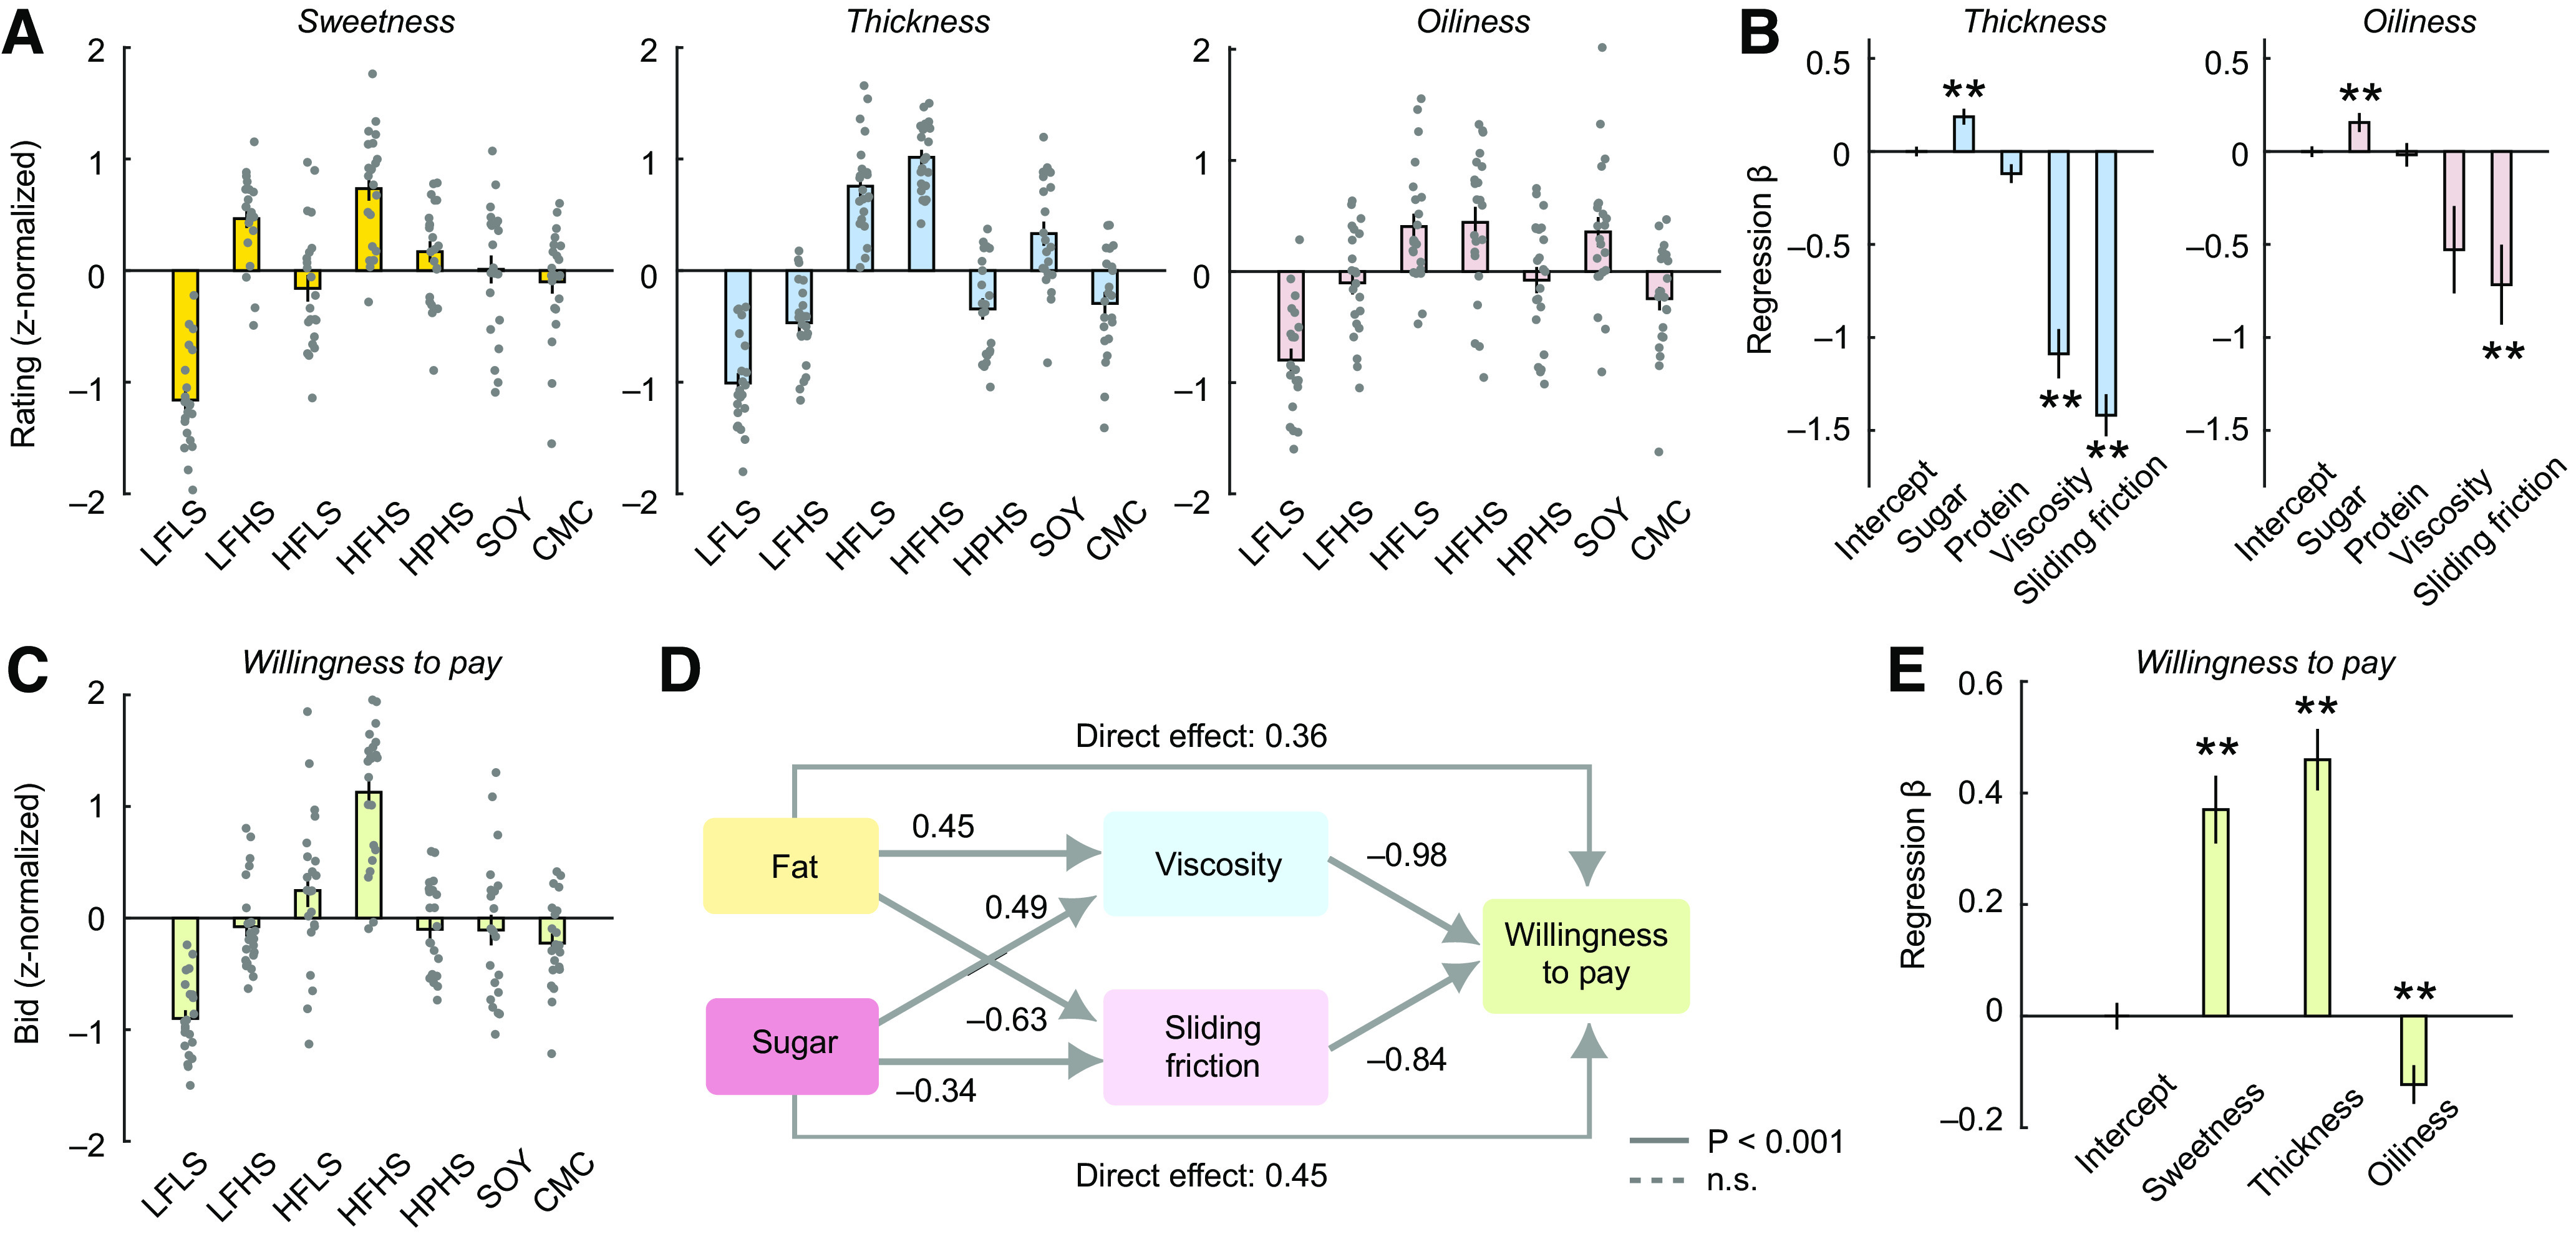
Although overconsumption of high-fat foods is a major driver of weight gain, the neural mechanisms that link the oral sensory properties of dietary fat to reward valuation and eating behavior remain unclear. Here we combine novel food-engineering approaches with functional neuroimaging to show that the human orbitofrontal cortex (OFC) translates oral sensations evoked by high-fat foods into subjective economic valuations that guide eating behavior. Male and female volunteers sampled and evaluated nutrient-controlled liquid foods that varied in fat and sugar ("milkshakes"). During oral food processing, OFC activity encoded a specific oral-sensory parameter that mediated the influence of the foods' fat content on reward value: the coefficient of sliding friction. Specifically, OFC responses to foods in the mouth reflected the smooth, oily texture (i.e., mouthfeel) produced by fatty liquids on oral surfaces. Distinct activity patterns in OFC encoded the economic values associated with particular foods, which reflected the subjective integration of sliding friction with other food properties (sugar, fat, viscosity). Critically, neural sensitivity of OFC to oral texture predicted individuals' fat preferences in a naturalistic eating test: individuals whose OFC was more sensitive to fat-related oral texture consumed more fat during ad libitum eating. Our findings suggest that reward systems of the human brain sense dietary fat from oral sliding friction, a mechanical food parameter that likely governs our daily eating experiences by mediating interactions between foods and oral surfaces. These findings identify a specific role for the human OFC in evaluating oral food textures to mediate preference for high-fat foods.SIGNIFICANCE STATEMENT Fat and sugar enhance the reward value of food by imparting a sweet taste and rich mouthfeel but also contribute to overeating and obesity. Here we used a novel food-engineering approach to realistically quantify the physical-mechanical properties of high-fat liquid foods on oral surfaces and used functional neuroimaging while volunteers sampled these foods and placed monetary bids to consume them. We found that a specific area of the brain's reward system, the orbitofrontal cortex, detects the smooth texture of fatty foods in the mouth and links these sensory inputs to economic valuations that guide eating behavior. These findings can inform the design of low-calorie fat-replacement foods that mimic the impact of dietary fat on oral surfaces and neural reward systems.

Keywords: dietary fat; neuroeconomics; oral food processing; preference; reward value.


Figures

Figure 1.
Figure 1.
Study design and oral-sensory measurements for experimental foods. A, Sequence of experiments in each participant. B, Trial structure for controlled sampling and oral processing of liquid foods in psychophysical and fMRI experiments. Liquid foods were delivered orally under computer control via peristaltic pumps. Subjects performed a pretrained left-right (or right-left, alternating randomly trial by trial) tongue movement guided by a visual cue to standardize oral processing. C, Sliding friction and viscosity as key texture variables in food oral processing. Left, Sliding friction results from oral-surface movements, with liquid foods acting as lubricant; viscosity is a “bulk” material food property. Middle, Custom tribometer measures the CSF of experimental liquid foods in a biologically realistic manner using sliding pig tongues. Right, Rotational rheometer measures the viscosity of liquid foods. D, Validation of tribological measures of sliding friction in a series of basic fat-containing liquids. CSF reflects liquids' fat content. E, Linear regression of CSF and viscosity on fat content in a large set of experimental liquid foods. Colored foods were used in the present experiments. Inset, Relationship between CSF and viscosity. HPHS, Low-fat, high-sugar, high-protein; Soy, soy-based HFHS; CMC, low-fat, high-sugar thickened with carboxymethyl cellulose. CMC represents a nonfat artificially thickened control stimulus that was excluded from the regression.
Figure 2.
Figure 2.
Psychophysical ratings and economic WTP bids for experimental foods. A, Ratings of sweetness, thickness, and oiliness sensations for all stimuli. Error bars indicate mean ± SEM. Data points show individual subjects. HPHS, Low-fat, high-sugar, high-protein; SOY, soy-based HFHS; CMC, low-fat, high-sugar thickened with carboxymethyl cellulose. B, Thickness and oiliness ratings are explained by a combination of oral-texture variables viscosity and sliding friction (mixed-effects multilinear regression, subjects as random factor). **p < 0.005, Bonferroni-corrected. C, WTP bids, obtained in an incentive-compatible Becker-DeGroot-Marschak auction-like task as a measure of subjects' economic food valuations. D, Mediation analysis. Path diagram describing relationships between nutrient content, texture parameters, and WTP bids (mixed-effects multilinear regression). The influence of fat and sugar content on WTP bids was decomposed into indirect effects mediated by texture variables viscosity and sliding friction and direct effects. Significance of path coefficients derived from bootstrap (1000 iterations). Protein effects were included in the model but were not significant and are not shown. E, WTP depended on oral sensations of sweetness, thickness, and oiliness (mixed-effects multilinear regression; **p < 0.005).
Figure 3.
Figure 3.
Neural encoding of specific oral-sensory food properties. A, Activity pattern across voxels in OFC reflected sliding friction of liquid foods (MNI coordinates: [36, 42, −16]; z = 4.08; p = 0.012; small-volume corrected) and activity patterns across voxels in oSSC reflected viscosity (MNI coordinates: [54, −10, 22]; z = 4.34; p < 0.001, whole-brain corrected). Shown are decoding-accuracy maps derived from whole-brain searchlight analyses that used SVM regression to decode each texture variable from multivoxel activity patterns in a 9 mm sphere. Maps are shown at p = 0.001 with extent threshold of 15 voxels. B, ROI regression of OFC cluster activity on sliding friction (t(21) = 2.11, p = 0.046; one-sample t test across subject-specific regression betas) and viscosity (not significant). Activity timeseries was extracted from coordinates identified in a previous study. Yellow shaded region represents the period in which the regression was significant; absence of yellow shaded region represents that the regression was not significant. C, ROI regression of oSSC cluster activity on viscosity (t(21) = 2.30, p = 0.031; one-sample t test) and sliding friction (not significant). Activity timeseries was extracted from coordinates identified in a previous study. D, OFC activity patterns encoded both sliding friction and oiliness in a conjunction analysis (MNI coordinates: [36, 42, −18]; z = 3.68; p = 0.002, whole-brain corrected). E, oSSC activity patterns encoded both viscosity and thickness in a conjunction analysis (MNI coordinates: [58, −12, 16]; z = 3.76; p = 0.021, whole-brain corrected).
Figure 4.
Figure 4.
Neural encoding of economic food values and related oral-sensory properties. A, Activity pattern in OFC reflected subjective, economic food reward values, measured as WTP bids during oral processing of liquid foods (MNI coordinates: [38, 40, −14]; z = 3.83; p = 0.010, small-volume corrected). Decoding-accuracy maps derived from whole-brain searchlight analysis using SVM regression to decode WTP from multivoxel activity patterns in a 9 mm sphere. Maps are shown at p = 0.001 with extent threshold of 15 voxels. B, OFC activity patterns during oral processing encoded sliding friction, oiliness, and WTP in a three-way conjunction analysis (MNI coordinates: [36, 42, −14]; z = 3.74; p = 0.002, small-volume corrected). The OFC was the only brain area to show a significant three-way conjunction (right, transparent brain map). C, OFC encoding of sliding friction remained significant when performing the decoding on CSF residuals, after regressing out variance components because of WTP bids ([36, 42, −14]; z = 3.99; p = 0.010), small-volume corrected). D, Neural decoding accuracies for sliding friction and WTP in OFC were uncorrelated. E, Activity patterns in pgACC encoded WTP only after oral processing before subjects placed their bids (MNI coordinates: [−2, 44, 16]; z = 3.73; p = 0.004, whole-brain corrected). F, Time-resolved decoding of WTP bids in OFC and pgACC. Decoding accuracy betas obtained from a finite impulse response analysis performed in 2 s bins. The OFC β was significant in bin 3 (t(21) = 2.60, p = 0.016); the pgACC β was significant in bin 5 (t(21) = 3.05, p = 0.006).
Figure 5.
Figure 5.
Neural encoding of oral-sensory food properties in OFC predicts preferences in a naturalistic eating test. A, Design of food stimuli. Subjects could freely and repeatedly choose between three nutrient-controlled curry meals in an ad libitum eating test. B, Variation in preference (consumed amounts) for different foods across subjects. C, Modeling fat preference in the eating test from OFC neural texture sensitivity measured in the MRI scanner. We fitted a multilinear regression model with the neural sensitivity of OFC to CSF and viscosity, as well as subjects' BMI, to the amount of fat eaten in the ad libitum test. Neural betas were extracted from decoding-accuracy maps using independently determined OFC peak coordinates from a leave-one-subject-out cross-validation procedure (see Materials and Methods). The model provided a significant fit to the amount of fat eaten in the eating test (F(3,16) = 4.57, full model p = 0.017) with both neural texture sensitivities contributing significantly (CSF regressor: p = 0.026; viscosity regressor: p = 0.027; BMI regressor: p = 0.264). D, Relationship between the amount of fat eaten as predicted by the model based on OFC texture sensitivity and the actual amount of fat consumed by the subjects during the eating test.

Similar articles

Cited by

References

    1. Alonso-Alonso M, Woods SC, Pelchat M, Grigson PS, Stice E, Farooqi S, Khoo CS, Mattes RD, Beauchamp GK (2015) Food reward system: current perspectives and future research needs. Nutr Rev 73:296–307. 10.1093/nutrit/nuv002 - DOI - PMC - PubMed
    1. Avery JA, Liu AG, Ingeholm JE, Riddell CD, Gotts SJ, Martin A (2020) Taste quality representation in the human brain. J Neurosci 40:1042–1052. 10.1523/JNEUROSCI.1751-19.2019 - DOI - PMC - PubMed
    1. Avery JA, Liu AG, Ingeholm JE, Gotts SJ, Martin A (2021) Viewing images of foods evokes taste quality-specific activity in gustatory insular cortex. Proc Natl Acad Sci USA 118:e2010932118. 10.1073/pnas.2010932118 - DOI - PMC - PubMed
    1. Baylis LL, Rolls ET, Baylis GC (1995) Afferent connections of the orbitofrontal cortex taste area of the primate. Neuroscience 64:801–812. 10.1016/0306-4522(94)00449-f - DOI - PubMed
    1. Becker G, DeGroot M, Marschak J (1964) Measuring utility by a single-response sequential method. Behav Sci 9:226–232. 10.1002/bs.3830090304 - DOI - PubMed

Publication types

LinkOut - more resources