. 2023 Nov 29;43(48):8201-8218.
doi: 10.1523/JNEUROSCI.0558-23.2023.

Distinct ACC Neural Mechanisms Underlie Authentic and Transmitted Anxiety Induced by Maternal Separation in Mice

Affiliations

Distinct ACC Neural Mechanisms Underlie Authentic and Transmitted Anxiety Induced by Maternal Separation in Mice

Jinxiang Jiang et al. J Neurosci. .

Abstract

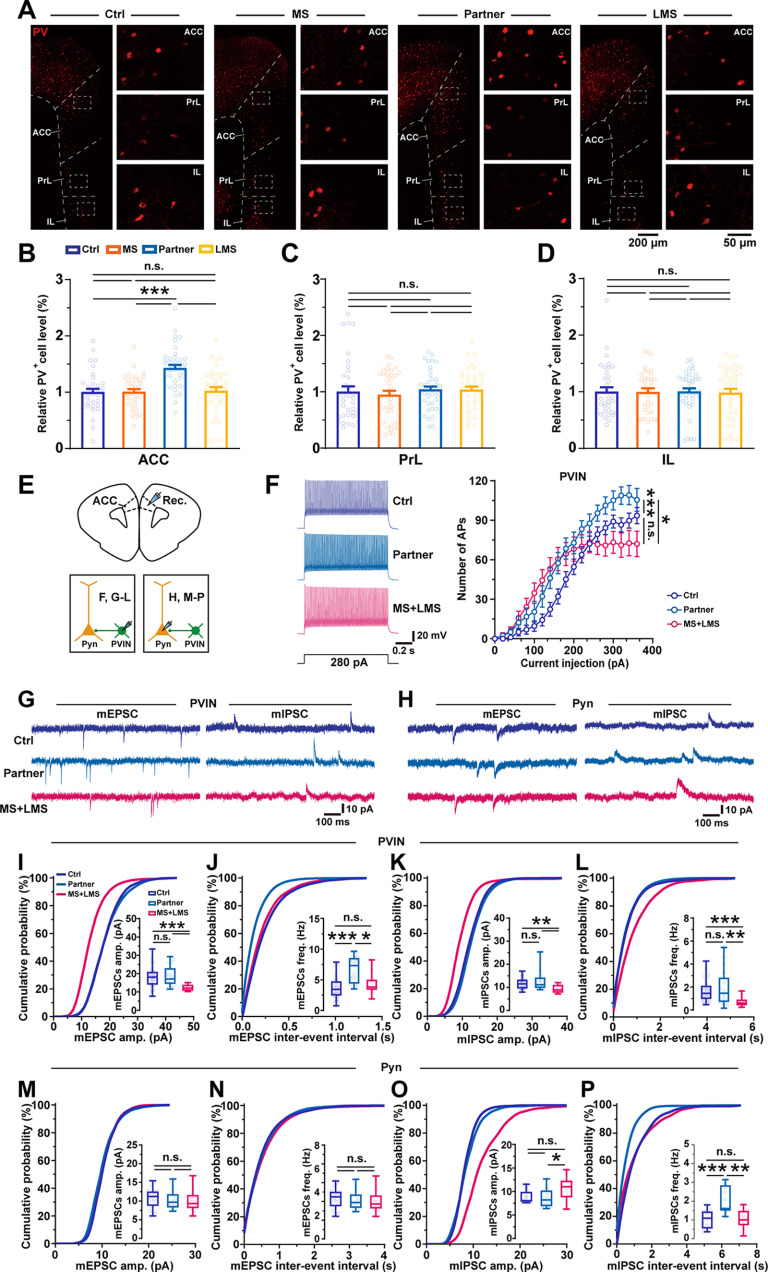
It is known that humans and rodents are capable of transmitting stress to their naive partners via social interaction. However, a comprehensive understanding of transmitted stress, which may differ from authentic stress, thus revealing unique neural mechanisms of social interaction resulting from transmitted stress and the associated anxiety, is missing. We used, in the present study, maternal separation (MS) as a stress model to investigate whether MS causes abnormal behavior in adolescence. A key concern in the analysis of stress transmission is whether the littermates of MS mice who only witness MS stress ("Partners") exhibit behavioral abnormalities similar to those of MS mice themselves. Of special interest is the establishment of the neural mechanisms underlying transmitted stress and authentic stress. The results show that Partners, similar to MS mice, exhibit anxiety-like behavior and hyperalgesia after witnessing littermates being subjected to early-life repetitive MS. Electrophysiological analysis revealed that mice subjected to MS demonstrate a reduction in both the excitatory and inhibitory synaptic activities of parvalbumin interneurons (PVINs) in the anterior cingulate cortex (ACC). However, Partners differed from MS mice in showing an increase in the number and excitability of GABAergic PVINs in the ACC and in the ability of chemogenetic PVIN inactivation to eliminate abnormal behavior. Furthermore, the social transfer of anxiety-like behavior required intact olfactory, but not visual, perception. This study suggests a functional involvement of ACC PVINs in mediating the distinct neural basis of transmitted anxiety.SIGNIFICANCE STATEMENT The anterior cingulate cortex (ACC) is a critical brain area in physical and social pain and contributes to the exhibition of abnormal behavior. ACC glutamatergic neurons have been shown to encode transmitted stress, but it remains unclear whether inhibitory ACC neurons also play a role. We evaluate, in this study, ACC neuronal, synaptic and network activities and uncover a critical role of parvalbumin interneurons (PVINs) in the expression of transmitted stress in adolescent mice who had witnessed MS of littermates in infancy. Furthermore, inactivation of ACC PVINs blocks transmitted stress. The results suggest that emotional contagion has a severe effect on brain function, and identify a potential target for the treatment of transmitted anxiety.

Keywords: anterior cingulate cortex; anxiety; authentic; maternal separation; parvalbumin interneurons; transmit.


Figures

Figure 1.
Figure 1.
Partner mice demonstrate anxiety-like behavior in the OFT. A, Experimental schedule for the MS-induced emotional contagion tasks. B, Schematic diagram of Partner and LMS mice, the latter of which suffered a modified MS treatment. C, Representative tracking paths of the four experimental groups in the 5-min OFT. D, Time spent in the central area of the field is significantly reduced in both Partner and MS mice compared with Ctrls (D3), regardless of sex (D1), LMS or MS (D2; male, Ctrl: n = 62, MS: n = 29, Partner: n = 29, LMS: n = 36; female, Ctrl: n = 45, MS: n = 30, Partner: n = 33, LMS: n = 35; D1, Scheirer–Ray–Hare test followed by post hoc comparisons using a rank-sum test with Bonferroni correction, main effect of treatment: H = 8.66, p = 1.6 × 10⁻⁵, main effect of sex: H = 0.757, p = 0.385, interaction: H = 0.808, p = 0.49; D2, MS vs LMS, Mann–Whitney two-tailed test, U = 1772, p = 0.132; D3, Kruskal–Wallis ANOVA with a post hoc Dunn's test, F(2,296) = 22.523, p = 1.286 × 10⁻⁵). E, Both Partner and MS mice show decreased central distance (E3), regardless of sex (E1), LMS or MS (E2; male, Ctrl: n = 62, MS: n = 29, Partner: n = 29, LMS: n = 36; female, Ctrl: n = 45, MS: n = 30, Partner: n = 33, LMS: n = 35; E1, Scheirer–Ray–Hare test followed by post hoc comparisons using a rank-sum test with Bonferroni correction, main effect of treatment: H = 11.459, p = 4.01 × 10⁻⁷, main effect of sex: H = 0.612, p = 0.434, interaction: H = 0.388, p = 0.762; E2, MS vs LMS, Mann–Whitney two-tailed test, U = 1894, p = 0.35; E3, Kruskal–Wallis ANOVA with a post hoc Dunn's test, F(2,296) = 30.379, p = 2.531 × 10⁻⁷). F, Total distance is significantly reduced in Partner and MS mice (F3), regardless of sex (F1), LMS or MS (F2; male, Ctrl: n = 62, MS: n = 29, Partner: n = 29, LMS: n = 36; female, Ctrl: n = 45, MS: n = 30, Partner: n = 33, LMS: n = 35; F1, two-way ANOVA with a post hoc Bonferroni test, main effect of treatment: F(3,291) = 14.151, p = 1.236 × 10⁻⁸, main effect of sex: F(1,291) = 1.159, p = 0.283, interaction: F(3,291) = 1.004, p = 0.391; F2, MS vs LMS, unpaired two-tailed t test, t(128) = 1.811, p = 0.072; F3, one-way ANOVA with a post hoc Bonferroni test, F(2,296) =18.863, p = 1.947 × 10⁻⁸). G, Schematic diagram of the von Frey hair test for assessment of mechanical hyperalgesia. H–J, The PWMT is significantly lower in Partner and MS mice than in Ctrls (J), regardless of sex (H), LMS or MS (I; male, Ctrl: n = 73, MS: n = 42, Partner: n = 33, LMS: n = 43; female, Ctrl: n = 59, MS: n = 49, Partner: n = 29, LMS: n = 30; H, Scheirer–Ray–Hare test followed by post hoc comparisons using a rank-sum test with Bonferroni correction, main effect of treatment: H = 57.958, p = 2.303 × 10⁻³⁰, main effect of sex: H = 0.536, p = 0.465, interaction: H = 1.385, p = 0.247; I, Scheirer–Ray–Hare test followed by post hoc comparisons using a rank-sum test with Bonferroni correction, main effect of treatment: H = 52.661, p = 3.964 × 10⁻¹³, main effect of littermate: H = 14.464, p = 1.429 × 10⁻⁴, interaction: H = 58.347, p = 2.198 × 10⁻¹⁴; J, Kruskal–Wallis ANOVA with a post hoc Dunn's test, F(2,355) =110.862, p = 8.447 × 10⁻²⁵). Data corresponding to this figure are included in Extended Data Table 1-1.
Figure 2.
Figure 2.
The EPMT confirms anxiety-like behavior in Partner mice. A, Schematic diagram of the assessment of anxiety-like behavior using the 10-min EPMT. B, Representative tracking paths in the 10-min EPMT. C, Time spent in the open arms is significantly reduced in both Partner and MS mice compared with Ctrls (C3), regardless of sex (C1), LMS or MS (C2; male, Ctrl: n = 59, MS: n = 30, Partner: n = 24, LMS: n = 32; female, Ctrl: n = 53, MS: n = 28, Partner: n = 24, LMS: n = 29; C1, Scheirer–Ray–Hare test followed by post hoc comparisons using a rank-sum test with Bonferroni correction, main effect of treatment: H = 3.037, p = 0.03, main effect of sex: H = 0.211, p = 0.646, interaction: H = 0.205, p = 0.893; C2, MS vs LMS, unpaired two-tailed t test, t(117) = 0.28, p = 0.78; C3, Kruskal–Wallis ANOVA with a post hoc Dunn's test, F(2,276) = 8.886, p = 0.012, Ctrl vs Partner, p = 0.035, Ctrl vs MS+LMS, p = 0.043, Partner vs MS+LMS, p > 0.999). D, Unchanged entries into open arms in all groups (D3), regardless of sex (D1) LMS or MS (D2; male, Ctrl: n = 59, MS: n = 30, Partner: n = 24, LMS: n = 32; female, Ctrl: n = 53, MS: n = 28, Partner: n = 24, LMS: n = 29; D1, Scheirer–Ray–Hare test followed by post hoc comparisons using a rank-sum test with Bonferroni correction, main effect of treatment: H = 0.052, p = 0.984, main effect of sex: H = 0.242, p = 0.623, interaction: H = 1.645, p = 0.179; D2, MS vs LMS, unpaired two-tailed t test, t(117) = 0.47, p = 0.639; D3, Kruskal–Wallis ANOVA with a post hoc Dunn's test, F(2,276) = 0.041, p = 0.98, Ctrl vs Partner, p > 0.999, Ctrl vs MS+LMS, p > 0.999, Partner vs MS+LMS, p > 0.999). E, Schematic diagram of the FST for measurement of depression-like behavior. F All groups show similar immobility (male, Ctrl: n = 23, MS: n = 23, Partner: n = 19, LMS: n = 23; female, Ctrl: n = 23, MS: n = 17, Partner: n = 13, LMS: n = 21; F1, Scheirer–Ray–Hare test followed by post hoc comparisons using a rank-sum test with Bonferroni correction, main effect of treatment: H = 0.18, p = 0.91, main effect of sex: H = 0.117, p = 0.733, interaction: H = 0.1, p = 0.96; F2, MS vs LMS, unpaired two-tailed t test, t(82) = 0.073, p = 0.942; F3, Kruskal–Wallis ANOVA with a post hoc Dunn's test, F(2,159) = 0.572, p = 0.751, Ctrl vs Partner, p > 0.999, Ctrl vs MS+LMS, p > 0.999, Partner vs MS+LMS, p > 0.999). Data corresponding to this figure are included in Extended Data Table 2-1.
Figure 3.
Figure 3.
Transmitted anxiety-like behavior and hyperalgesia in Partner mice does not derive from the mothers but rather from the LMS mice. A, Schematic diagram of the modified MS protocol. B, Representative tracking paths of mothers in the 5-min OFT. C, Time spent in the central area of the field is reduced in the MS-mothers compared with Partner+LMS-mothers and Ctrl-mothers (Ctrl-mothers n = 19, MS-mothers: n = 18, Partner+LMS-mothers: n = 24; Kruskal–Wallis ANOVA with a post hoc Dunn's test, F(2,58) = 13.235, p = 0.001, Ctrl-mother vs MS-mother, p = 0.002, Ctrl-mother vs Partner+LMS-mother, p > 0.999, Partner+LMS-mother vs MS-mother, p = 0.016). D, E, Both the central distance and total distance of the field were decreased in MS-mothers (Ctrl-mothers: n = 19, MS-mothers: n = 18, Partner+LMS-mothers: n = 24; D, Kruskal–Wallis ANOVA with a post hoc Dunn's test, F(2,58) = 15.831, p = 3.65 × 10⁻⁴, Ctrl-mother vs MS-mother, p = 7.622 × 10⁻⁴, Ctrl-mother vs Partner+LMS-mother, p > 0.999, Partner+LMS-mother vs MS-mother, p = 0.003; E, one-way ANOVA with a post hoc Bonferroni test, F(2,58) = 4.727, p = 0.013, Ctrl-mother vs MS-mother, p = 0.013, Ctrl-mother vs Partner+LMS-mother, p > 0.999, Partner+LMS-mother vs MS-mother, p = 0.083). F, Representative tracking paths in the 10-min EPMT from mothers. G, H, Both time spent and entries into the open arms are decreased in the MS-mothers (Ctrl-mothers: n = 19, MS-mothers: n = 19, Partner+LMS-mothers: n = 24; G, Kruskal–Wallis ANOVA with a post hoc Dunn's test, F(2,59) = 16.54, p = 2.561 × 10⁻⁴, Ctrl-mother vs MS-mother, p = 0.035, Ctrl-mother vs Partner+LMS-mother, p = 0.501, Partner+LMS-mother vs MS-mother, p = 1.591 × 10⁻⁴; H, Kruskal–Wallis ANOVA with a post hoc Dunn's test, F(2,59) = 13.246, p = 0.001, Ctrl-mother vs MS-mother, p = 0.009 Ctrl-mother vs Partner+LMS-mother, p > 0.999, Partner+LMS-mother vs MS-mother, p = 0.002). I, The PWMT is significantly decreased in MS-mothers, but not Partner+LMS-mother and Ctrl-mother groups (Ctrl-mothers: n = 19, MS-mothers: n = 19, Partner+LMS-mothers: n = 24; Kruskal–Wallis ANOVA with a post hoc Dunn's test, F(2,59) = 18.907, p = 7.843 × 10⁻⁵, Ctrl-mother vs MS-mother, p = 0.002, Ctrl-mother vs Partner+LMS-mother, p > 0.999, Partner+LMS-mother vs MS-mother, p = 1.322 × 10⁻⁴). Data corresponding to this figure are included in Extended Data Table 3-1.
Figure 4.
Figure 4.
Young Partner mice already show anxiety-like behavior and hyperalgesia. A, Representative tracking paths of three- to four-week-old mice in the 5-min OFT. B, Time spent in the central area of the field is significantly reduced in both Partner and MS mice compared with Ctrls (Ctrl: n = 16, Partner: n = 16, MS+LMS: n = 24; Kruskal–Wallis ANOVA with a post hoc Dunn's test, F(2,53) = 28.796, p = 5.586 × 10⁻⁷, Ctrl vs Partner, p = 4.982 × 10⁻⁶, Ctrl vs MS+LMS, p = 1.013 × 10⁻⁵, Partner vs MS+LMS, p > 0.999). C, Both Partner and MS mice show decreased central distance (Ctrl: n = 16, Partner: n = 16, MS+LMS: n = 24; Kruskal–Wallis ANOVA with a post hoc Dunn's test, F(2,53) = 17.565, p = 1.534 × 10⁻⁴, Ctrl vs Partner, p = 0.037, Ctrl vs MS+LMS, p = 8.616 × 10⁻⁵, Partner vs MS+LMS, p = 0.449). D, Total distance is significantly reduced in Partner and MS mice (Ctrl: n = 16, Partner: n = 16, MS+LMS: n = 24; Kruskal–Wallis ANOVA with a post hoc Dunn's test, F(2,53) = 10.892, p = 0.004, Ctrl vs Partner, p = 0.046, Ctrl vs MS+LMS, p = 0.004, Partner vs MS+LMS, p > 0.999). E, Representative tracking paths in the 10-min EPMT. F, Time spent in the open arms is significantly reduced in both Partner and MS mice compared with Ctrls (Ctrl: n = 16, Partner: n = 13, MS+LMS: n = 24; Kruskal–Wallis ANOVA with a post hoc Dunn's test, F(2,53) = 12.463, p = 0.002, Ctrl vs Partner, p = 0.007, Ctrl vs MS+LMS, p = 0.004, Partner vs MS+LMS, p > 0.999). G, Unchanged entries into open arms in all groups (Ctrl: n = 16, Partner: n = 16, MS+LMS: n = 24; one-way ANOVA with a post hoc Bonferroni test, F(2,53) = 0.188, p = 0.829, Ctrl vs Partner, p > 0.999, Ctrl vs MS+LMS, p > 0.999, Partner vs MS+LMS, p > 0.999). H, The PWMT is significantly decreased in Partner and MS mice compared with Ctrls (Ctrl: n = 15, Partner: n = 15, MS+LMS: n = 24; Kruskal–Wallis ANOVA with a post hoc Dunn's test, F(2,51) = 13.567, p = 0.001, Ctrl vs Partner, p = 0.027, Ctrl vs MS+LMS, p = 9.134 × 10⁻⁴, Partner vs MS+LMS, p > 0.999). Data corresponding to this figure are included in Extended Data Table 4-1.
Figure 5.
Figure 5.
Increase in the expression and excitability of PVINs in the ACC of Partner mice. A, Representative images of PVINs in the ACC, and the PrL and IL subregions of ACC, in all groups. Left scale bar, 200 μm; right scale bar, 50 μm. B–D, Partner mice show significantly increased levels of PVINs in the ACC (B), but not the PrL (C) and IL (D), compared with the other three groups (n = 12, per group; two-way ANOVA with a post hoc Bonferroni test, ACC: main effect of treatment: F(1,145) = 11.079, p = 1.11 × 10⁻³, main effect of littermate: F(1,145) = 13.971, p = 2.664 × 10⁻⁴, interaction: F(1,145) = 11.811, p = 7.687 × 10⁻⁴; Scheirer–Ray–Hare test followed by post hoc comparisons using a rank-sum test with Bonferroni correction, PrL: main effect of treatment: H = 0.812, p = 0.676, main effect of littermate: H = 0.173, p = 0.361, interaction: H = 0.761, p = 0.76; Scheirer–Ray–Hare test followed by post hoc comparisons using a rank-sum test with Bonferroni correction, IL: main effect of treatment: H = 0.953, p = 0.842, main effect of littermate: H = 0.537, p = 0.945, interaction: H = 0.772, p = 0.905). E, Schematic diagram illustrating PVIN and Pyn recordings in the ACC. Left, recorded PVIN; right, recorded Pyn. F, Representative PVIN action potentials in the ACC. The PVINs of Partner mice show a significantly increased number of APs in the ACC (Ctrl: n = 33 cells/6 mice, Partner: n = 19 cells/6 mice, MS+LMS: n = 19 cells/6 mice; Kruskal–Wallis ANOVA with a post hoc Dunn's test, F(2,68) = 26.125, p = 2.123 × 10⁻⁶). G, H, Representative mEPSC and mIPSC traces of PVINs in the ACC. I, PVINs of Ctrl and Partner mice show similar mEPSC amplitude, while mEPSC amplitude in both Ctrl and Partner mice is significantly higher than in MS mice (Ctrl: n = 40 cells/6 mice, Partner: n = 19 cells/6 mice, MS+LMS: n = 15 cells/6 mice; Kruskal–Wallis ANOVA with a post hoc Dunn's test, F(2,71) = 19.612, p = 5.512 × 10⁻⁵). J, PVINs show significantly enhanced mEPSC frequency in Partners compared with Ctrl and MS groups (Ctrl: n = 40 cells/6 mice, Partner: n = 19 cells/6 mice, MS+LMS: n = 15 cells/6 mice; Kruskal–Wallis ANOVA with a post hoc Dunn's test, F(2,71) = 23.075, p = 9.757 × 10⁻⁶). K, L, PVINs of Ctrl and Partner mice show similar amplitude and frequency of mIPSCs, which differ significantly from those of MS mice (mIPSC amplitude and frequency, Ctrl: n = 38 cells/6 mice, Partner: n = 19 cells/6 mice, MS+LMS: n = 15 cells/6 mice; K, Kruskal–Wallis ANOVA with a post hoc Dunn's test, F(2,69) = 13.929, p = 9.45 × 10⁻⁴; L, Kruskal–Wallis ANOVA with a post hoc Dunn's test, F(2,69) = 15.207, p = 4.988 × 10⁻⁴). M, N, Neither amplitude nor frequency of mEPSCs changes in ACC Pyns across all groups (mEPSC amplitude and frequency, Ctrl: n = 21 cells/6 mice, Partner: n = 20 cells/6 mice, MS+LMS: n = 16 cells/6 mice; M, Kruskal–Wallis ANOVA with a post hoc Dunn's test, F(2,54) = 0.992, p = 0.609; N, Kruskal–Wallis ANOVA with a post hoc Dunn's test, F(2,54) = 3.94, p = 0.139). O, Pyns of Ctrl and Partner mice show similar mIPSC amplitude, with both being significantly smaller than that of MS mice (Ctrl: n = 16 cells/6 mice, Partner: n = 13 cells/6 mice, MS+LMS: n = 14 cells/6 mice; Kruskal–Wallis ANOVA with a post hoc Dunn's test, F(2,40) = 7.019, p = 0.03). P, Pyns show significantly enhanced mIPSC frequency in the Partner compared with Ctrl and MS groups (Ctrl: n = 16 cells/6 mice, Partner: n = 13 cells/6 mice, MS+LMS: n = 14 cells/6 mice; Kruskal–Wallis ANOVA with a post hoc Dunn's test, F(2,39) = 16.008, p = 3.342 × 10⁻⁴). Data corresponding to this figure are included in Extended Data Table 5-1.
Figure 6.
Figure 6.
Partner mice show enhanced θ-γ coupling and decreased pPyn firing modulated by ACC γ oscillations. A, Schematic diagram showing multichannel recordings in the ACC of head-fixed conscious mice. B, Representative traces of raw, θ and γ oscillations in the ACC. C–E, The power in the θ-bands and γ-bands is significantly increased in Partner mice (Ctrl: n = 6, Partner: n = 6, MS+LMS: n = 12; D, Kruskal–Wallis ANOVA with a post hoc Dunn's test, F(2,21) = 9.372, p = 0.009; E, Kruskal–Wallis ANOVA with a post hoc Dunn's test, F(2,21) = 10.365, p = 0.006). F, G, Enhanced θ-γ coupling in Partner mice (Ctrl: n = 5, Partner: n = 6, MS+LMS: n = 8; Kruskal–Wallis ANOVA with a post hoc Dunn's test, F(2,16) = 12.155, p = 2.225 × 10⁻⁴). H, Distribution of interspike interval in a representative pPyn. I, Autocorrelograms of the corresponding pPyn in H. J, γ Oscillations drive the activity of a prefrontal pPyn. K, pPyns of Partner mice show increased spectral power in the range of the γ-band, but not the θ-band (Ctrl: n = 6, Partner: n = 6, MS+LMS: n = 10; θ: Kruskal–Wallis ANOVA with a post hoc Dunn's test, F(2,19) = 0.553, p = 0.772; γ: Kruskal–Wallis ANOVA with a post hoc Dunn's test, F(2,19) = 15.051, p = 1.433 × 10⁻⁵). L, Representative traces of high-pass-filtered LFPs. M, pPyns of Partner mice show a decreased firing rate, like MS mice (Ctrl: n = 6, Partner: n = 6, MS+LMS: n = 11; Kruskal–Wallis ANOVA with a post hoc Dunn's test, F(2,20) = 9.071, p = 0.011). Data corresponding to this figure are included in Extended Data Table 6-1.
Figure 7.
Figure 7.
Chemogenetic inactivation of ACC PVINs blocks hyperalgesia and anxiety-like behavior in Partner mice. A, Schedule for the pharmacogenetic inhibition experiments. B, The PWMT is significantly ameliorated by CNO in Partner mice (PBS, Partner: n = 20, LMS: n = 23; CNO, Partner: n = 20, LMS: n = 20; Scheirer–Ray–Hare test followed by post hoc comparisons using a rank-sum test with Bonferroni correction, main effect of group: H = 9.087, p = 0.003, main effect of drug treatment: H = 1.045, p = 0.307, interaction: H = 11.773, p = 0.001). C, Representative tracking paths in the 5-min OFT. D–F, CNO significantly increases the time spent in the central area, central distance and total distance in Partner mice (PBS, Partner: n = 21, LMS: n = 21; CNO, Partner: n = 20, LMS: n = 20; D, Scheirer–Ray–Hare test followed by post hoc comparisons using a rank-sum test with Bonferroni correction, main effect of group: H = 9.154, p = 0.002, main effect of drug treatment: H = 5.582, p = 0.018, interaction: H = 7.333, p = 0.007; E, Scheirer–Ray–Hare test followed by post hoc comparisons using a rank-sum test with Bonferroni correction, main effect of group: H = 13.372, p = 2.554 × 10⁻⁴, main effect of drug treatment: H = 19.165, p = 1.199 × 10⁻⁵, interaction: H = 14.696, p = 1.263 × 10⁻⁴; F, Scheirer–Ray–Hare test followed by post hoc comparisons using a rank-sum test with Bonferroni correction, main effect of group: H = 6.954, p = 0.01, main effect of drug treatment: H = 9.711, p = 0.003, interaction: H = 1.86, p = 0.177). G, Representative tracking paths in the 10-min EPMT. H, I, CNO significantly increases the time spent and entries into the open arms in Partner mice (PBS, Partner: n = 20, LMS: n = 23; CNO, Partner: n = 20, LMS: n = 20; H, Scheirer–Ray–Hare test followed by post hoc comparisons using a rank-sum test with Bonferroni correction, main effect of group: H = 12.309, p = 4.507 × 10⁻⁴, main effect of drug treatment: H = 4.429, p = 0.035, interaction: H = 8.323, p = 0.004; I, two-way ANOVA with a post hoc Bonferroni test, main effect of group: F(1,79) = 8.021, p = 0.006, main effect of drug treatment: F(1,79) = 3.447, p = 0.067, interaction: F(1,79) = 15.361, p = 1.878 × 10⁻⁴). J, Representative image of AAV-hM4D-labeled PVINs in the ACC. K, Representative APs of PVINs in the ACC before and after CNO treatment. L, M, CNO significantly suppresses AP frequency of PVINs in the ACC (n = 9 cells/6 mice; L, two-way RM ANOVA, main effect of current injection: F(1,8) = 25.987, p = 9.324 × 10⁻⁴, main effect of drug treatment: F(18,144) = 29.066, p = 4.859 × 10−39, interaction: F(18,144) = 1.232, p = 0.243; M, Wilcoxon matched-pairs signed-rank two-tailed t test, p = 0.004). N, Representative mIPSC traces of Pyns in the ACC before and after CNO treatment. O, P, CNO significantly reduces the mIPSC frequency of Pyns in Partner mice, leaving the mIPSC amplitude unchanged (mIPSC amplitude and frequency, Partner+PBS: n = 12 cells/6 mice, Partner+CNO: n = 15 cells/6 mice; O, Kolmogorov–Smirnov two-tailed test, D(25) = 0.383, p = 0.28; P, Kolmogorov–Smirnov two-tailed test, D(25) = 0.7, p = 0.003). Data corresponding to this figure are included in Extended Data Table 7-1.
Figure 8.
Figure 8.
Blockade of anxiety-like behavior and hyperalgesia by OD in Partner mice. A, Schematic diagram of the FFT. B, OD mice show significantly increased latency in finding the buried food, suggesting a successful blockade of olfaction in these mice (Ctrl: n = 12, Ctrl+OD: n = 27, Partner+OD: n = 12, MS+LMS+OD: n = 23, per stage; buried food: Kruskal–Wallis ANOVA with a post hoc Dunn's test, F(3,70) = 39.207, p = 1.569 × 10⁻⁸, Ctrl vs Ctrl+OD, p = 1.957 × 10⁻⁷, Ctrl vs Partner+OD, p = 1.567 × 10⁻⁵, Ctrl vs MS+LMS +OD, p = 4.875 × 10⁻⁸, Ctrl+OD vs Partner+OD, p > 0.999, Ctrl+OD vs MS+LMS+OD, p > 0.999, Partner+OD vs MS+LMS+OD, p > 0.999; visible food: Kruskal–Wallis ANOVA with a post hoc Dunn's test, F(3,70) = 7.858, p = 0.049, Ctrl vs Ctrl+OD, p = 0.383, Ctrl vs Partner+OD, p > 0.999, Ctrl vs MS+LMS +OD, p > 0.999, Ctrl+OD vs Partner+OD, p > 0.999, Ctrl+OD vs MS+LMS+OD, p = 0.503, Partner+OD vs MS+LMS+OD, p > 0.999). C, Representative tracking paths in the 5-min OFT of OD mice. D–F, OD eliminates the OFT differences (Fig. 1D3,E3,F3) between Partner and Ctrl mice (Ctrl+OD: n = 27, Partner+OD: n = 25, MS+LMS+OD: n = 38; D, Kruskal–Wallis ANOVA with a post hoc Dunn's test, F(2,87) = 27.471, p = 1.084 × 10⁻⁶, Ctrl+OD vs Partner+OD, p = 0.754, Ctrl+OD vs MS+LMS+OD, p = 2.291 × 10⁻⁶, Partner+OD vs MS+LMS+OD, p = 9.68 × 10⁻⁴; E, Kruskal–Wallis ANOVA with a post hoc Dunn's test, F(2,87) = 27.6, p = 1.004 × 10⁻⁶, Ctrl+OD vs Partner+OD, p = 0.166, Ctrl+OD vs MS+LMS+OD, p = 7.187 × 10⁻⁷, Partner+OD vs MS+LMS+OD, p = 0.009; F, one-way ANOVA with a post hoc Bonferroni test, F(2,87) = 1.862, p = 0.162, Ctrl+OD vs Partner+OD, p = 0.301, Ctrl+OD vs MS+LMS+OD, p = 0.271, Partner+OD vs MS+LMS+OD, p > 0.999). G, Representative tracking paths in the 10-min EPMT of OD mice. H, I, OD eliminates the differences in the time spent in open arms between (Ctrl+OD: n = 27, Partner+OD: n = 28, MS+LMS+OD: n = 39; H, Kruskal–Wallis ANOVA with a post hoc Dunn's test, F(2,91) = 27.812, p = 9.135 × 10⁻⁷, Ctrl+OD vs Partner+OD, p > 0.999, Ctrl+OD vs MS+LMS+OD, p = 9.976 × 10⁻⁶, Partner+OD vs MS+LMS+OD, p = 8.429 × 10⁻⁵; I, one-way ANOVA with a post hoc Bonferroni test, F(2,91) = 15.688, p = 1.4 × 10⁻⁶, Ctrl+OD vs Partner+OD, p > 0.999, Ctrl+OD vs MS+LMS+OD, p = 2.226 × 10⁻⁵, Partner+OD vs MS+LMS+OD, p = 3.2 × 10⁻⁵). J, OD eliminates the difference in PWMT (Fig. 1J) between Partner and Ctrl mice (Ctrl+OD: n = 27, Partner+OD: n = 31, MS+LMS+OD: n = 36; Kruskal–Wallis ANOVA with a post hoc Dunn's test, F(2,91) = 42.305, p = 6.51 × 10⁻¹⁰, Ctrl+OD vs Partner+OD, p = 0.27, Ctrl+OD vs MS+LMS+OD, p = 2.047 × 10⁻⁹, Partner+OD vs MS+LMS+OD, p = 1.329 × 10⁻⁵). K, Representative tracking paths in the 5-min OFT of dark-reared mice. L, M, The central time and central distance of Partner mice still differed from Ctrls, but was similar to MS mice (Ctrl+VD: n = 22, Partner+VD: n = 22, MS+LMS+VD: n = 18; L, Kruskal–Wallis ANOVA with a post hoc Dunn's test, F(2,59) = 16.066, p = 3.245 × 10⁻⁴, Ctrl+VD vs Partner+VD, p = 4.741 × 10⁻³, Ctrl+VD vs MS+LMS+VD, p = 7.274 × 10⁻⁴, Partner+VD vs MS+LMS+VD, p > 0.999; M, Kruskal–Wallis ANOVA with a post hoc Dunn's test, F(2,59) = 8.021, p = 0.018, Ctrl+VD vs Partner+VD, p = 0.063, Ctrl+VD vs MS+LMS+VD, p = 0.033, Partner+VD vs MS+LMS+VD, p > 0.999). N, Identical total distance of the three groups with dark rearing (Ctrl+VD: n = 22, Partner+VD: n = 22, MS+LMS+VD: n = 18; one-way ANOVA with a post hoc Bonferroni test, F(2,59) = 0.13, p = 0.878, Ctrl+VD vs Partner+VD, p = 0.999, Ctrl+VD vs MS+LMS+VD, p = 0.904, Partner+VD vs MS+LMS+VD, p = 0.887). O, Representative tracking paths in the 10-min EPMT of VD mice. P, The time spent in the open arms is reduced in MS mice with dark rearing (Ctrl+VD: n = 22, Partner+VD: n = 18, MS+LMS+VD: n = 20; one-way ANOVA with a post hoc Bonferroni test, F(2,57) = 7.48, p = 0.001, Ctrl+VD vs Partner+VD, p = 0.047, Ctrl+VD vs MS+LMS+VD, p = 0.001, Partner+VD vs MS+LMS+VD, p = 0.763). Q, Identical entries into open arms among groups raised in the dark (Ctrl+VD: n = 22, Partner+VD: n = 18, MS+LMS+VD: n = 20; Kruskal–Wallis ANOVA with a post hoc Dunn's test, F(2,57) = 4.479, p = 0.107, Ctrl+VD vs Partner+VD, p = 0.581, Ctrl+VD vs MS+LMS+VD, p = 0.112, Partner+VD vs MS+LMS+VD, p > 0.999). R, The PWMT is still significantly reduced in both Partner and MS mice compared with Ctrls following dark rearing (Ctrl+VD: n = 22, Partner+VD: n = 23, MS+LMS+VD: n = 21; Kruskal–Wallis ANOVA with a post hoc Dunn's test, F(2,63) = 12.685, p = 0.002, Ctrl+VD vs Partner+VD, p = 0.004, Ctrl+VD vs MS+LMS+VD, p = 0.009, Partner+VD vs MS+LMS+VD, p > 0.999). OD: olfactory deprivation; VD: visual deprivation. Data corresponding to this figure are included in Extended Data Table 8-1.

Similar articles

Cited by

References

    1. Apps MA, Rushworth MF, Chang SW (2016) The anterior cingulate gyrus and social cognition: tracking the motivation of others. Neuron 90:692–707. 10.1016/j.neuron.2016.04.018 - DOI - PMC - PubMed
    1. Bangasser DA, Cuarenta A (2021) Sex differences in anxiety and depression: circuits and mechanisms. Nat Rev Neurosci 22:674–684. 10.1038/s41583-021-00513-0 - DOI - PubMed
    1. Baracz SJ, Everett NA, Robinson KJ, Campbell GR, Cornish JL (2020) Maternal separation changes maternal care, anxiety-like behaviour and expression of paraventricular oxytocin and corticotrophin-releasing factor immunoreactivity in lactating rats. J Neuroendocrinol 32:e12861. 10.1111/jne.12861 - DOI - PubMed
    1. Barthas F, Sellmeijer J, Hugel S, Waltisperger E, Barrot M, Yalcin I (2015) The anterior cingulate cortex is a critical hub for pain-induced depression. Biol Psychiatry 77:236–245. 10.1016/j.biopsych.2014.08.004 - DOI - PubMed
    1. Bastiaansen JA, Thioux M, Keysers C (2009) Evidence for mirror systems in emotions. Philos Trans R Soc Lond B Biol Sci 364:2391–2404. 10.1098/rstb.2009.0058 - DOI - PMC - PubMed

Publication types

LinkOut - more resources