. 2023 Oct 16;14(10):682.
doi: 10.1038/s41419-023-06200-5.

Pyrroline-5-carboxylate reductase 1 reprograms proline metabolism to drive breast cancer stemness under psychological stress

Affiliations

Pyrroline-5-carboxylate reductase 1 reprograms proline metabolism to drive breast cancer stemness under psychological stress

Bai Cui et al. Cell Death Dis. .

Abstract

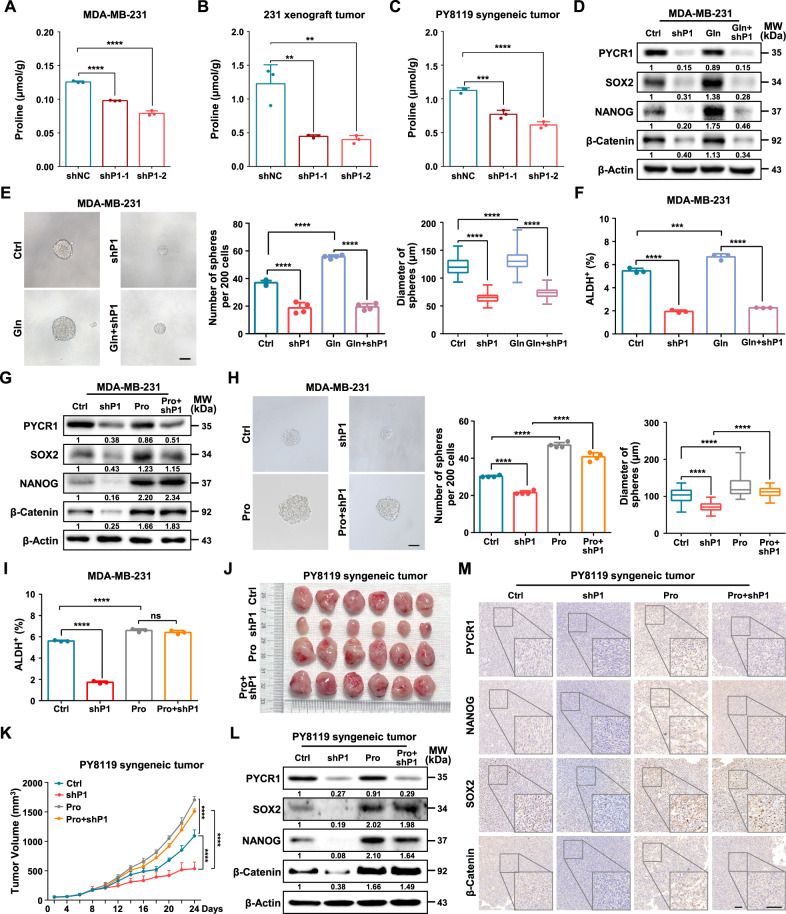
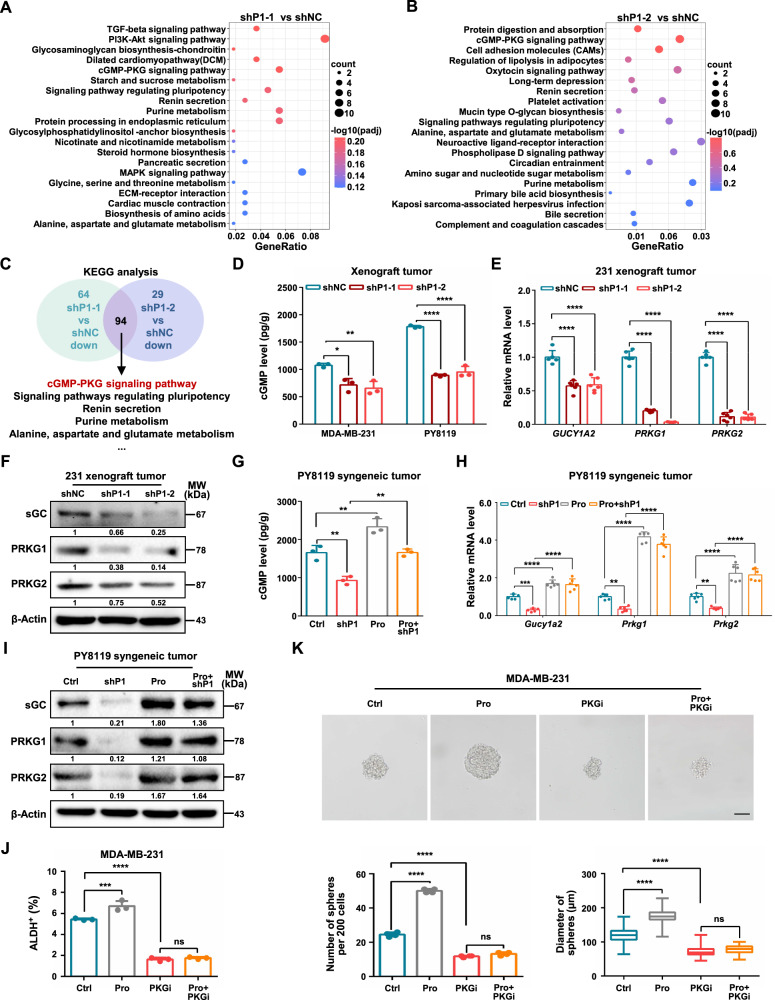
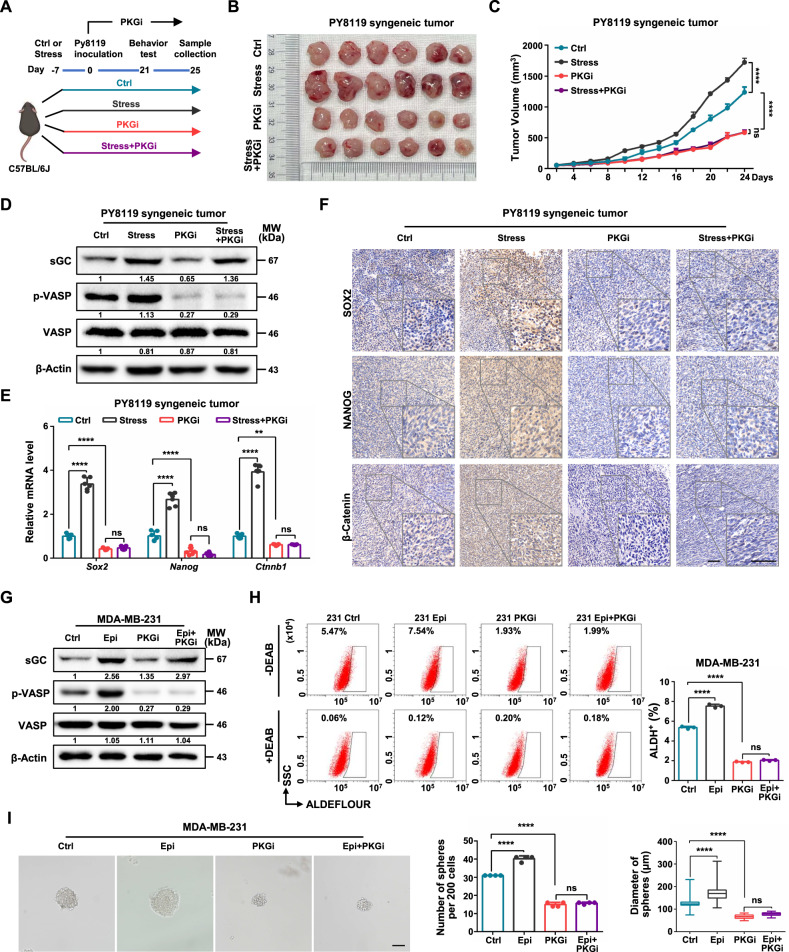
Cancer stem-like cells (CSCs) contribute to cancer metastasis, drug resistance and tumor relapse, yet how amino acid metabolism promotes CSC maintenance remains exclusive. Here, we identify that proline synthetase PYCR1 is critical for breast cancer stemness and tumor growth. Mechanistically, PYCR1-synthesized proline activates cGMP-PKG signaling to enhance cancer stem-like traits. Importantly, cGMP-PKG signaling mediates psychological stress-induced cancer stem-like phenotypes and tumorigenesis. Ablation of PYCR1 markedly reverses psychological stress-induced proline synthesis, cGMP-PKG signaling activation and cancer progression. Clinically, PYCR1 and cGMP-PKG signaling components are highly expressed in breast tumor specimens, conferring poor survival in breast cancer patients. Targeting proline metabolism or cGMP-PKG signaling pathway provides a potential therapeutic strategy for breast patients undergoing psychological stress. Collectively, our findings unveil that PYCR1-enhanced proline synthesis displays a critical role in maintaining breast cancer stemness.


Conflict of interest statement

All authors declare no competing interests.

Figures

Fig. 1
Fig. 1. PYCR1 is required for breast cancer stem-like cell maintenance.
A, B Volcano plots represent DEGs comparing TNBC tumor tissues with adjacent normal tissues (SRP157974) (A) and DEGs comparing spheroids with monolayer MDA-MB-231 cells (GSE116180) (B). The number of significantly variant genes (FC > 2, P < 0.05) was shown. Vertical dashed lines indicate cut-off of FC (2), whereas the horizontal dashed lines indicate cut-off of P-value (0.05). C The GSEA hallmark gene sets analysis of overlapped DEGs upregulated in TNBC samples and sphere MDA-MB-231 cells. D Relative mRNA levels of PYCR1 in mammary epithelium and breast cancer cell lines (n = 3). E Relative mRNA levels of PYCR1, SOX2, NANOG and POU5F1 in spheroids and MDA-MB-231 cells (n = 3). F Sphere formation ability was analyzed following ablation of PYCR1 (shP1-1, shP1-2) in MDA-MB-231 cells. The representative images were presented (scale bar = 100 μm) and the number and diameter of spheroids were measured and counted (n = 4). G Left: second generation Extreme Limiting Dilution Analysis was performed by plating MDA-MB-231 spheroids (from F). Top right: The representative sphere images are shown. Scale bars, 100 μm. Bottom right: Stemness frequency illustration of the cells with the upper and lower 95% confidence intervals meaning that the frequency of one stem cell in cancer cells. Spheres were counted from 16 replicate wells. H Differences of ALDH-positive cells in MDA-MB-231 cells following ablation of PYCR1 (shP1-1, shP1-2) were determined (n = 3). I Schematic of experimental procedure used to sort ALDH- and ALDH+ MDA-MB-231 cells for further assays. J Flow cytometry analysis for ALDH-positive cells in sorted ALDH- MDA-MB-231 (shP1-1 and shP1-2) cells after 6 days monolayer culture (n = 3). K Sphere formation assay was performed in sorted ALDH- MDA-MB-231 shNC, shP1-1 and shP1-2 cells. The representative images were presented (Left, scale bar = 100 μm) and the number (Middle) and diameter (Right) of spheroids were measured and counted (n = 4). L, M Immunodeficient mice (n = 6) were subcutaneously inoculated with monolayer shP1-1 and shP1-2 MDA-MB-231 cells (L) and tumor volumes were monitored (M). N Serially diluted tumor cells from xenograft tumors (L) were subcutaneously inoculated at 3 different sites into each group of mice. Statistical analysis of tumorigenesis with indicated cell numbers and different treatments is shown (n = 8). O, P Cells from MDA-MB-231 spheroids (Fig. 1F) were subcutaneously inoculated in immunodeficient mice (O) (n = 6). Tumor volumes were monitored (P). FC, fold change. DEGs, differentially expressed genes. GSEA, gene set enrichment analysis. Graph data were presented as mean ± SD. **P < 0.01, ***P < 0.001, ****P < 0.0001. P-values were calculated with two-tailed, unpaired Student’s t-test.
Fig. 2
Fig. 2. Proline mediates PYCR1-enhanced breast cancer stemness and tumor growth.
AC The proline level in MDA-MB-231 cells (A), MDA-MB-231 tumor (B) and PY8119 tumor (C) between shNC and PYCR1-silencing group (n = 3). D Relative protein levels of PYCR1, SOX2, NANOG and β-Catenin were determined following PYCR1 knockdown and supplement of glutamine (Gln) in MDA-MB-231 cells. E Sphere formation ability was analyzed following depletion of PYCR1 and supplement of glutamine in MDA-MB-231 cells. The representative images were presented (Left, scale bar = 100 μm) and the number (Middle) and diameter (Right) of spheroids was measured and counted (n = 4). F ALDH-positive cells in MDA-MB-231 cells following knockdown PYCR1 and supplement of glutamine were analyzed (n = 3). G Relative protein expression of PYCR1, SOX2, NANOG and β-Catenin were determined following PYCR1 knockdown and supplement of proline (100 μM) in MDA-MB-231 cells. H Sphere formation ability was analyzed following depletion of PYCR1 and supplement of proline in MDA-MB-231 cells. The representative images were presented (Left, scale bar = 100 μm) and the number (Middle) and diameter (Right) of spheroids was measured and counted (n = 4). I ALDH-positive cells in MDA-MB-231 cells following knockdown PYCR1 and supplement of proline were analyzed (n = 3). J, K C57BL/6 J mice (n = 6) were subcutaneously inoculated with PY8119 cells with PYCR1 silencing and supplement of proline every day (J), and tumor volumes were monitored (K). L Relative protein expression of PYCR1, SOX2, NANOG and β-Catenin were determined in xenograft PY8119 tumors. M Representative images of PYCR1, NANOG, SOX2 and β-Catenin by IHC staining in PY8119 xenograft tumors. Scale bars, 50 μm. Gln, glutamine. Pro, proline. Graph data were presented as mean ± SD. **P < 0.01, ***P < 0.001, ****P < 0.0001. P-values were calculated with two-tailed, unpaired Student’s t-test (A, B, C, K) or one-way ANOVA (E, F, H, I).
Fig. 3
Fig. 3. Proline activates cGMP-PKG signaling to promote breast cancer stem-like traits.
A, B The enriched KEGG pathways of downregulated genes following shP1-1 (A) and shP1-2 MDA-MB-231 cells (B). C Overlapping the enriched KEGG pathways from downregulated genes of MDA-MB-231 shP1-1 cells and shP1-2 cells. The common pathways were listed. D The cGMP levels were measured in MDA-MB-231 tumor and PY8119 tumor following PYCR1 knockdown (n = 3). E Relative mRNA levels of GUCY1A2, PRKG1 and PRKG2 were determined following PYCR1 knockdown in MDA-MB-231 tumor (n = 6). F Relative protein levels of sGC, PRKG1 and PRKG2 were determined following PYCR1 knockdown in MDA-MB-231 tumor. G The cGMP levels were determined following PYCR1 knockdown and supplemental addition of proline in PY8119 tumor (n = 3). H Relative mRNA levels of Gucy1a2, Prkg1 and Prkg2 were determined following PYCR1 knockdown and supplemental addition of proline in PY8119 tumor (n = 6). I The protein levels of sGC, PRKG1 and PRKG2 were determined following PYCR1 knockdown and supplemental addition of proline in PY8119 tumor. J ALDH-positive populations were analyzed following treatment proline and PKGi in MDA-MB-231 cells. Differences of ALDH-positive cells among groups were analyzed (n = 3). K Sphere formation ability was analyzed following treatment proline and PKGi in MDA-MB-231 cells. The representative images were presented (Upper, scale bar = 100 μm) and the number (Bottom Left) and diameter (Bottom Right) of spheroids were measured and counted (n = 4). PKGi, PKG inhibitor. Graph data were presented as mean ± SD. *P < 0.05, **P < 0.01, ***P < 0.001, ****P < 0.0001. P-values were calculated with two-tailed, unpaired Student’s t-test (D, E) or one-way ANOVA (G, H, J, K).
Fig. 4
Fig. 4. cGMP-PKG signaling mediates psychological stress-induced stem-like phenotypes and tumor development.
A A schematic of the timing of chronic restraint stress, tumor inoculation, PKGi injections, behavioral tests and sample collection in the PY8119 syngeneic tumor model. B, C Representative tumor image (B) and growth curve (C) of Ctrl, Stress, PKGi and Stress plus PKGi PY8119 tumor in mice (n = 6). D Relative protein levels of sGC and phosphorylation level of VASP (Ser239) were determined following in PY8119 tumor (in A). E Relative mRNA levels of Sox2, Nanog and Ctnnb1 were determined following in PY8119 tumor (n = 6). F Representative images of SOX2, NANOG and β-Catenin IHC staining in PY8119 tumor. Scale bars, 50 μm. G Relative protein levels of sGC and phosphorylation level of VASP (Ser239) were determined following Epi and PKGi treatment in MDA-MB-231 cells. H ALDH-positive populations were analyzed following treatment Epi and PKGi in MDA-MB-231 cells (n = 3). I Sphere formation ability was analyzed following treatment Epi and PKGi in MDA-MB-231 cells. The representative images were presented (Left, scale bar = 100 μm) and the number (Middle) and diameter (Right) of spheroids were measured and counted (n = 4). Epi, epinephrine. Graph data were presented as mean ± SD. **P < 0.01, ****P < 0.0001. P-values were calculated with two-tailed, unpaired Student’s t-test (C) or one-way ANOVA (E, H, I).
Fig. 5
Fig. 5. Silencing of PYCR1 reverses psychological stress-induced proline synthesis, cGMP-PKG signaling, and cancer progression.
A A schematic of the timing of chronic restraint stress, tumor inoculation, behavioral tests and sample collection in the PY8119 syngeneic tumor model. B, C Representative tumor image (B) and growth curve (C) of Ctrl, Stress, shP1, and stress-induced shP1 PY8119 tumor in mice. D The proline levels were measured in PY8119 tumors (n = 3). E The cGMP levels were measured in PY8119 tumor (n = 3). F Relative mRNA levels of Pycr1, Gucy1a2, Prkg1 and Prkg2 were determined in PY8119 tumor (n = 6). G Relative protein levels of PYCR1, cGMP-PKG related genes and phosphorylation level of VASP (Ser239) were determined in PY8119 tumor. H Relative mRNA levels of Sox2, Nanog and Ctnnb1 were determined in PY8119 tumor (n = 6). I Representative images of PYCR1, NANOG, SOX2 and β-Catenin IHC staining in PY8119 tumor. Scale bars, 50 μm. J Relative mRNA levels of PYCR1, stemness-related factors and cGMP-PKG signaling components were determined following PYCR1 knockdown and Epi treatment in MDA-MB-231 cells (n = 3). K Sphere formation ability was analyzed following PYCR1 knockdown and Epi treatment in MDA-MB-231 cells (n = 4). The representative images were presented (Upper, scale bar = 100 μm) and the number (Bottom Left) and diameter (Bottom Right) of spheroids were measured and counted. L Flow cytometry analysis for ALDH-positive cells in MDA-MB-231 cells following PYCR1 depletion and Epi treatment. Graph data were presented as mean ± SD. *P < 0.05, **P < 0.01, ***P < 0.001, ****P < 0.0001. P-values were calculated with two-tailed, unpaired Student’s t-test (C) or one-way ANOVA (D, E, F, H, J, K).
Fig. 6
Fig. 6. Clinical relevance of PYCR1 and cGMP-PKG signaling in breast cancer patients.
A, B Box plot comparison of PYCR1 expression in breast cancer based on individual cancer stages (A) and PAM50 breast cancer subtypes (B), ranked by median score within each subtype. These results are based upon data generated by the UALCAN Network (http://ualcan.path.uab.edu/). C Box and whisker plot comparison of PYCR1 expression according to TNBC status created using database bc-GenExMiner v4.8. D Immunoblot analysis of PYCR1, stemness-related factors and cGMP-PKG related components in adjacent normal tissues (N) and TNBC tumor tissues (C). E, F Kaplan–Meier overall survival (OS) (E) and relapse free survival (RFS) (F) plots of breast cancer patients created using Kaplan–Meier Plotter network. Patients were classified into PYCR1 high and PYCR1 low subgroups and analyzed as indicated. G, H Kaplan–Meier overall survival (G) and relapse free survival (H) plots of breast cancer patients created using Kaplan–Meier Plotter network. Patients were classified into PYCR1-GUCY1A2-PRKG2 high and PYCR1-GUCY1A2-PRKG2 low subgroups and analyzed as indicated. ****P < 0.0001.
Fig. 7
Fig. 7. Working model of PYCR1-synthesized proline highlights breast cancer stemness under psychological stress.
PYCR1-synthesized proline activates the cGMP-PKG signaling pathway to enhance TNBC stem-like properties under psychological stress. Targeting PYCR1-enhanced proline metabolic signaling provides a potential therapeutic approach for aggressive breast cancer patients undergoing psychological stress.

References

    1. Garrido-Castro AC, Lin NU, Polyak K. Insights into molecular classifications of triple-negative breast cancer: improving patient selection for treatment. Cancer Discov. 2019;9:176–98.. doi: 10.1158/2159-8290.CD-18-1177. - DOI - PMC - PubMed
    1. Malorni L, Shetty PB, De Angelis C, Hilsenbeck S, Rimawi MF, Elledge R, et al. Clinical and biologic features of triple-negative breast cancers in a large cohort of patients with long-term follow-up. Breast Cancer Res Treat. 2012;136:795–804. doi: 10.1007/s10549-012-2315-y. - DOI - PMC - PubMed
    1. Bianchini G, De Angelis C, Licata L, Gianni L. Treatment landscape of triple-negative breast cancer—expanded options, evolving needs. Nat Rev Clin Oncol. 2022;19:91–113. doi: 10.1038/s41571-021-00565-2. - DOI - PubMed
    1. Peitzsch C, Tyutyunnykova A, Pantel K, Dubrovska A. Cancer stem cells: the root of tumor recurrence and metastases. Semin Cancer Biol. 2017;44:10–24. doi: 10.1016/j.semcancer.2017.02.011. - DOI - PubMed
    1. Lee KM, Giltnane JM, Balko JM, Schwarz LJ, Guerrero-Zotano AL, Hutchinson KE, et al. MYC and MCL1 Cooperatively promote chemotherapy-resistant breast cancer stem cells via regulation of mitochondrial oxidative phosphorylation. Cell Metab. 2017;26:633–47.e7. doi: 10.1016/j.cmet.2017.09.009. - DOI - PMC - PubMed

Publication types