. 2023 Oct 16;14(1):6513.
doi: 10.1038/s41467-023-42196-4.

Fibrocystin/Polyductin releases a C-terminal fragment that translocates into mitochondria and suppresses cystogenesis

Affiliations

Fibrocystin/Polyductin releases a C-terminal fragment that translocates into mitochondria and suppresses cystogenesis

Rebecca V Walker et al. Nat Commun. .

Abstract

Fibrocystin/Polyductin (FPC), encoded by PKHD1, is associated with autosomal recessive polycystic kidney disease (ARPKD), yet its precise role in cystogenesis remains unclear. Here we show that FPC undergoes complex proteolytic processing in developing kidneys, generating three soluble C-terminal fragments (ICDs). Notably, ICD15, contains a novel mitochondrial targeting sequence at its N-terminus, facilitating its translocation into mitochondria. This enhances mitochondrial respiration in renal epithelial cells, partially restoring impaired mitochondrial function caused by FPC loss. FPC inactivation leads to abnormal ultrastructural morphology of mitochondria in kidney tubules without cyst formation. Moreover, FPC inactivation significantly exacerbates renal cystogenesis and triggers severe pancreatic cystogenesis in a Pkd1 mouse mutant Pkd1V/V in which cleavage of Pkd1-encoded Polycystin-1 at the GPCR Proteolysis Site is blocked. Deleting ICD15 enhances renal cystogenesis without inducing pancreatic cysts in Pkd1V/V mice. These findings reveal a direct link between FPC and a mitochondrial pathway through ICD15 cleavage, crucial for cystogenesis mechanisms.


Conflict of interest statement

The authors have no competing interests to declare.

Figures

Fig. 1
Fig. 1. Processing of native FPC generates C-terminal cleavage fragments in vivo, including ICD15 with an N-terminal mitochondrial targeting sequence.
a Diagram depicting the epitope positions of the anti-FPC antibodies, with PECD (magenta) and PTM (black) indicated. Figure created in BioRender. b Western blot of Pkhd1 KO, WT and HA P6 mouse kidneys using E1 (left panel) and anti-HA (right panel) antibodies. Various FPC products are indicated by (“a”–“f”), with corresponding ICD products marked by color-matched asterisks. Three independent experiments were performed, with similar results. c Western blot with E1. Six bands (“a”–“f”) are detected from WT (+) kidney lysates but not in lysates from knockout (-): The full-length (“a”), novel ~190 kDa band (“b”), PTM (“c”), and three small C-terminal bands at ~15 kDa (“d”), ~12 kDa (“e”), and 6 kDa (“f”) are indicated. A ladder of various low molecular weight constructs (MC to M-1) and the full-length FPC construct (FL) is used to map the size of the endogenous bands; their start sites are indicated in (d). Three separate experiments were performed, with similar results. d Functional motifs in mouse FPC C-terminal region. The predicted mitochondrial translocation sequence (MTS) is in red. The previously identified nuclear localization sequence (NLS) is blue and underlined. The transmembrane domain (TM) is enclosed in a box. The ciliary targeting sequence (CTS) is in green. The dashed box indicates the ICD15 region encoded by exon 67. The ladder construct start points are indicated for M-1 to MC for the ladder used in (c). e Sequence alignment of human and mouse FPC MTS. Non-identical amino acids are colored blue. p(Import): the probability of mitochondrial import. f Diagram of predicted FPC fragments indicating the position of the functional motifs and the Exon 67 encoded region, along with the labels of the respective bands. The predicted cleavage site in the extracellular domain is indicated. Figure created in BioRender. g Western blot of WT, +/-, ΔCT, and KO (-/-) P6 kidneys using E3, E4 and E1 antibodies. Loading control: β-Actin. Two separate experiments were performed, with similar results. Source data are provided as a Source Data file.
Fig. 2
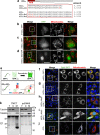
Fig. 2. Mitochondrial Translocation of FPC ICD15.
a Schematic diagram of mouse and human ICD15 constructs used in the study, with the MTS sequences and the predicted p(Import) to mitochondria shown. The mutant amino acids are shown in red. bd FPC ICD15 constructs tagged with GFP were transfected into mIMCD3 cells and imaged. Mitochondria are shown in red, and FPC-GFP constructs in green. A field of cells is shown in the first panel, scale bar 50 µm. Box highlights area of magnified cells. Scale bar 20 µm. Three separate experiments per construct were performed independently with similar results. e Schematic of the split-GFP β-barrel complementation (upper panel). FPC ICD15 fragment reconstitutes GFP barrel if mitochondria localization is achieved (lower panel). Figure created in BioRender. fj Images of GFP11-fused FPC ICD15 fragments and GFP1-10-fused mitochondria-localized mCherry in mIMCD3 cells. Leftmost image shows wide view merge, scale bar 10 µm. The three rightmost panels (GFP, mCherry, Merge) show a magnified image of the box in the first panel, scale bar 5 µm. Mouse and human ICD15 split GFP constructs used are indicated on the left. Panel j shows a GFP11-only Control. Three separate experiments per construct were performed independently with similar results. k Western blot of MDCK cell fractions from cells expressing mouse FPC C-terminal construct TMCT, spanning amino acids 3852–4059, with HA and V5 tags at the N- and C-termini, respectively. T total protein, C cytoplasmic fraction, M mitochondrial fraction. FPC was detected using E1 antibody. MDCK cells containing pcDNA5 vector were used as a negative control. Tubulin and TOM20 are loading controls. ICD15 (“d”), ICD12 (“e”), and ICD6 (“f”) are indicated. kDa sizes correspond to less accurate commercial protein ladder. Three independent experiments per construct were performed with similar results. Source data are provided as a Source Data file.
Fig. 3
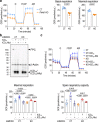
Fig. 3. Expression of ICD15 enhances mitochondrial function through mitochondrial translocation in cultured renal epithelial cells.
a Left: analysis of oxygen consumption rate (OCR) measurement of a representative experiment in Pkhd1 KO and wild-type control (CT) mIMCD3 clones in basal condition and after sequential addition of oligomycin (O), FCCP and antimycin A/rotenone (A/R). Right: quantification of basal and maximal respiration of OCR measurements in left. Data are mean ± standard deviation of technical replicates (CT, n = 11 and KO, n = 14), statistical analysis: Two-tailed t-test, ****p < 0.0001. Results are representative of three independent experiments, each performed in n = 10–16 technical replicates. b The Western blot analysis using E1 revealed comparable expression levels of mouse ICD15 and ICD15-Mut constructs in both CT and Pkhd1 KO mIMCD3 cells. Loading control: β-Actin. c Analysis of OCR measurement of a representative experiment in CT and Pkhd1 KO mIMCD3 cells with or without expression of mouse ICD15 or ICD15-Mut as indicated, in basal condition and after sequential addition of the mitochondrial inhibitors as indicated. Lower two panels: Quantification of maximal respiration (left) and spare respiratory capacity (right) of OCR measurements. Data are mean ± standard deviation of technical replicates (from left to right, CT, n = 14, 12 and 11, KO, n = 14, 15 and 14); statistical analysis: one-way ANOVA. Maximal respiration, *p = 0.0264, **p = 0.0038, ****p < 0.0001. Spare respiratory capacity, *p = 0.0416, **p = 0.0017 (KO, -ICD15 vs +ICD15-Mut), **p = 0.0019 (KO, +ICD15 vs +ICD15-Mut), ****p < 0.0001. Results for control cells are representative of five out of five independent experiments, and results for Pkhd1 KO cells are representative of three out of five independent experiments, each performed in n = 10–16 technical replicates. Source data are provided as a Source Data file.
Fig. 4
Fig. 4. Ultrastructural alteration of mitochondria of Pkhd1 KO kidney tubules.
ad Electron micrographs of WT and Pkhd1 KO kidney proximal tubules. a WT proximal tubule identified by brush border (BB) at the center of the lumen. Scale bar 2 μm. The area outlined in the white box is magnified in (b). b Magnified area of WT image. Scale bar 500 nm. c KO proximal tubule identified by brush border (BB) at the center of the lumen. Scale bar 2 μm. The area outlined in the white box is magnified in (d). d Magnified area of KO image. Scale bar 500 nm. eh Graphs depicting shape descriptors. e Area, (f) Perimeter, (g) Circularity, and (h) Solidity. A total of 962 mitochondria were measured from 3 kidneys, using images from 3–5 proximal tubules per kidney. Points on each graph represent the average for each kidney measured and the bar represents the average of all mitochondria measured. Error bars represent the standard error of the mean (SEM). P-values were derived by Student’s t-test. il Electron micrographs of mitochondria in WT and Pkhd1 KO kidney proximal tubules. i WT mitochondria. Scale bar 100 nm. k Magnification of WT cristae. Scale bar 100 nm. j KO mitochondria. Scale bar 100 nm. l Magnification of KO cristae. Scale bar 100 nm. m Graph shows average cristae diameter in nm. Each point represents the average diameter of cristae in a single mitochondrion. 50 mitochondria measured per genotype. Error bars represent SEM. P-values were derived by Student’s t-test. Source data are provided as a Source Data file.
Fig. 5
Fig. 5. Pkhd1 mutations enhance the Pkd1V/V cystic kidney phenotype without altering mutant PC1V.
ad Hematoxylin and eosin (H&E) staining of representative P0 kidney sections of WT and single mutant genotypes. a WT, (b) Δ3–4 (Pkhd1Δ3-43-4), (c) KO (Pkhd1LSL/LSL), (d)V (Pkd1V/V). Scale bar 500 µm. Inset: whole kidney slice, scale bar 1 mm. eh Lectin staining of representative P0 kidney tubule sections of the corresponding genotypes. White asterisks in h indicate cysts. Proximal tubule marked by Lotus tetragonolobus lectin (LTL)-green, distal tubule/collecting duct marked by Dolichos biflorus agglutinin (DBA)-red. Scale bar 200 µm. il H&E staining of representative kidney sections of digenic homozygote kidneys. i Δ3–4/V at P0,(j) Δ3–4/V at E17.5,(k)KO/V at P0,(l)KO/V at E17.5. Scale bar 500 µm. Glomerular cysts are indicated by green arrows. Inset whole kidney slice, scale 1 mm. mp Lectin staining of kidney tubules of the corresponding genotypes. Scale bar 200 µm. 5–10 embryos were examined per genotype. q Western blot of P2 Pkhd1 KO, WT, and Δ3–4 kidney lysates using E1. Loading control: β-Actin. r Western blot of WT and Pkhd1 KO kidney lysates and isolated tubule fragments (P6) using anti-PC1 antibody E8 (left panel). Loading controls: β-actin and E-cadherin. Right panel shows a graph of isolated renal tubule samples, scale bar 200 μm. The tubule samples were validated by western blots with indicated nephron segment markers: Aminopeptidase N (APN), proximal tubules; Tamm-Horsfall glycoprotein/Uromodulin (THP), thick ascending limb; aquaporin 2 (AQP2), collecting duct. s Western blot using E8 on WT, Pkd1V/+, and Pkhd1Δ3-43-4;Pkd1V/+ (Δ3–43–4;Pkd1V/+) P2 kidney isolates after incubation with buffer only (-), PNGase (P) or EndoH (E). Equal amounts of protein were loaded. PC1V-R indicates the EndoH-resistant PC1V. PC1U/V-S indicates EndoH-sensitive PC1U or PC1V. PC1CTF is detected in all three samples. Red box around CTF is shown at a higher exposure below. Note: an endogenous band at ~160 kD cross-reacts with E8 as previously shown,, indicated by X (this can be used as a loading control). All experiments were conducted with 2-3 repetitions with consistent results. Source data are provided as a Source Data file.
Fig. 6
Fig. 6. The impact of ICD15 deletion on the cystic phenotype of the kidney and pancreas in Pkd1V/V mice.
ac Hematoxylin and eosin (H&E) of representative P0 kidney sections, scale bar 500 µm. Inset: whole kidney slice, scale bar 1 mm. a WT, (b) ΔCT (Pkhd1Δ67/Δ67), (c) ΔCT/V (Pkhd1Δ67/Δ67;Pkd1V/V). df Lectin staining of kidney tubules;(d) WT, (e) ΔCT, (f) ΔCT/V, scale bar 200 µm. Proximal tubule marked by Lotus tetragonolobus lectin (LTL)-green, distal tubule/collecting duct marked by Dolichos biflorus agglutinin (DBA)-red. g Graph representing cystic area in %. WT n = 10 mice, ΔCT n = 13 mice, ΔCT/V n = 8 mice, V (Pkd1V/V) n = 10 mice. Error bars represent SEM. ho H&E staining of representative pancreas sections at E17.5, scale bar 500 µm. Pancreas is outlined with a green line. Of note, loss of FPC, but not deletion of ICD15, results in massive cystic dilation of the pancreas in Pkd1V/V mutant mice. h WT, (i)Δ3–4 (Pkhd1Δ3-43-4), (j)KO (Pkhd1LSL/LSL), (k) ΔCT (Pkhd1Δ67/Δ67), (l) V (Pkd1V/V), (m) Δ3–4/V (Pkhd1Δ3-43-4;Pkd1V/V) cystic pancreas, (n) KO/V (Pkhd1LSL/LSL;Pkd1V/V) cystic pancreas, (o) ΔCT/V (Pkhd1Δ67/Δ67;Pkd1V/V) non-cystic pancreas. At least 5 animals per genotype were independently examined with consistent results. Source data are provided as a Source Data file.
Fig. 7
Fig. 7. Model of FPC and Polycystin-1 interaction in the pathogenesis of polycystic kidney disease via a cilia-mitochondria connection.
a In WT kidney, the ciliary component of the cilia-dependent cyst activation (CDCA) signal is repressed by ciliary Polycystins, cellular Polycystins, and ciliary FPC. FPC cleavage produces ICD15. ICD15 translocates to mitochondria and produces ICD12, which inhibits the propagation of the CDCA signal. The C-terminal tail (CTT) of PC1 may also enter mitochondria and inhibit the propagation of CDCA. These factors lead to the regulation of normal tubule diameter. b In Pkd1V/V kidney, PC1V exhibits impaired localization to the cilia,. The CDCA is activated but its activity is suppressed by PC1V in the cell body and by both its CTT and ICD15 in mitochondria, leading to modest cystogenesis. c In ΔCT/V (Pkhd1Δ67/Δ67;Pkd1V/V) kidney, in addition to the activation of CDCA by loss of ciliary PC1, ICD15 and ICD12 cannot be produced and cannot inhibit the propagation of the CDCA signal, resulting in enhanced cystogenesis compared with Pkd1V/V single mutants. However, FPC-ΔCT is still able to localize to the cilium and reduce CDCA. d In KO/V (Pkhd1-/-;Pkd1V/V) kidney, the only remaining inhibition to the CDCA comes from extra-ciliary PC1V and possibly its CTT in mitochondria; thus cystogenesis is severe. e Summary of the model. FPC and PC1 work together to prevent the initiation and propagation of the cystogenic signal generated in cilia. Figure created in BioRender.

References

    1. Harris PC, Torres VE. Polycystic kidney disease. Annu Rev. Med. 2009;60:321–337. - PMC - PubMed
    1. Igarashi P, Somlo S. Genetics and pathogenesis of polycystic kidney disease. J. Am. Soc. Nephrol. 2002;13:2384–2398. - PubMed
    1. Guay-Woodford LM. Autosomal recessive polycystic kidney disease: the prototype of the hepato-renal fibrocystic diseases. J. Pediatr. Genet. 2014;3:89–101. - PMC - PubMed
    1. Hartung EA, Guay-Woodford LM. Autosomal recessive polycystic kidney disease: a hepatorenal fibrocystic disorder with pleiotropic effects. Pediatrics. 2014;134:e833–e845. - PMC - PubMed
    1. Nakanishi K, Sweeney WE, Jr., Zerres K, Guay-Woodford LM, Avner ED. Proximal tubular cysts in fetal human autosomal recessive polycystic kidney disease. J. Am. Soc. Nephrol. 2000;11:760–763. - PubMed

Publication types

Substances