. 2023 Oct 16;14(1):6505.
doi: 10.1038/s41467-023-41840-3.

Molecular landscape and functional characterization of centrosome amplification in ovarian cancer

Affiliations

Molecular landscape and functional characterization of centrosome amplification in ovarian cancer

Carolin M Sauer et al. Nat Commun. .

Abstract

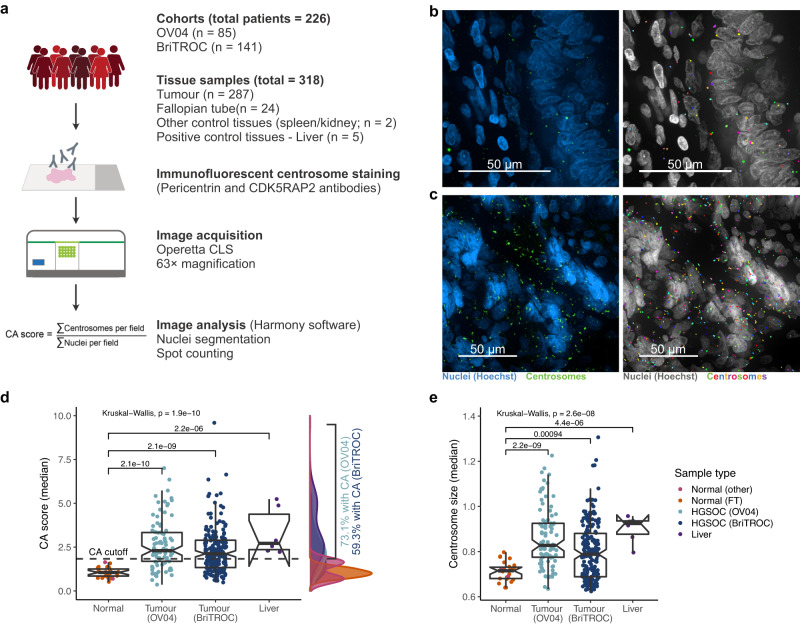
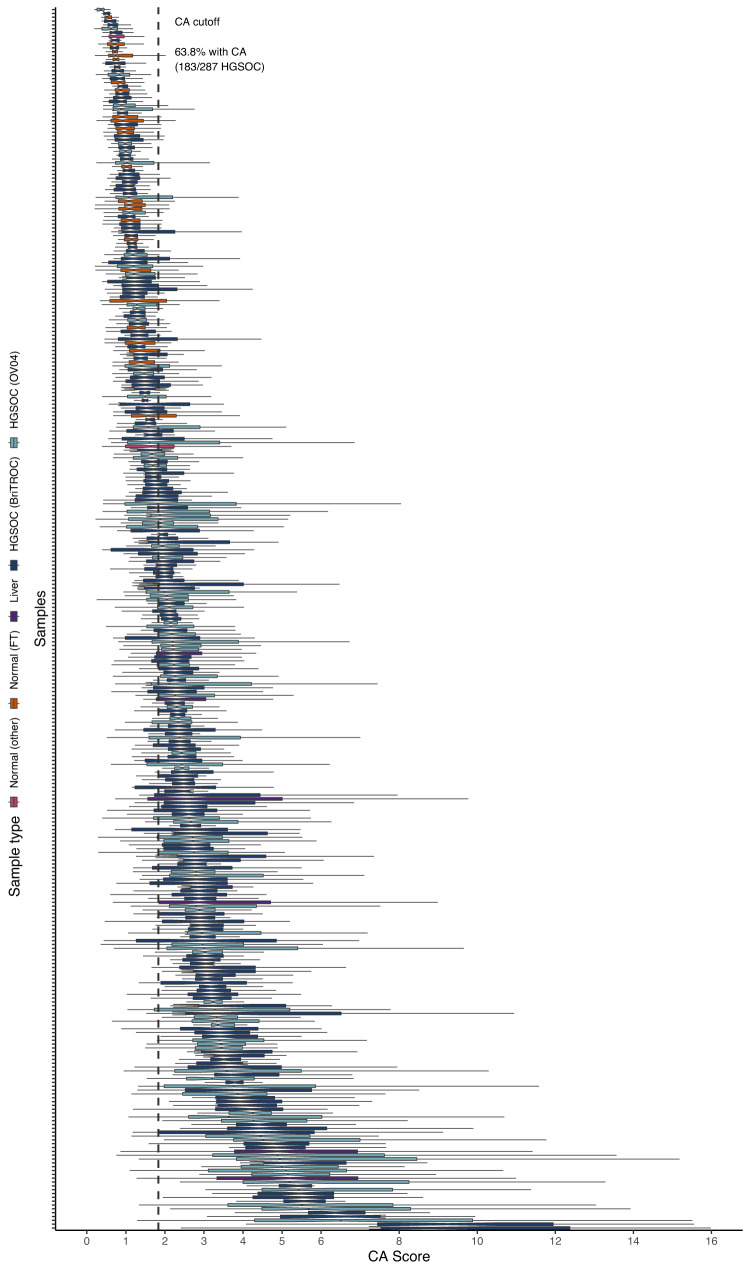
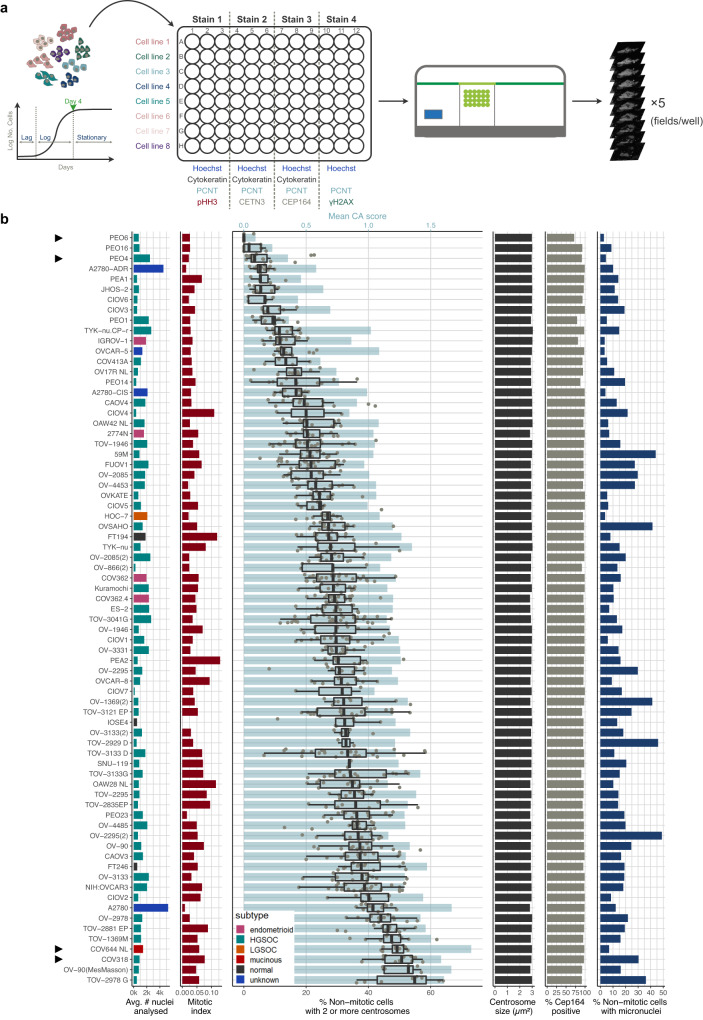
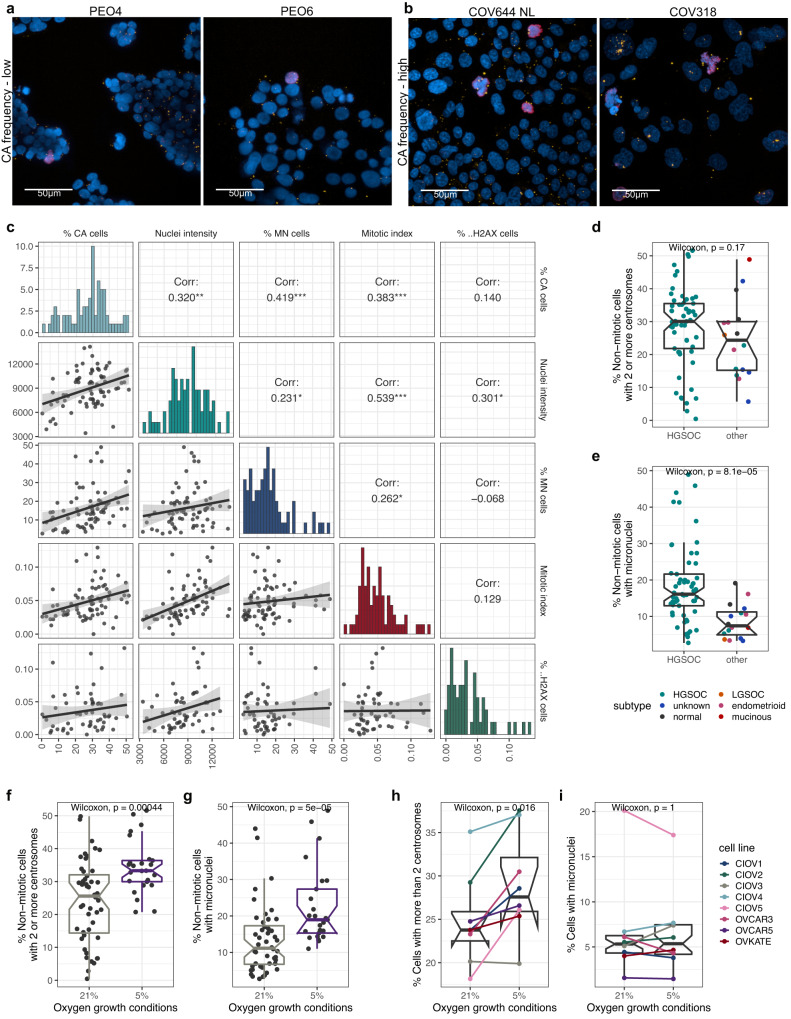
High-grade serous ovarian carcinoma (HGSOC) is characterised by poor outcome and extreme chromosome instability (CIN). Therapies targeting centrosome amplification (CA), a key mediator of chromosome missegregation, may have significant clinical utility in HGSOC. However, the prevalence of CA in HGSOC, its relationship to genomic biomarkers of CIN and its potential impact on therapeutic response have not been defined. Using high-throughput multi-regional microscopy on 287 clinical HGSOC tissues and 73 cell lines models, here we show that CA through centriole overduplication is a highly recurrent and heterogeneous feature of HGSOC and strongly associated with CIN and genome subclonality. Cell-based studies showed that high-prevalence CA is phenocopied in ovarian cancer cell lines, and that high CA is associated with increased multi-treatment resistance; most notably to paclitaxel, the commonest treatment used in HGSOC. CA in HGSOC may therefore present a potential driver of tumour evolution and a powerful biomarker for response to standard-of-care treatment.


Conflict of interest statement

J.D.B. is a co-founder and shareholder of Tailor Bio Ltd. There are no further conflicts of interests to declare.

Figures

Fig. 1
Fig. 1. Centrosome characterisation in HGSOC tissue samples.
a Basic workflow of centrosome characterisation in clinical tissue samples (also see Supplementary Methods). Example confocal immunofluorescent images (max. intensity projections) of a fallopian tube and HGSOC tissue are shown in (b) and (c), respectively (left panel). Nuclei are shown in blue, centrosomes are shown in green. Individually detected centrosomes following automated image analysis are highlighted in rainbow colours (right panel; nuclei shown in grey). Scale bars = 50 µm. d, e show sample type comparison of centrosome amplification (CA) scores and centrosome size, respectively. Sample types are indicated by different colours: Normal (other), pink, n = 2; Normal (FT), orange, n = 24; HGSOC (OV04), light blue, n = 93; HGSOC (BriTROC), dark blue, n = 194; Liver, purple, n = 5. Statistics shown is a Kruskal–Wallis one-way analysis of variance test. Boxplots show 25th, 50th and 75th centiles; whiskers indicate 75th centile plus 1.5 × inter-quartile range and 25th centile less 1.5 × inter-quartile range. Notches on boxes extend 1.58 × inter-quartile range/sqrt(n) approximating to the 95% confidence interval for comparing medians. Dashed horizontal line indicates CA cutoff threshold of ~1.83. Source data are provided as a Source Data file.
Fig. 2
Fig. 2. Centrosome amplification profiles across 318 tissue samples.
Centrosome amplification scores across 287 HGSOC tissue samples, 24 fallopian tube, 1 spleen, 1 kidney, and 5 liver samples. Each boxplot represents CA scores across up to 50 imaging fields from individual tissue samples. Different tissue types are indicated by different colours. Dashed vertical line indicates the CA cutoff threshold of ~1.83. Samples with median CA scores > CA cutoff were considered to have significant CA. Boxplots show 25th, 50th and 75th centiles; whiskers indicate 75th centile plus 1.5 × inter-quartile range and 25th centile less 1.5 × inter-quartile range. Notches on boxes extend 1.58 × inter-quartile range/sqrt(n) approximating to the 95% confidence interval for comparing medians. Source data are provided as a Source Data file.
Fig. 3
Fig. 3. Centrosome amplification shows inter- and intra-tissue heterogeneity.
Spatial heatmap of centrosome amplification in a normal fallopian tube (a) and HGSOC tumour tissue (b). Additional examples are shown in Supplementary Fig. 1. CA scores are indicated by a colour gradient (purple = low, yellow = high) for each imaging field. Points represent individual nuclei detected during image analyses and were plotted in relation to their physical position (µm) on the microscope slide (x and y axis). Note that CMYK printing may obscure differences on the CA score colour scale. c Comparison of CA scores across tissues collected from individual patients in a total of 36 cases. Red stars indicate CA score medians for patient with multiple tissue samples. d Comparison of CA scores across different tissue sites (n = 287 individual samples; BriTROC, n = 194; OV04, n = 93). e Comparison of CA tissue heterogeneity across different tissue sites (n = 287 individual samples; BriTROC, n = 194; OV04, n = 93). Statistics shown for (d) and (e) is a Kruskal–Wallis one-way analysis of variance test. Tissue sites are indicated by different shapes. Cohorts are indicated by teal (OV04) and light blue (BriTROC) colours. Dashed horizontal lines indicate the CA score cutoff of ~1.83. Boxplots show 25th, 50th and 75th centiles; whiskers indicate 75th centile plus 1.5 × inter-quartile range and 25th centile less 1.5 × inter-quartile range. Notches on boxes extend 1.58 × inter-quartile range/sqrt(n) approximating to the 95% confidence interval for comparing medians. Source data are provided as a Source Data file.
Fig. 4
Fig. 4. Centrosome amplification is not associated with clinical features and disease outcome in HGSOC.
Comparison of CA scores across different (a) histotypes, (b) disease stages at diagnosis, (c) germline BRCA1/BRCA2 mutation status, and (d) surgery types during sample collection (IPS = immediate primary surgery; DPS = delayed primary surgery). e Comparison of CA tissue heterogeneity in IPS vs. DPS cases. f Comparison of mean centrosome size in IPS vs. DPS cases. Boxplots show 25th, 50th and 75th centiles; whiskers indicate 75th centile plus 1.5 × inter-quartile range and 25th centile less 1.5 × inter-quartile range. Notches on boxes extend 1.58 × inter-quartile range/sqrt(n) approximating to the 95% confidence interval for comparing medians. a,df show unpaired two-sided Wilcoxon tests. bc Statistics shown is a Kruskal–Wallis one-way analysis of variance test. af depict 287 individual tumour samples (BriTROC, n = 194; OV04, n = 93). OV04 samples are shown in light blue, BriTROC samples are shown in dark blue. Note that for patients with multiple tissue samples, the median CA score across these tissues was used. Source data are provided as a Source Data file. gh Forest plots of multivariable Cox proportional hazard modelling on overall survival for OV04 and BriTROC patients respectively with and without CA. Adjusted covariates included surgery type, stage and age. Squares display the hazard ratio (HR) and whiskers the 95% confidence intervals of the HR. p-values shown are derived from likelihood ratio tests.
Fig. 5
Fig. 5. In-depth imaging-based characterisation of ovarian cancer cell lines.
a Cell line characterisation workflow. Growth curves were estimated for each cell line to determine optimal seeding densities. Cells were then seeded according to estimated seeding densities into an optical, poly-L-lysine coated 96 well plate and incubated for 4 days until they reached confluence (late Log/early Stationary phase). Cells were fixed with 100% methanol and stained against indicated proteins. For each well, five independent fields were imaged using the indicated Operetta CLS™ system (40× confocal water objective). b Immunofluorescent imaging results for 73 screened cell lines ordered by the median percentage of nonmitotic cells with 2 or more centrosomes (boxplots). Boxplots show 25th, 50th and 75th centiles; whiskers indicate 75th centile plus 1.5 × inter-quartile range and 25th centile less 1.5 × inter-quartile range. . Cell lines highlighted by grey arrowheads are depicted in Fig. 6a-b. Panel 1 shows the average number of nuclei included in each of the four staining screens. Bar plots are coloured by cell line subtype. Panel 2 indicates the mitotic index for each cell line. The fraction of non-mitotic cells with two or more centrosomes is shown in panel 3 (boxplots). Each point represents an individual imaging field. The mean (population wide) CA score ( = CentrosomesNuclei) is shown by light blue bars. Panel 4 shows the centrosome size (estimated from max. intensity projection images), and panel 4 indicates the percentage of CEP164-positive centrosomes. Micronuclei (MN) frequencies, estimated as percentage of non-mitotic cells with at least one or more MN, are shown in panel 6. Source data are provided as a Source Data file.
Fig. 6
Fig. 6. Centrosome amplification is associated with increased micronuclei frequencies and can be induced by low oxygen growth conditions.
Confocal immunofluorescent staining images (zoomed in from 40× max. intensity projection images) for (a) CA-low and (b) CA-high cell lines as highlighted in Fig. 5b. Cells were stained for Pericentrin (yellow), pHH3 (phospho-histone H3; mitotic cells; red), and DNA (Hoechst; blue). Scale bar = 50 µm. c Cell line characterisation correlation plot showing Spearman’s rank correlations (two-sided) of analysed immunofluorescent staining results. P-values: *** p < 0.001; ** p < 0.01; * p < 0.05;. p < 0.1. Error bands show 95% confidence intervals. de Cell line subtype comparison of centrosome amplification and micronuclei frequencies, respectively (n = 73 individual cell lines; HGSOC, n = 57; other, n = 16). Histological subtypes are indicated by different colours. Note that the three “normal” cell lines were grouped together with other subtypes, as these cell lines are transformed and show some cancer characteristics. fg Centrosome amplification and micronuclei frequencies, respectively, in cell lines grown at 21% vs. 5% oxygen (n = 73 individual cell lines; 21% oxygen, n = 48; 5% oxygen, n = 25). hi Cell lines, which are normally grown in normoxic conditions (21% oxygen), were transferred into 5% oxygen and centrosome amplification (h) and micronuclei frequencies (i) were estimated. Results depict unpaired two-sided Wilcoxon tests. Boxplots show 25th, 50th and 75th centiles; whiskers indicate 75th centile plus 1.5 × inter-quartile range and 25th centile less 1.5 × inter-quartile range. Notches on boxes extend 1.58 × inter-quartile range/sqrt(n) approximating to the 95% confidence interval for comparing medians. Experiments were performed in four biological repeats for each cell line (n = 8), and four individual imaging fields were analysed for each repeat of each cell line. Data plotted shows the mean across all repeats. Source data are provided as a Source Data file.
Fig. 7
Fig. 7. Differential gene expression in cells with high centrosome amplification and micronuclei frequencies.
Differential gene expression volcano plots of all genes significantly regulated by (a) CA and (b) MN frequencies (high vs. low; median split). FDR < 0.1 highlighted in lightblue/blue. The top 25 most significantly up- or downregulated genes are labelled. c,d Gene set enrichment analysis (GSEA) of centrosome and micronuclei high vs. low cell lines, showing hallmark pathways for which p < 0.05 and FDR < 0.1. Examples of enrichment score plots for centrosome and micronuclei GSEA pathway results are shown in (e) and (f), respectively. Light blue/blue lines illustrate the running sum for each gene set shown. Maximum and minimum enrichment score (ES) are indicated by orange dotted lines. Leading-edge gene subset is indicated by vertical black lines. Source data are provided as a Source Data file. Gene set enrichment analysis and testing was performed using the fgsea R package.
Fig. 8
Fig. 8. Genomic characterisation of centrosome amplification and micronuclei.
a Correlation of centrosome amplification (CA) with cell line ploidy. bd Correlations of cell line tMAD scores with CA frequencies, micronuclei (MN) frequencies and CA × MN (combined) frequencies, respectively. tMAD = trimmed median absolute deviation from copy number neutrality. Note that normal cell lines were excluded from this analysis. ef Correlations of copy number signature exposures with CA and MN frequencies, respectively. Different signatures are indicated by colours. Intercepts and coefficients (slopes; depicted as dots) and their standard errors of the fixed effect model of ALR-transformed copy number signature data for CA and MN frequencies are shown in (g) and (h). ij Correlations of genome subclonality estimated from ACN fits with CA and MN frequencies. Results are shown for n = 59 cell lines (for which matching sWGS and imaging data was available). All correlation coefficients were estimated using Spearman’s rank correlations (two-sided). Boxplots show 25th, 50th and 75th centiles; whiskers indicate 75th centile plus 1.5 × inter-quartile range and 25th centile less 1.5 × inter-quartile range. Notches on boxes extend 1.58 × inter-quartile range/sqrt(n) approximating to the 95% confidence interval for comparing medians. . Error bands show 95% confidence intervals. Source data are provided as a Source Data file.
Fig. 9
Fig. 9. Cell lines with high centrosome amplification show decreased drug sensitivities.
a Ovarian cancer cell line drug-screen overview showing drugs used in our drug sensitivity assay and their respective targets within the cell cycle. b Variation in potency and efficacy of selected drugs a cross all tested ovarian cancer cell lines (n = 14). Colours of boxplots indicate drug targets as shown in panel a. Boxplots show 25th, 50th and 75th centiles; whiskers indicate 75th centile plus 1.5 × inter-quartile range and 25th centile less 1.5 × inter-quartile range. Notches on boxes extend 1.58 × inter-quartile range/sqrt(n) approximating to the 95% confidence interval for comparing medians. c Correlation of centrosome amplification frequencies and drug potency (GR50; top panel) and drug efficacy (GRmax; bottom panel). Spearman’s rank correlations (two-sided) are shown for each drug. Drug agents are colour-coded according to their respective drug target groups. Note that higher GR values correspond to lower potency or efficacy. The signs of GRmax values indicated drug response: GRmax > 0 indicates partial growth inhibition; GRmax = 0 indicates complete cytostasis; GRmax <0 indicates cell death (cytotoxicity). Error bands show 95% confidence intervals. Source data are provided as a Source Data file.

References

    1. Morden, C. R. et al. Chromosome instability is prevalent and dynamic in high-grade serous ovarian cancer patient samples. Gynecol. Oncol.10.1016/j.ygyno.2021.02.038 (2021). - PubMed
    1. Ippolito MR, et al. Gene copy-number changes and chromosomal instability induced by aneuploidy confer resistance to chemotherapy. Dev. Cell. 2021;56:2440–2454.e6. doi: 10.1016/j.devcel.2021.07.006. - DOI - PubMed
    1. Kim C, et al. Chemoresistance Evolution in Triple-Negative Breast Cancer Delineated by Single-Cell Sequencing. Cell. 2018;173:879–893.e13. doi: 10.1016/j.cell.2018.03.041. - DOI - PMC - PubMed
    1. Lee AJX, et al. Chromosomal instability confers intrinsic multidrug resistance. Cancer Res. 2011;71:1858–1870. doi: 10.1158/0008-5472.CAN-10-3604. - DOI - PMC - PubMed
    1. Lukow DA, et al. Chromosomal instability accelerates the evolution of resistance to anti-cancer therapies. Dev. Cell. 2021;56:2427–2439.e4. doi: 10.1016/j.devcel.2021.07.009. - DOI - PMC - PubMed

Publication types