. 2023 Nov;25(11):1691-1703.
doi: 10.1038/s41556-023-01253-2. Epub 2023 Oct 16.

Adaptive preservation of orphan ribosomal proteins in chaperone-dispersed condensates

Affiliations

Adaptive preservation of orphan ribosomal proteins in chaperone-dispersed condensates

Asif Ali et al. Nat Cell Biol. 2023 Nov.

Abstract

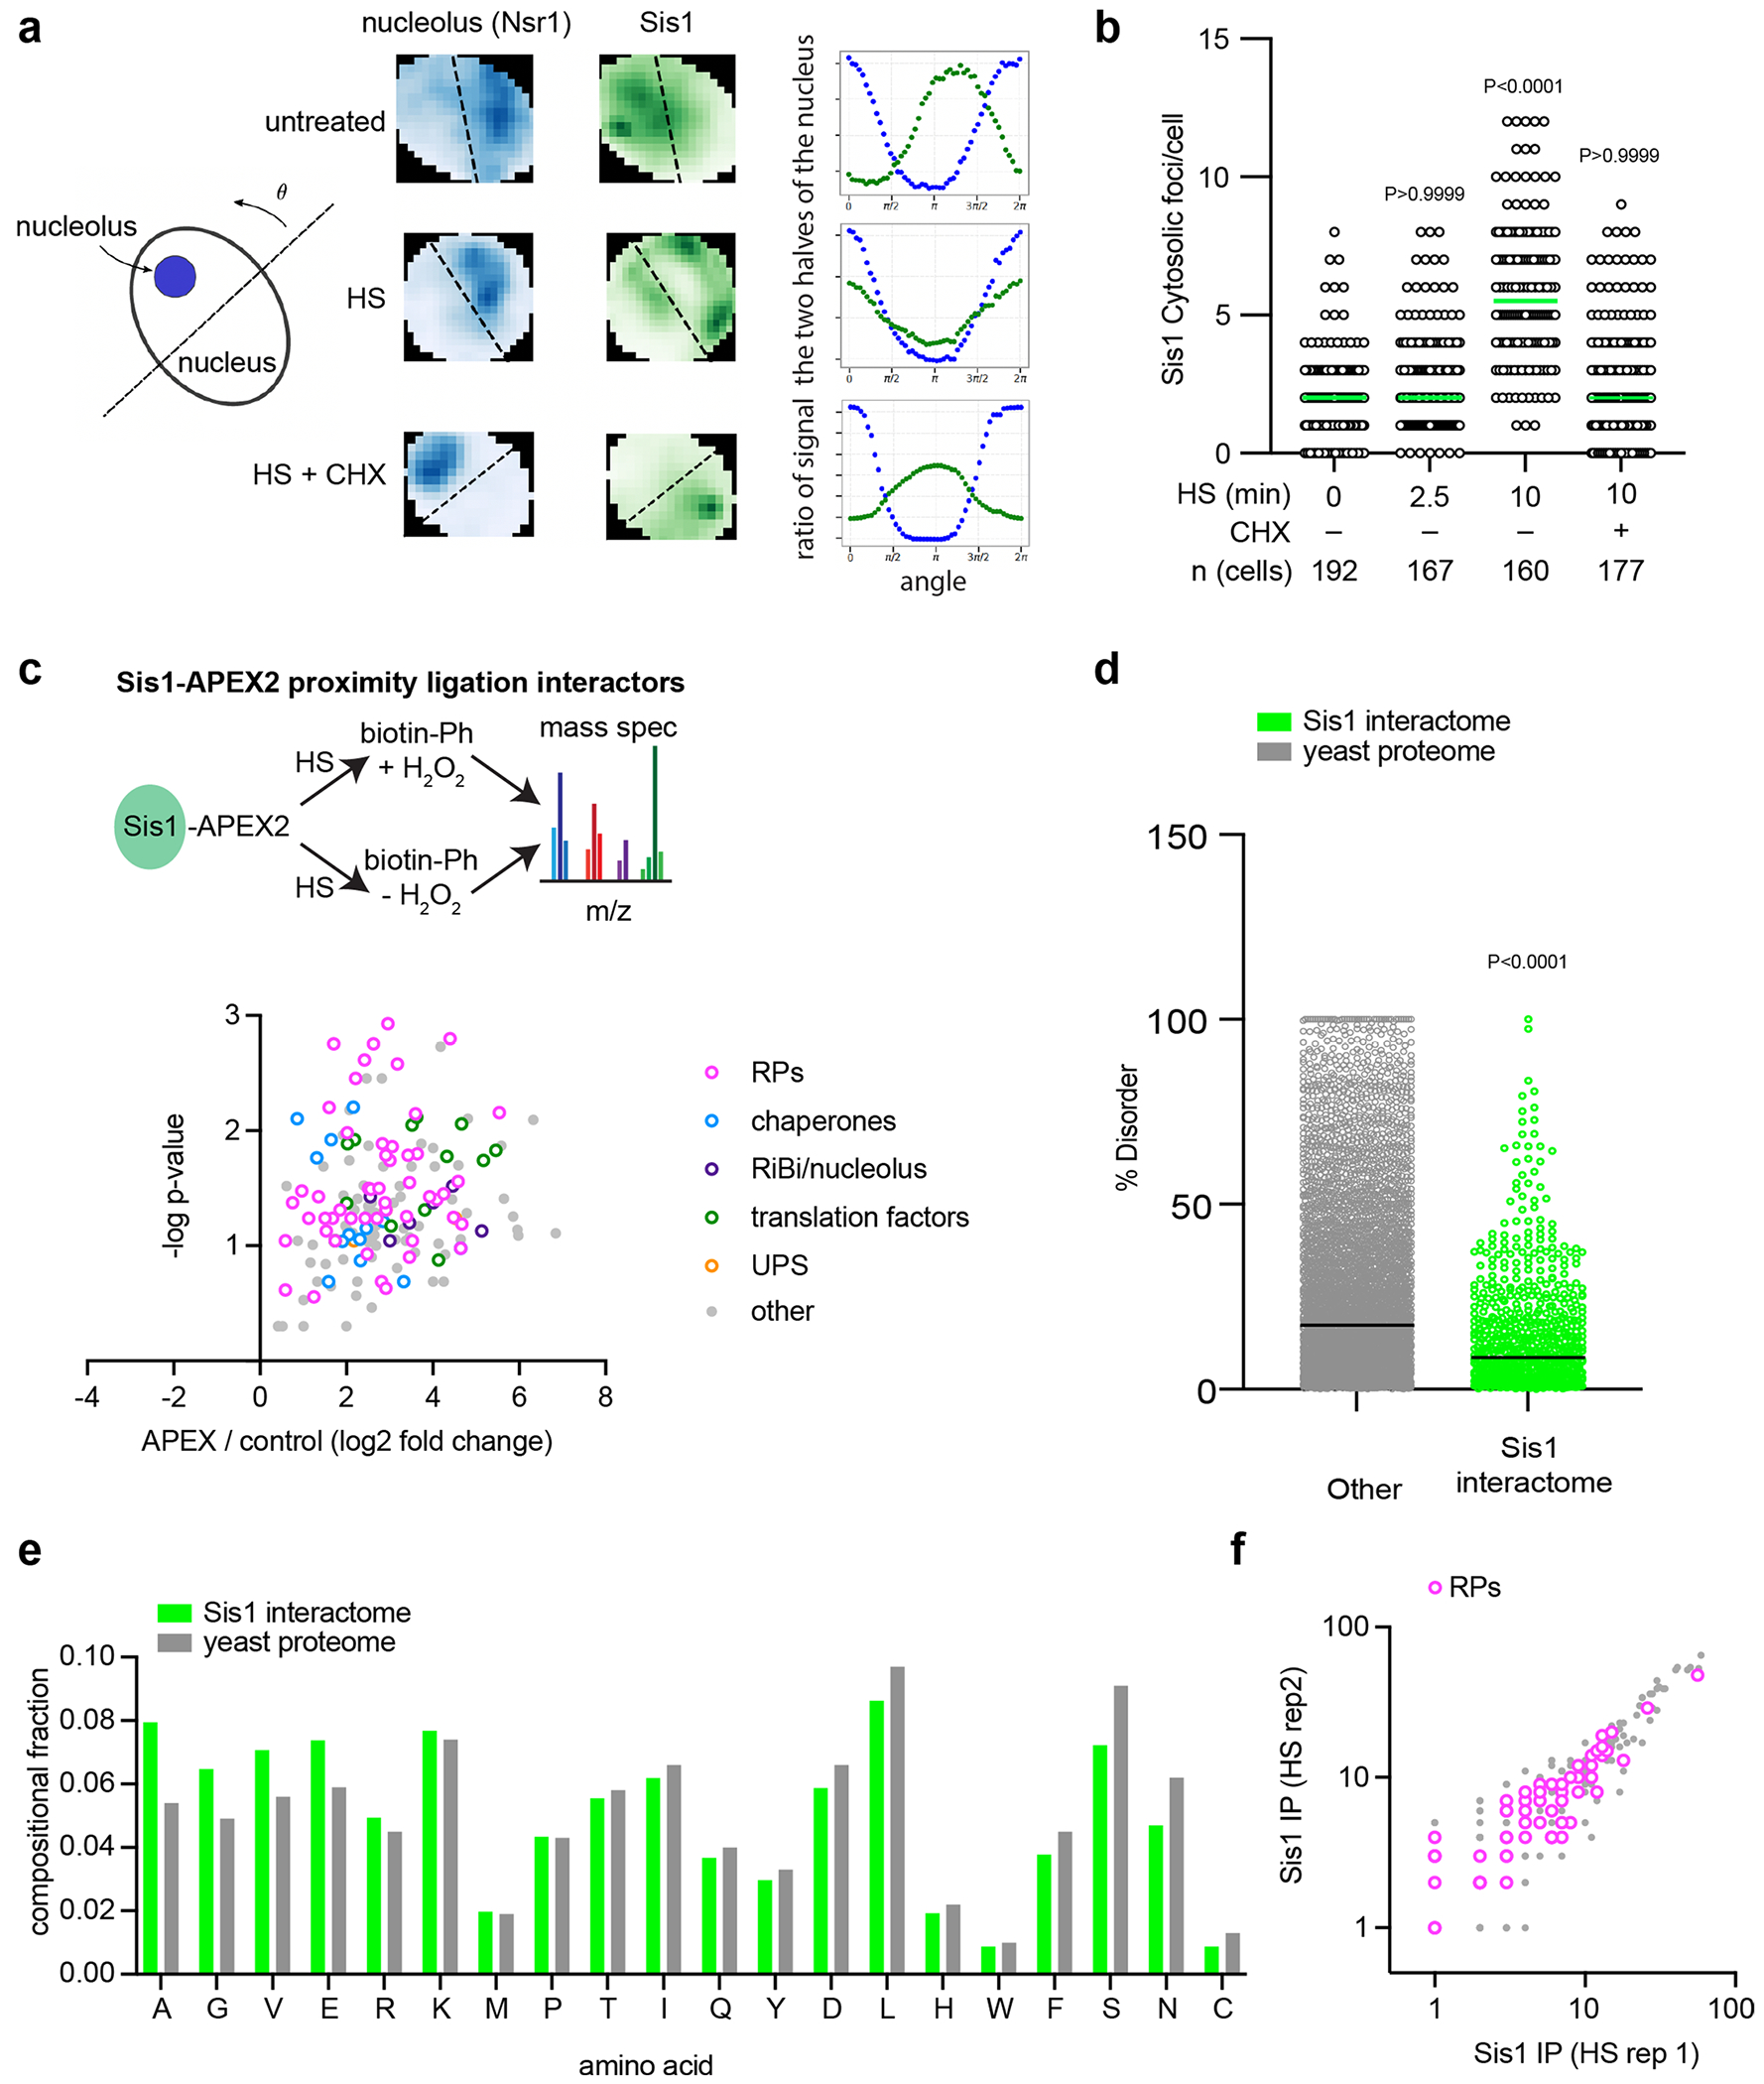
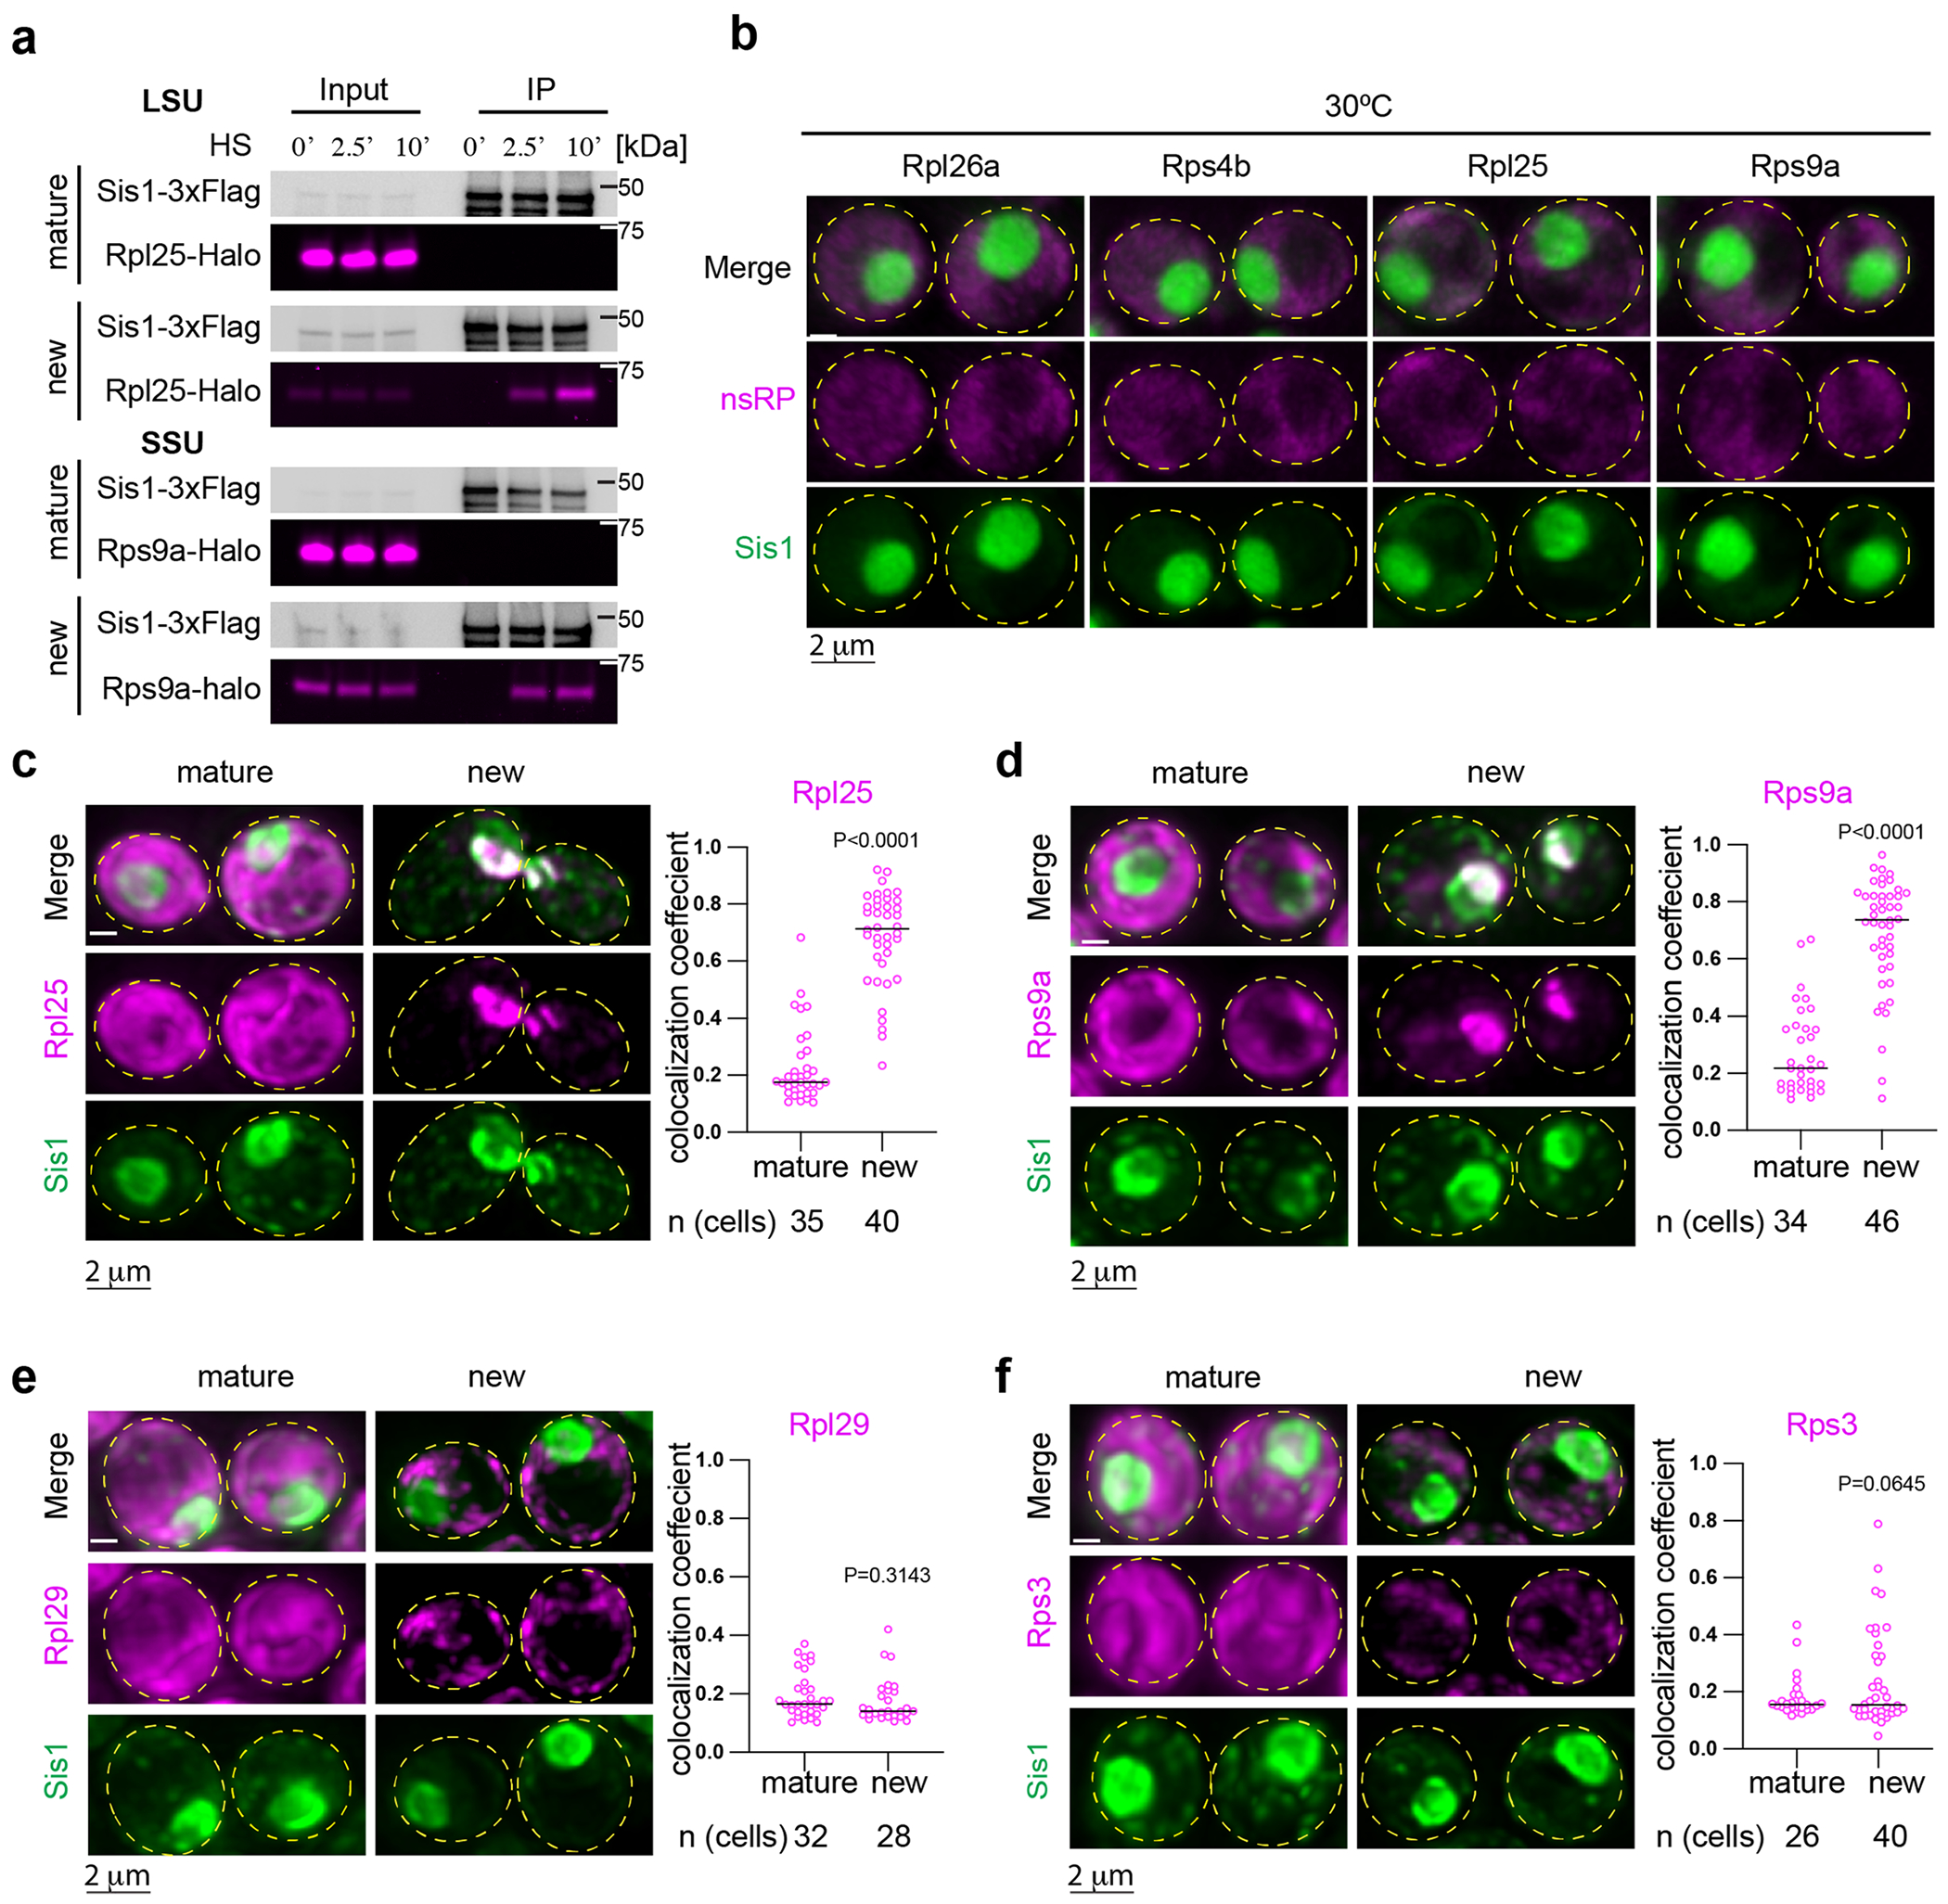
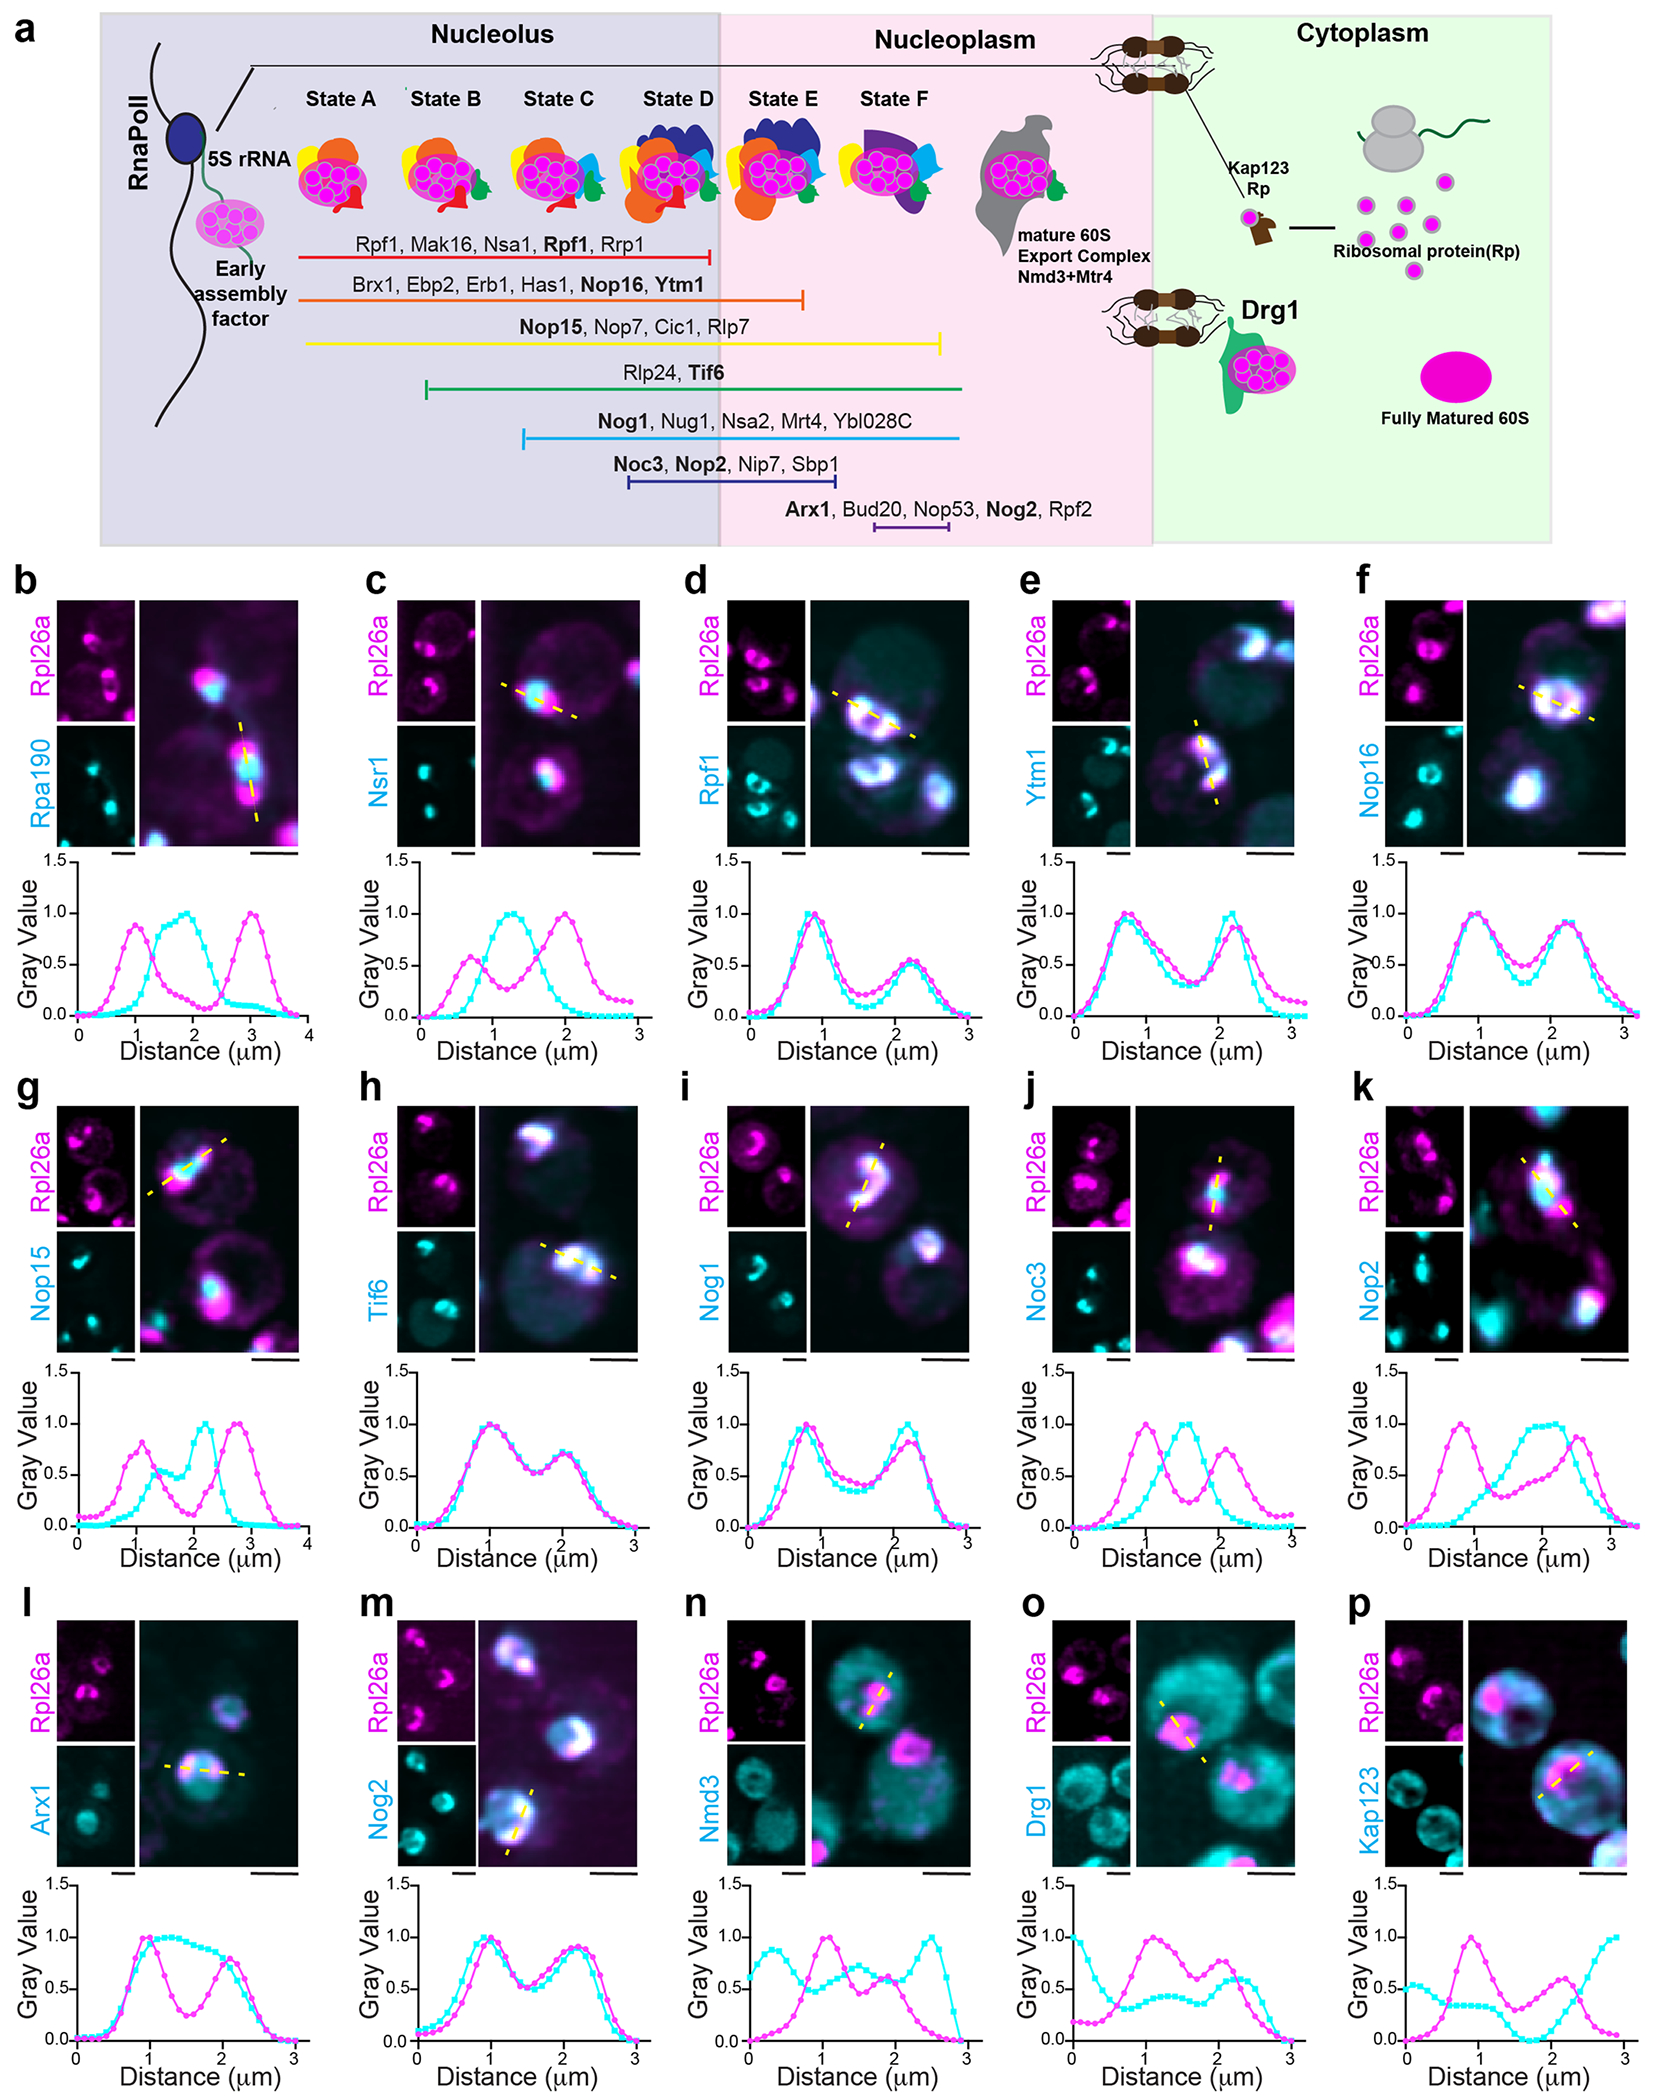
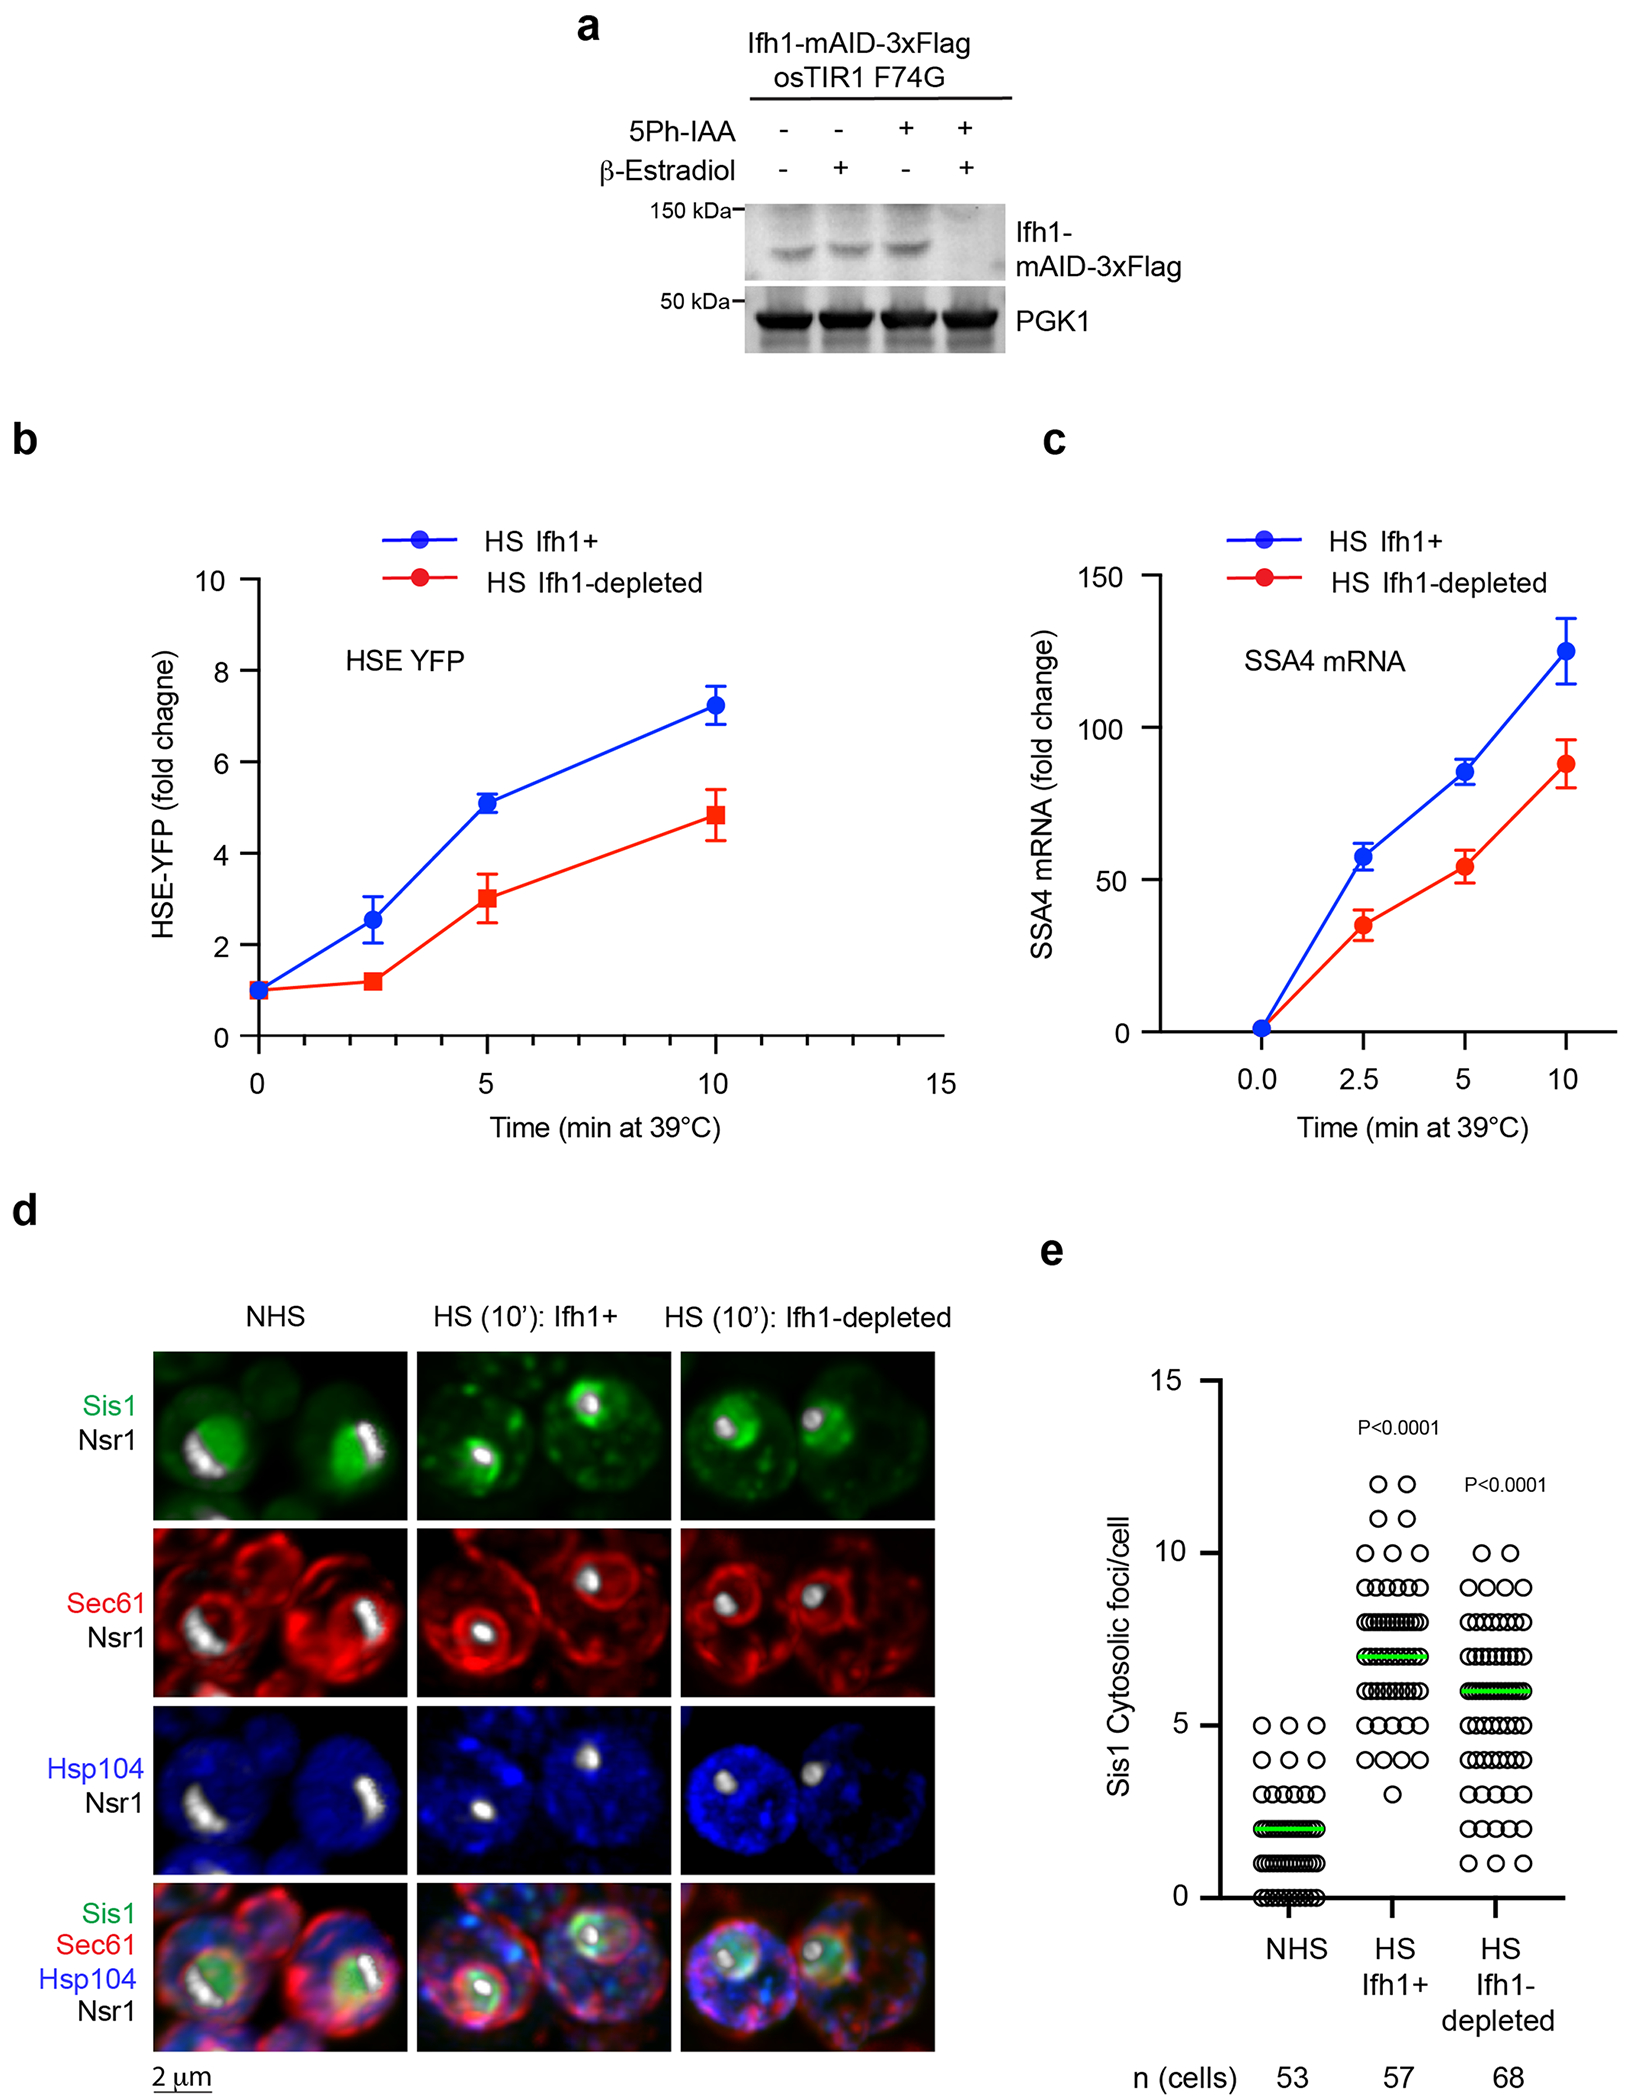
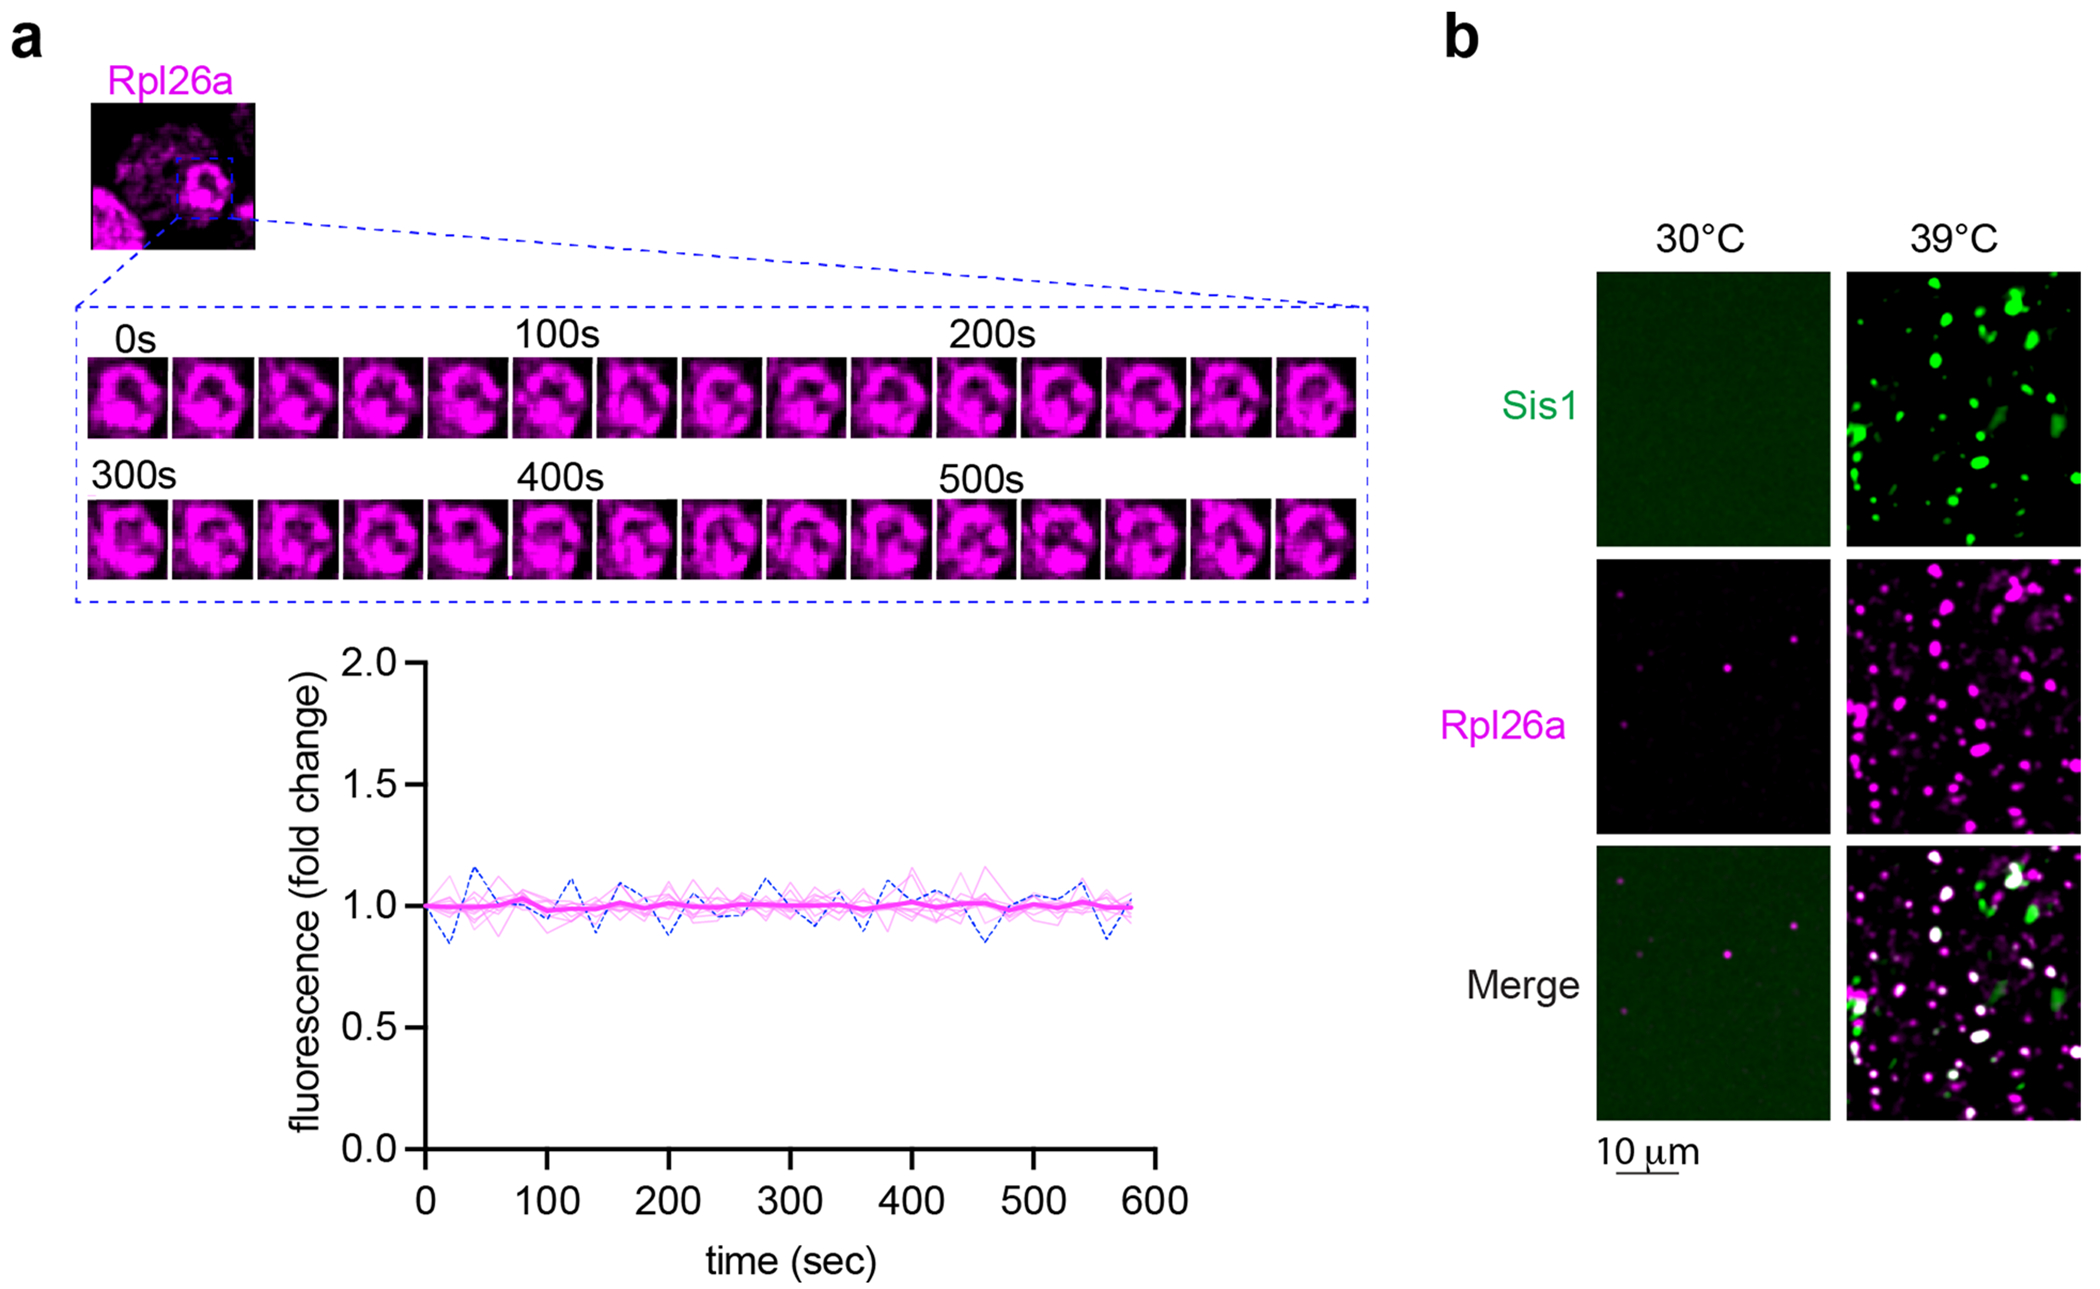
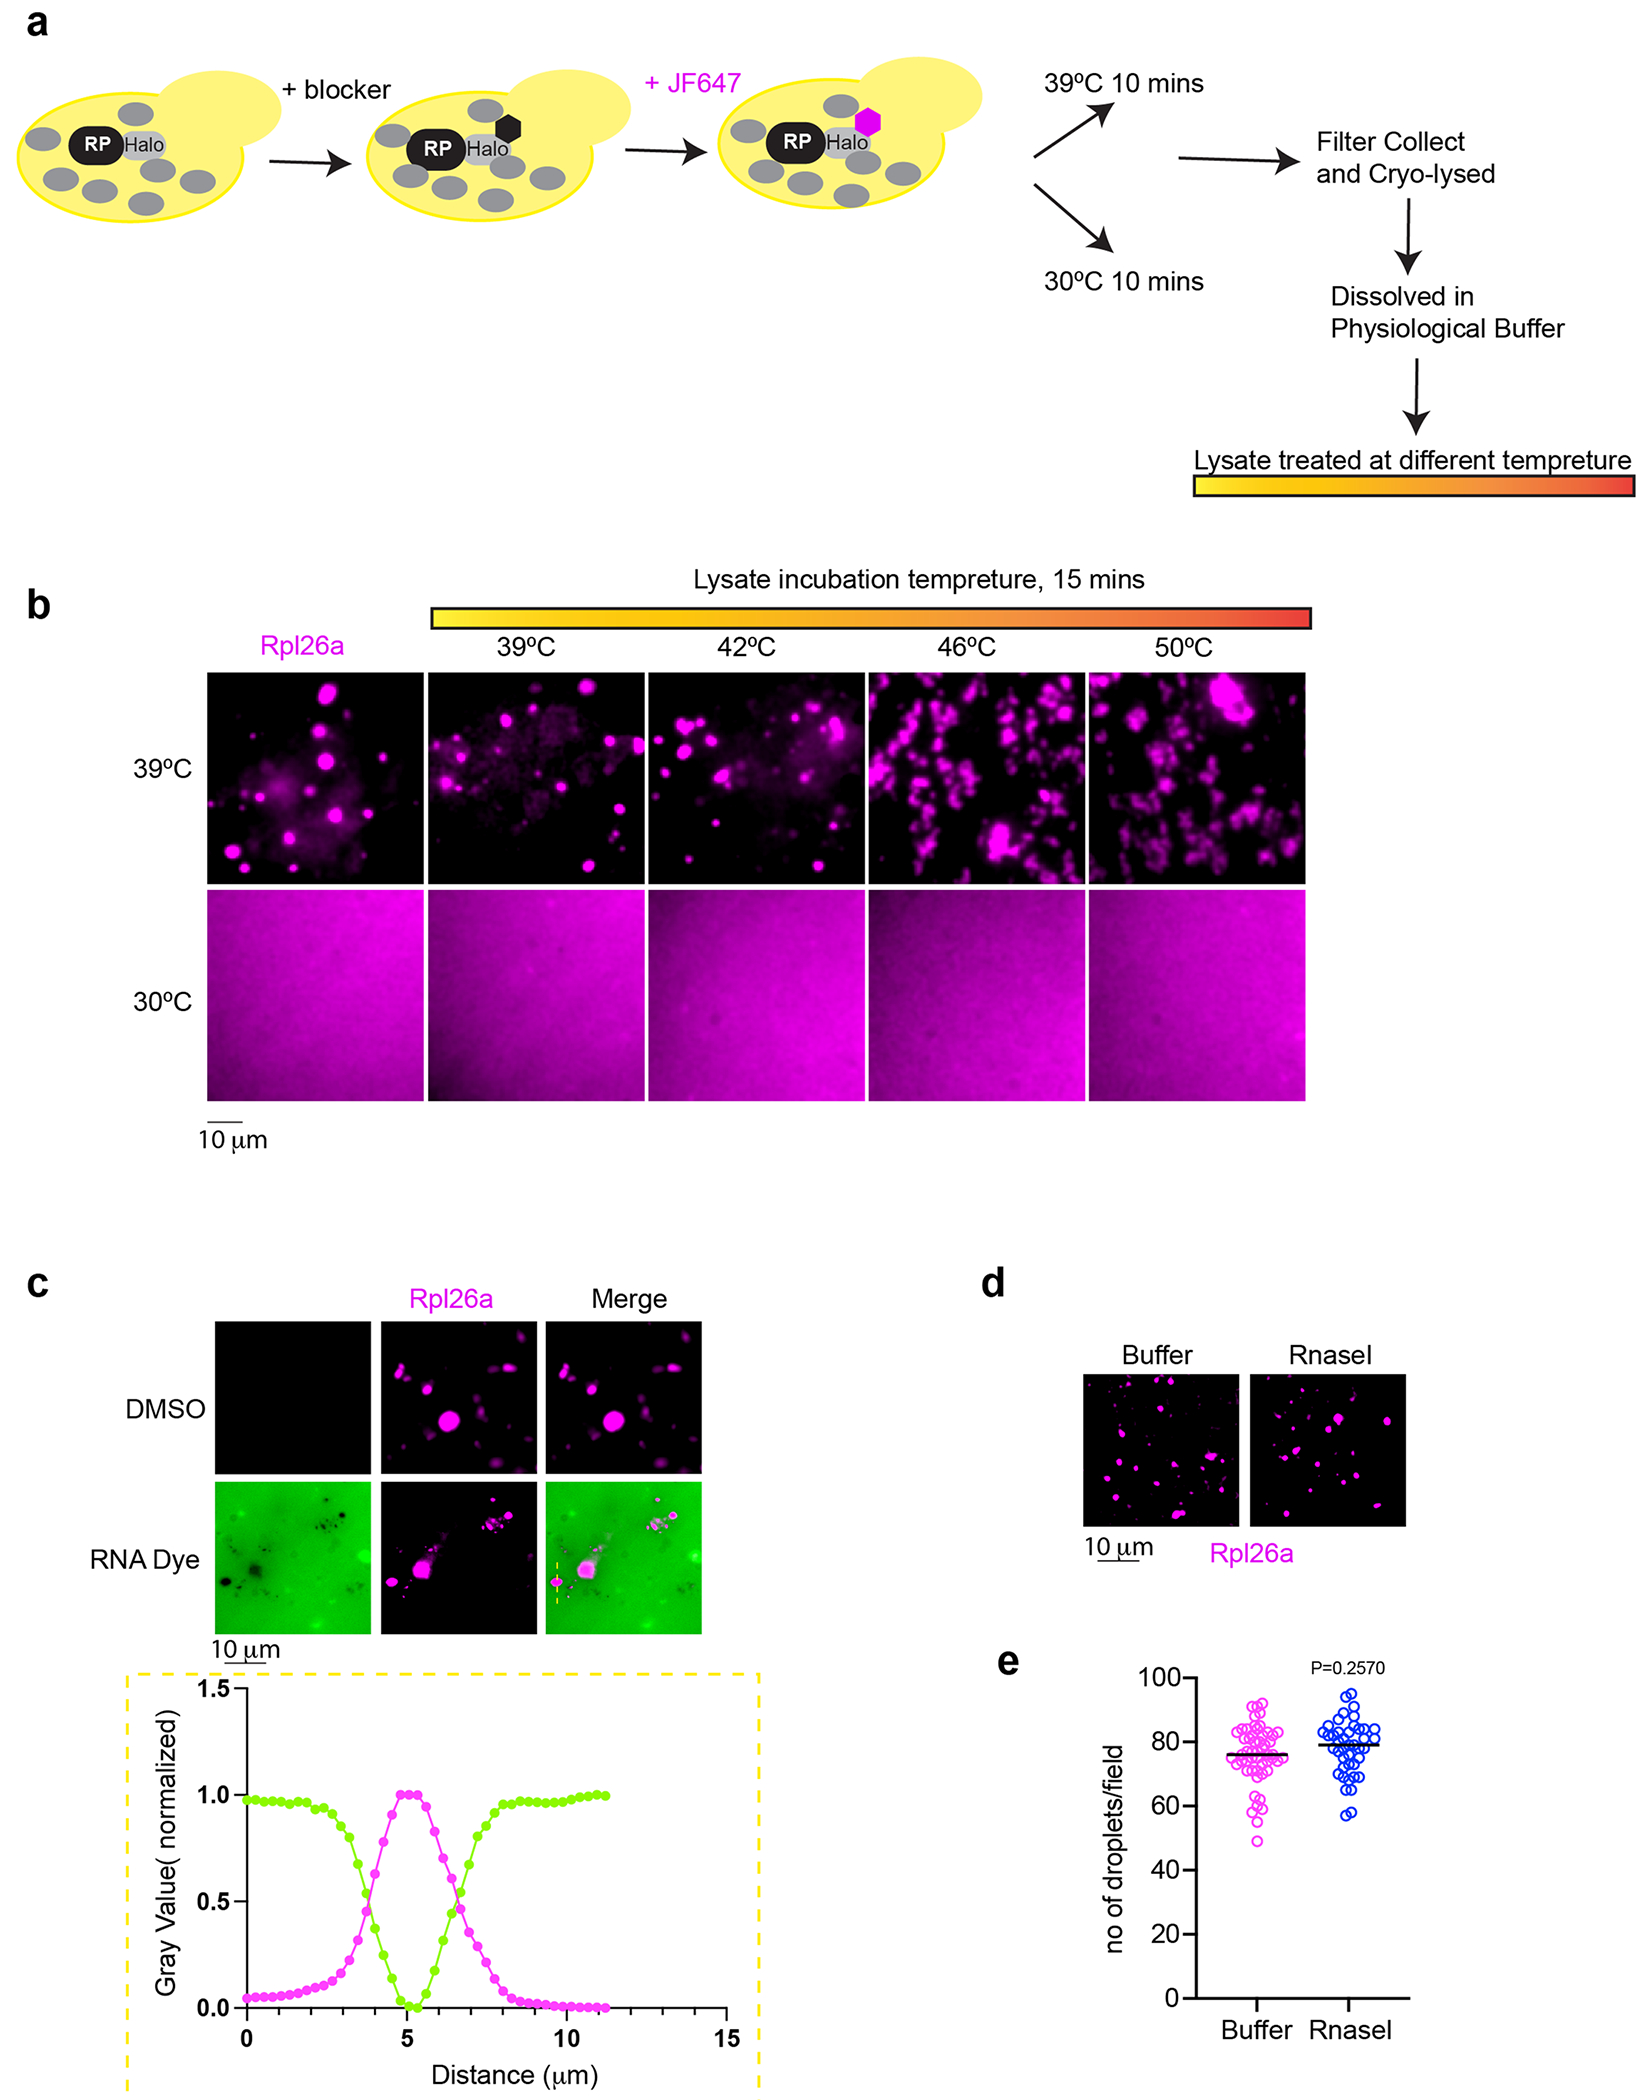
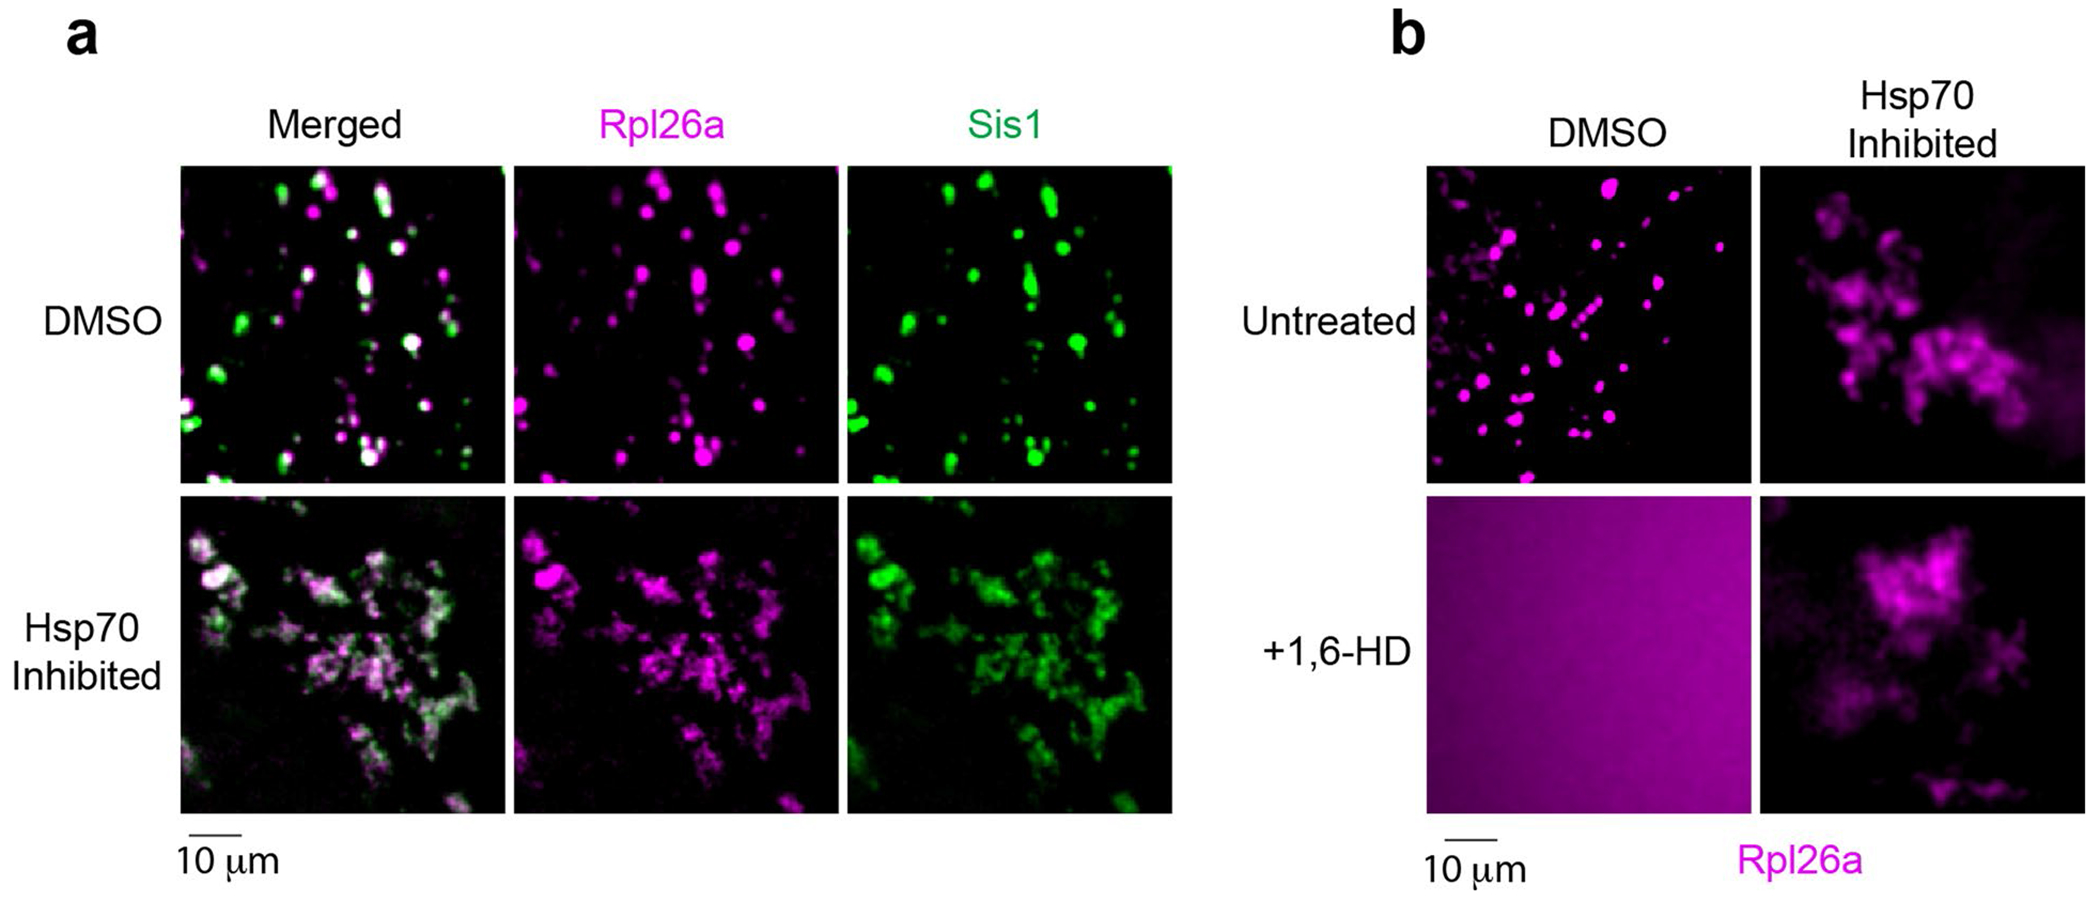
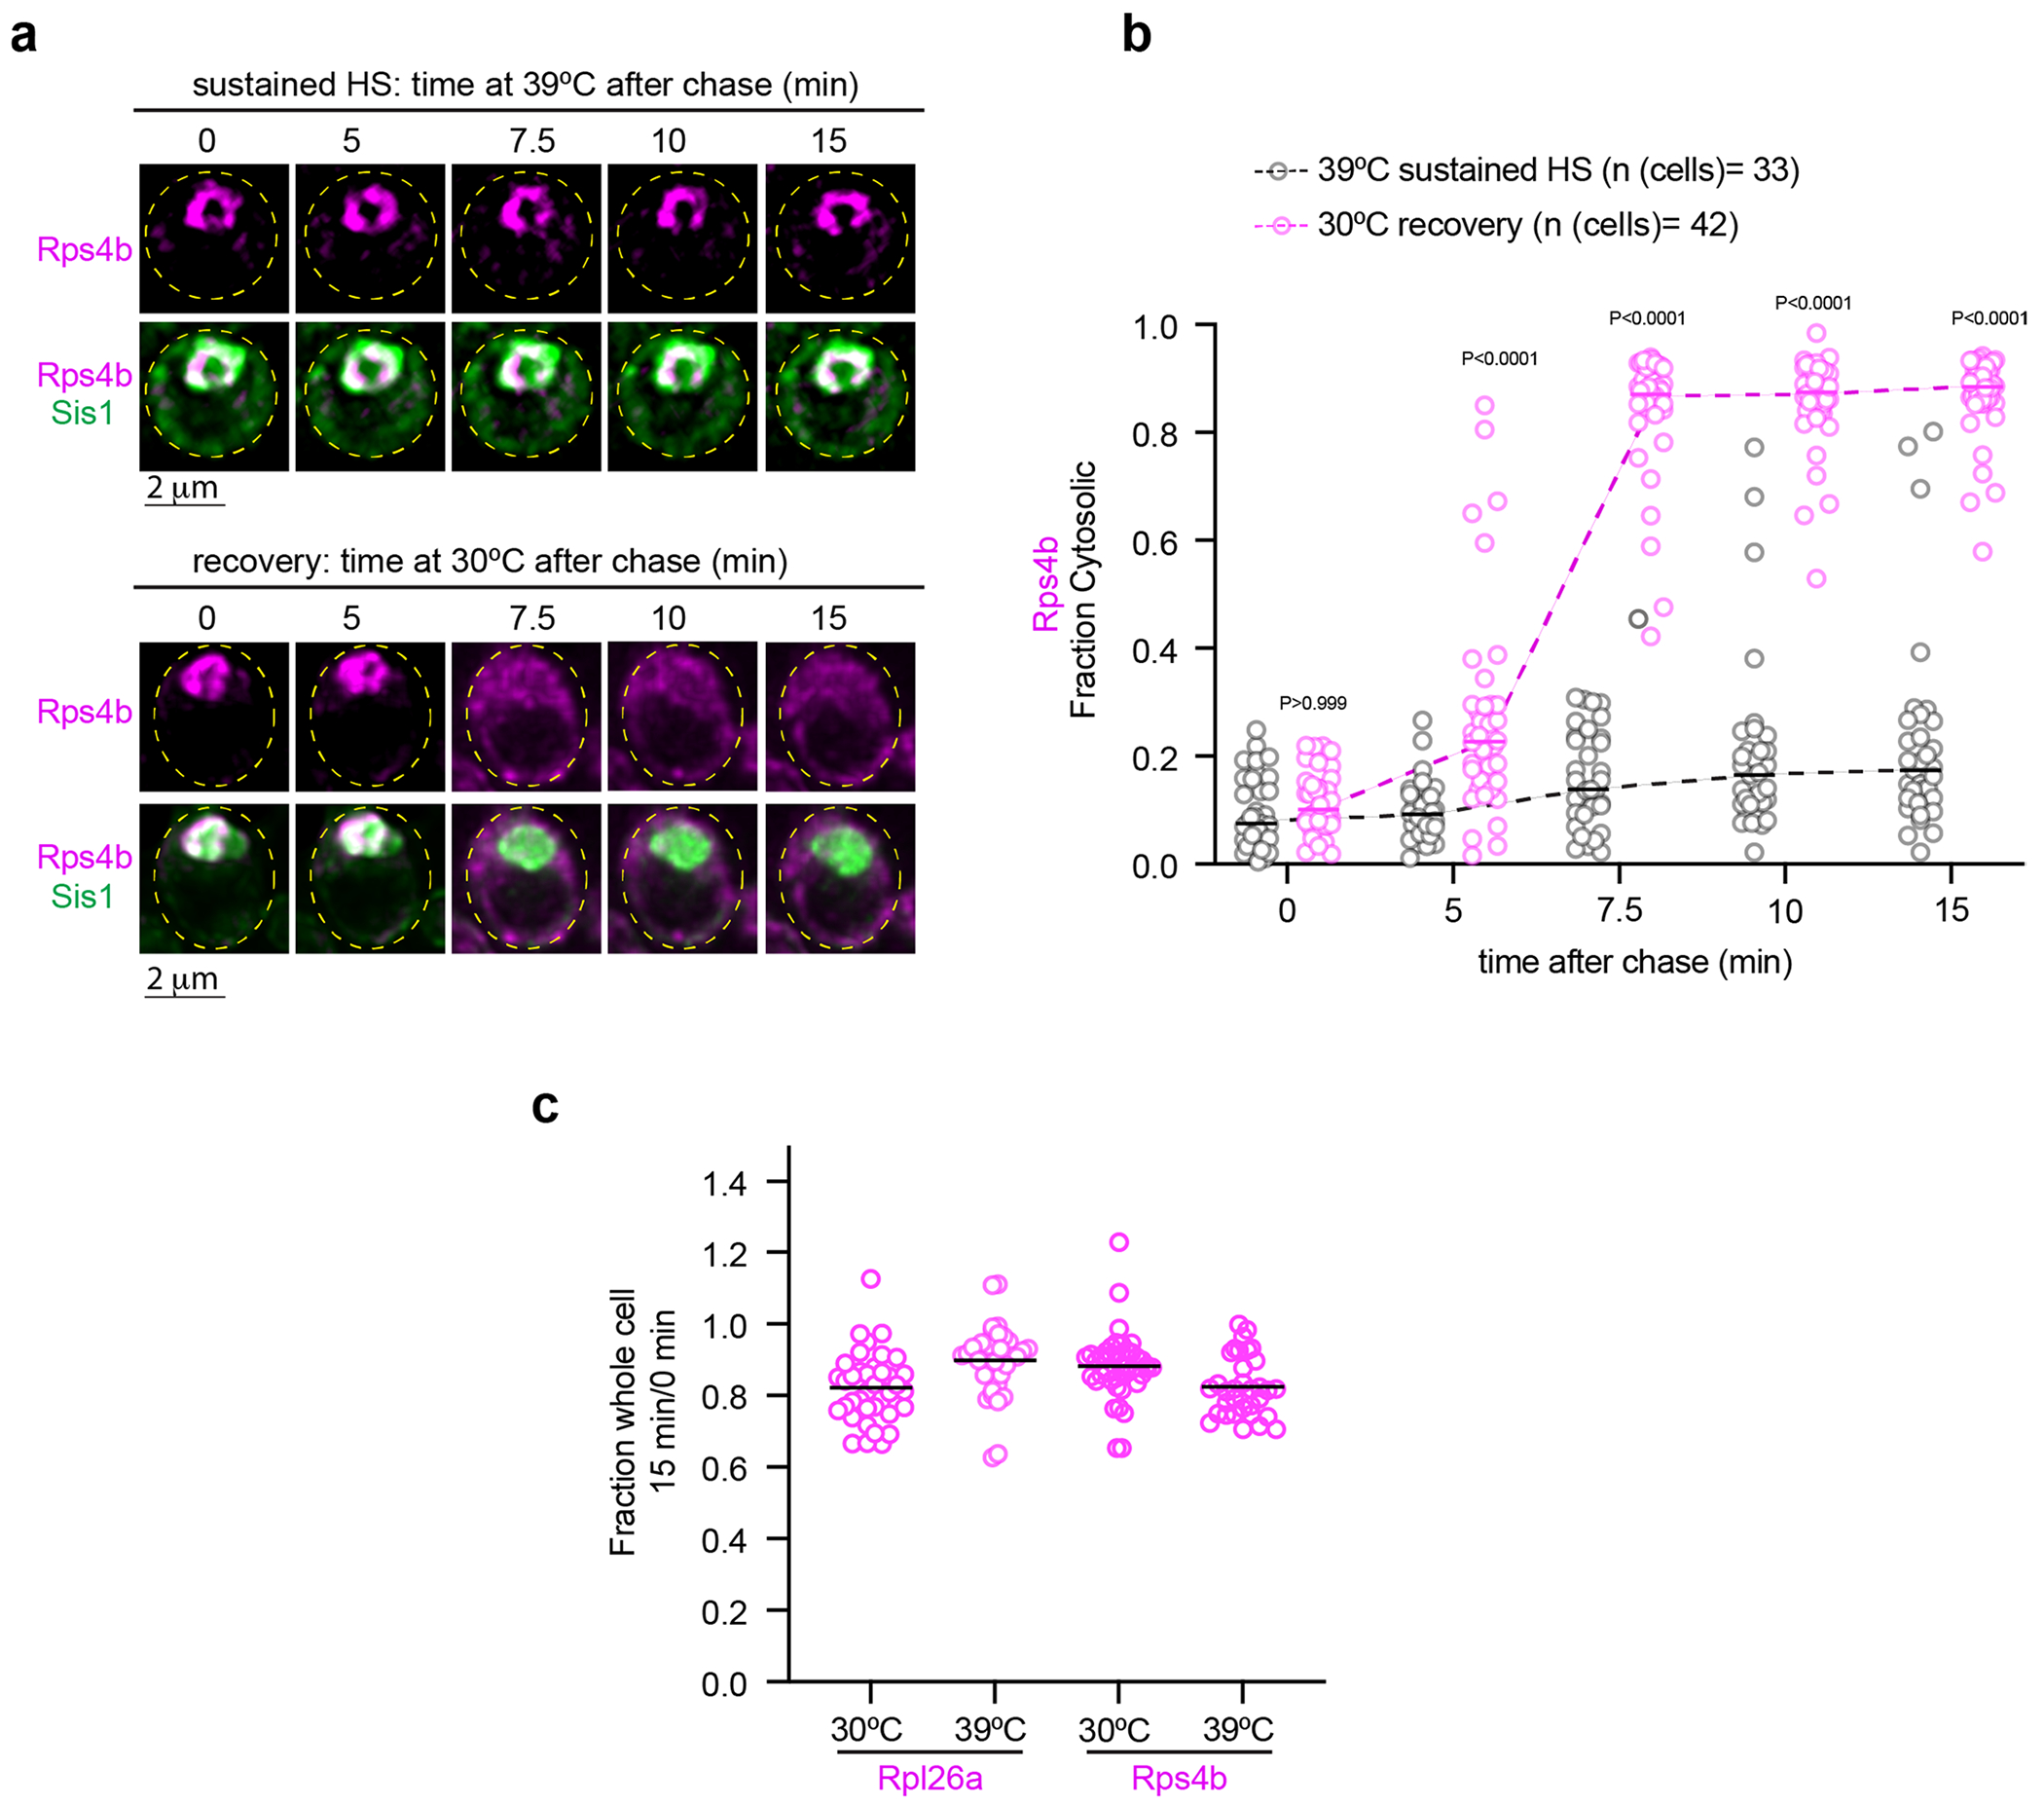
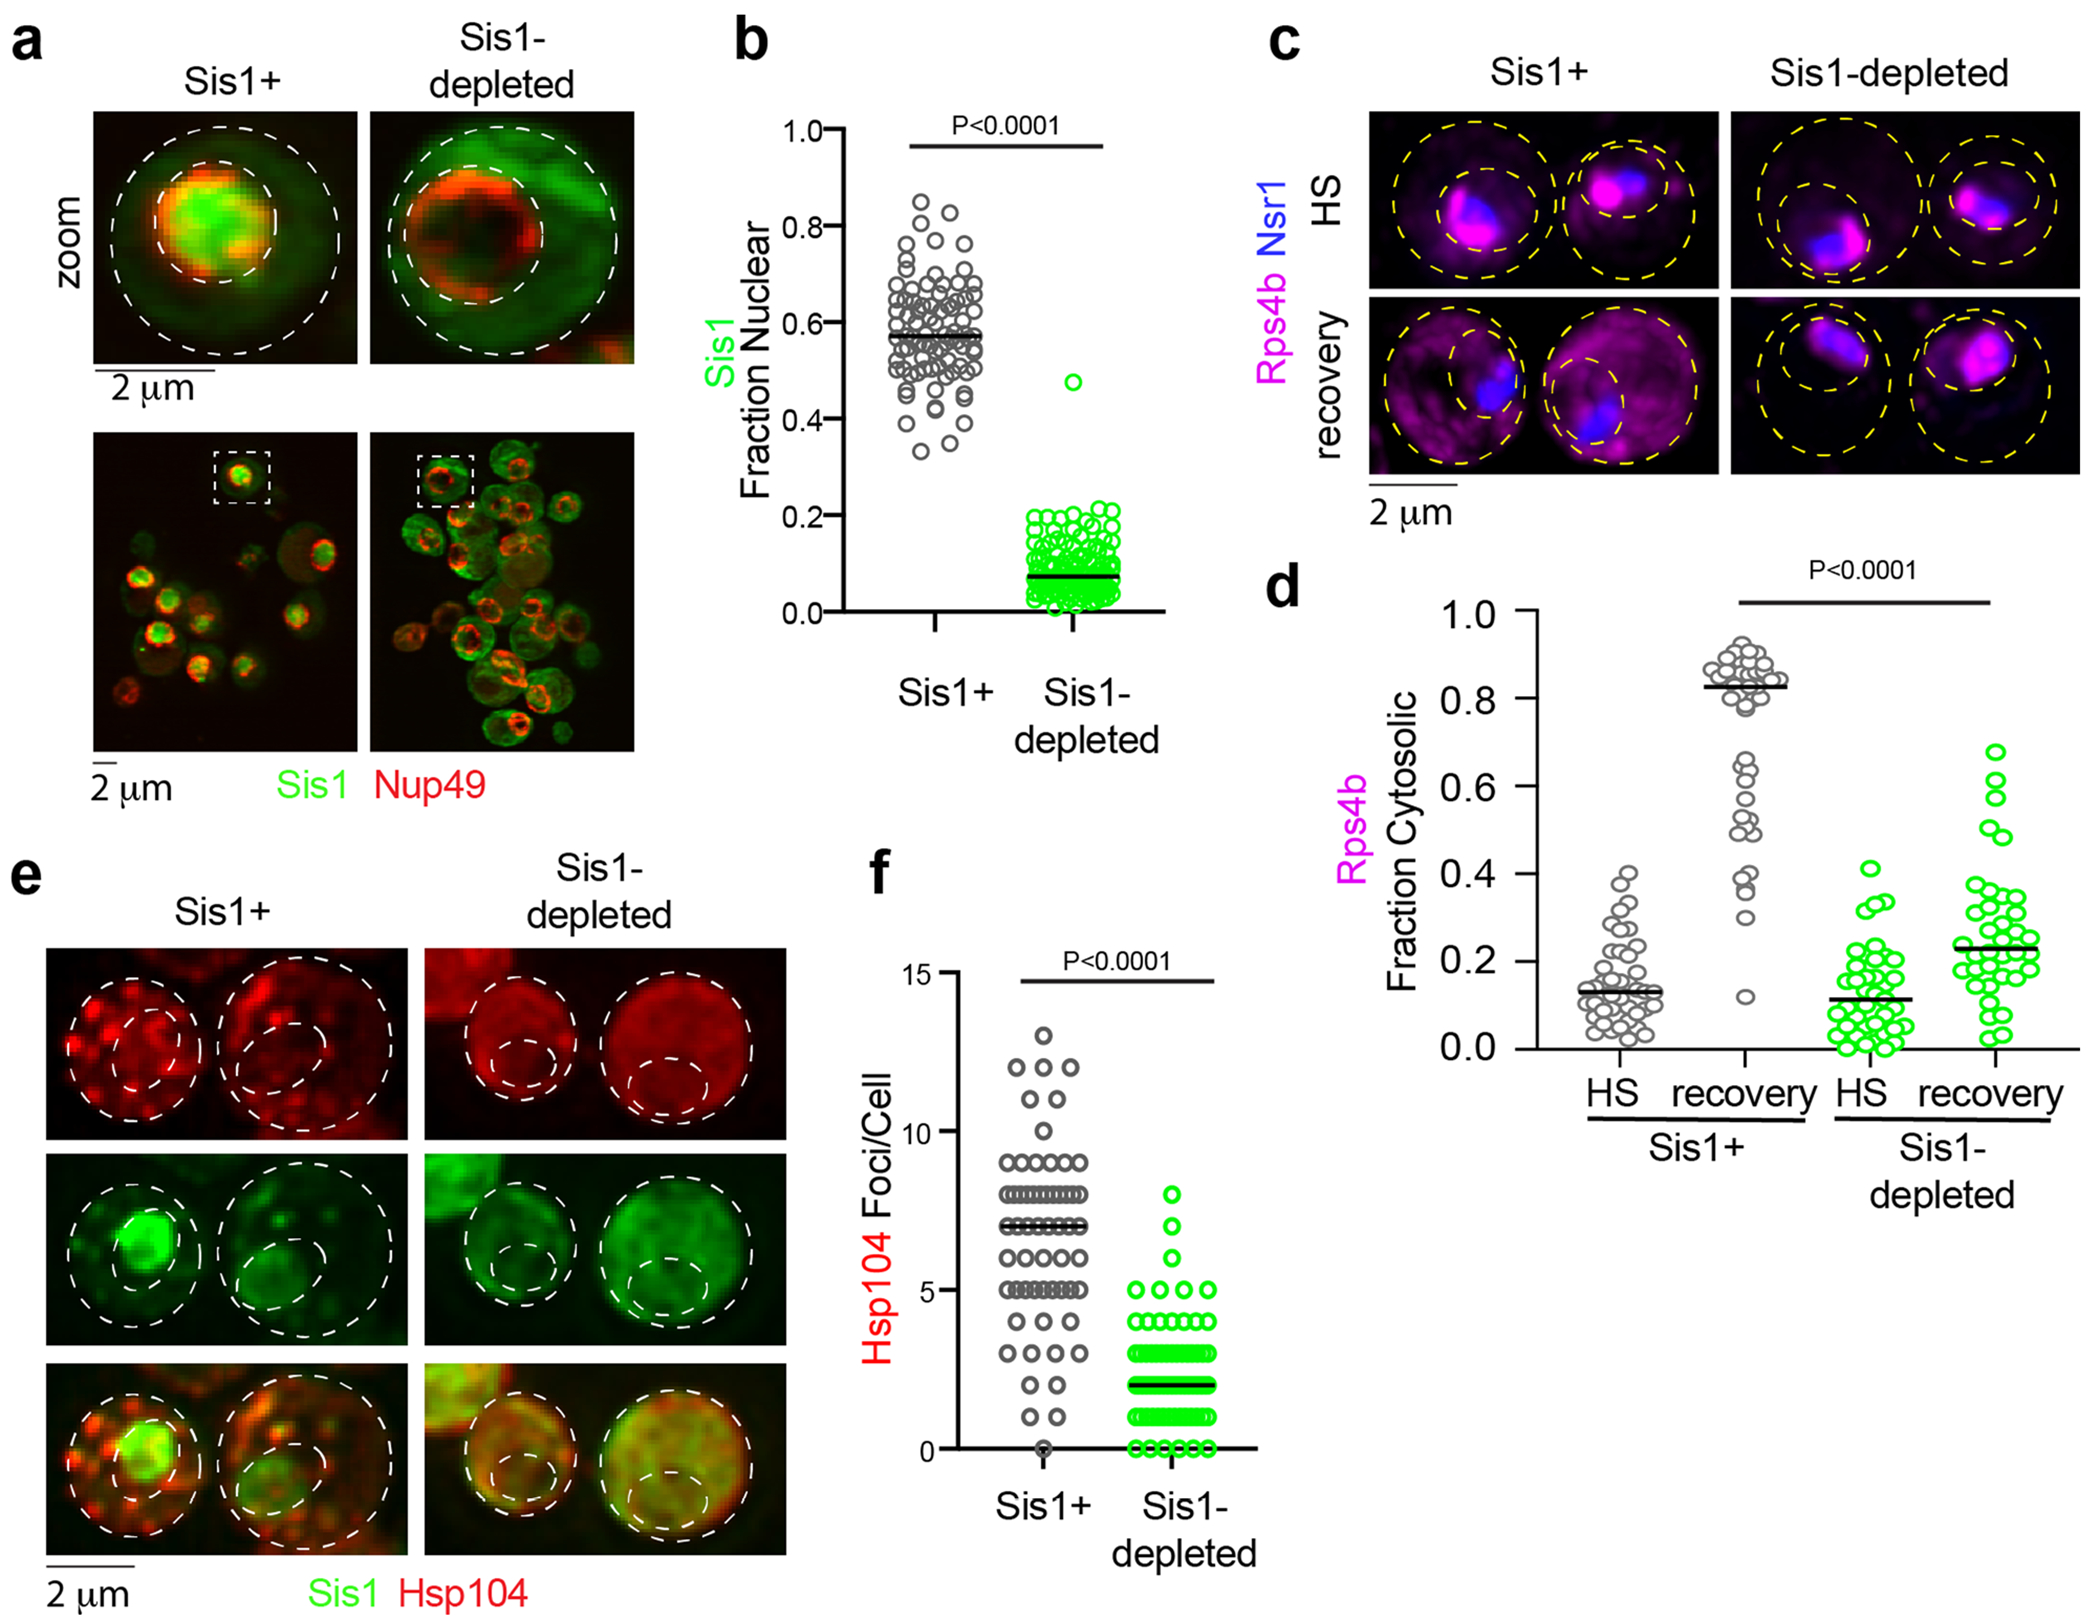
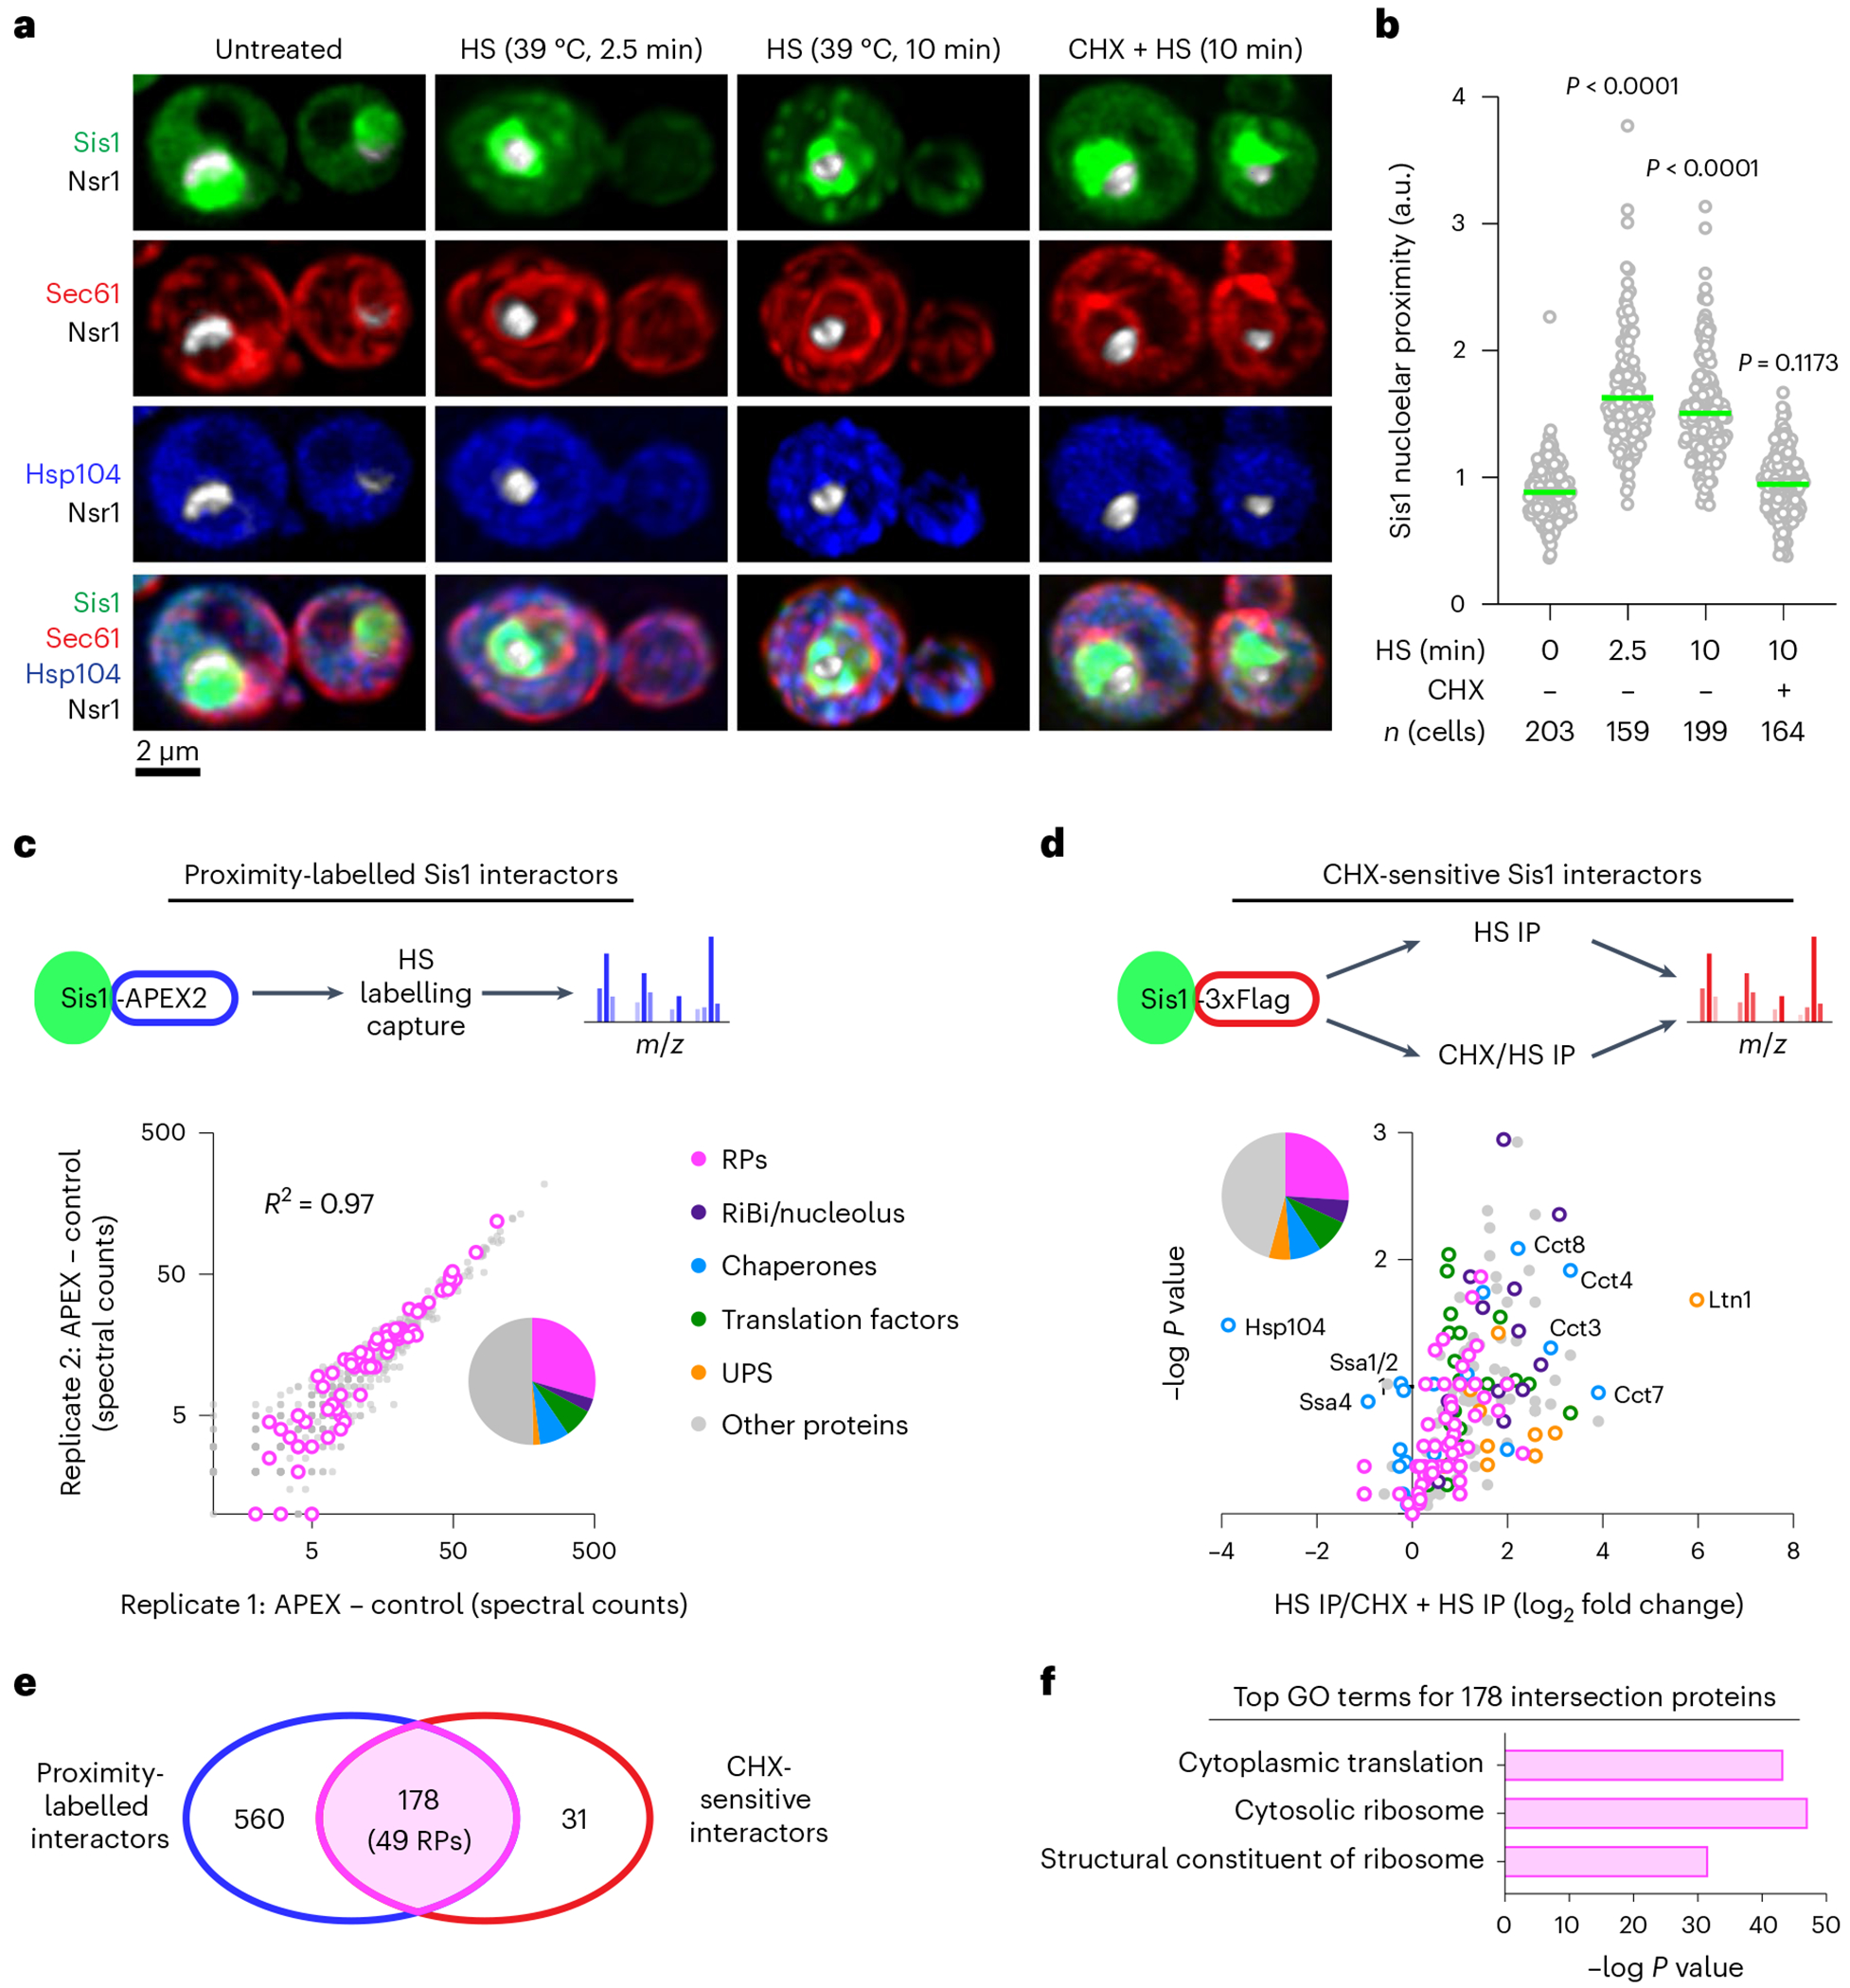
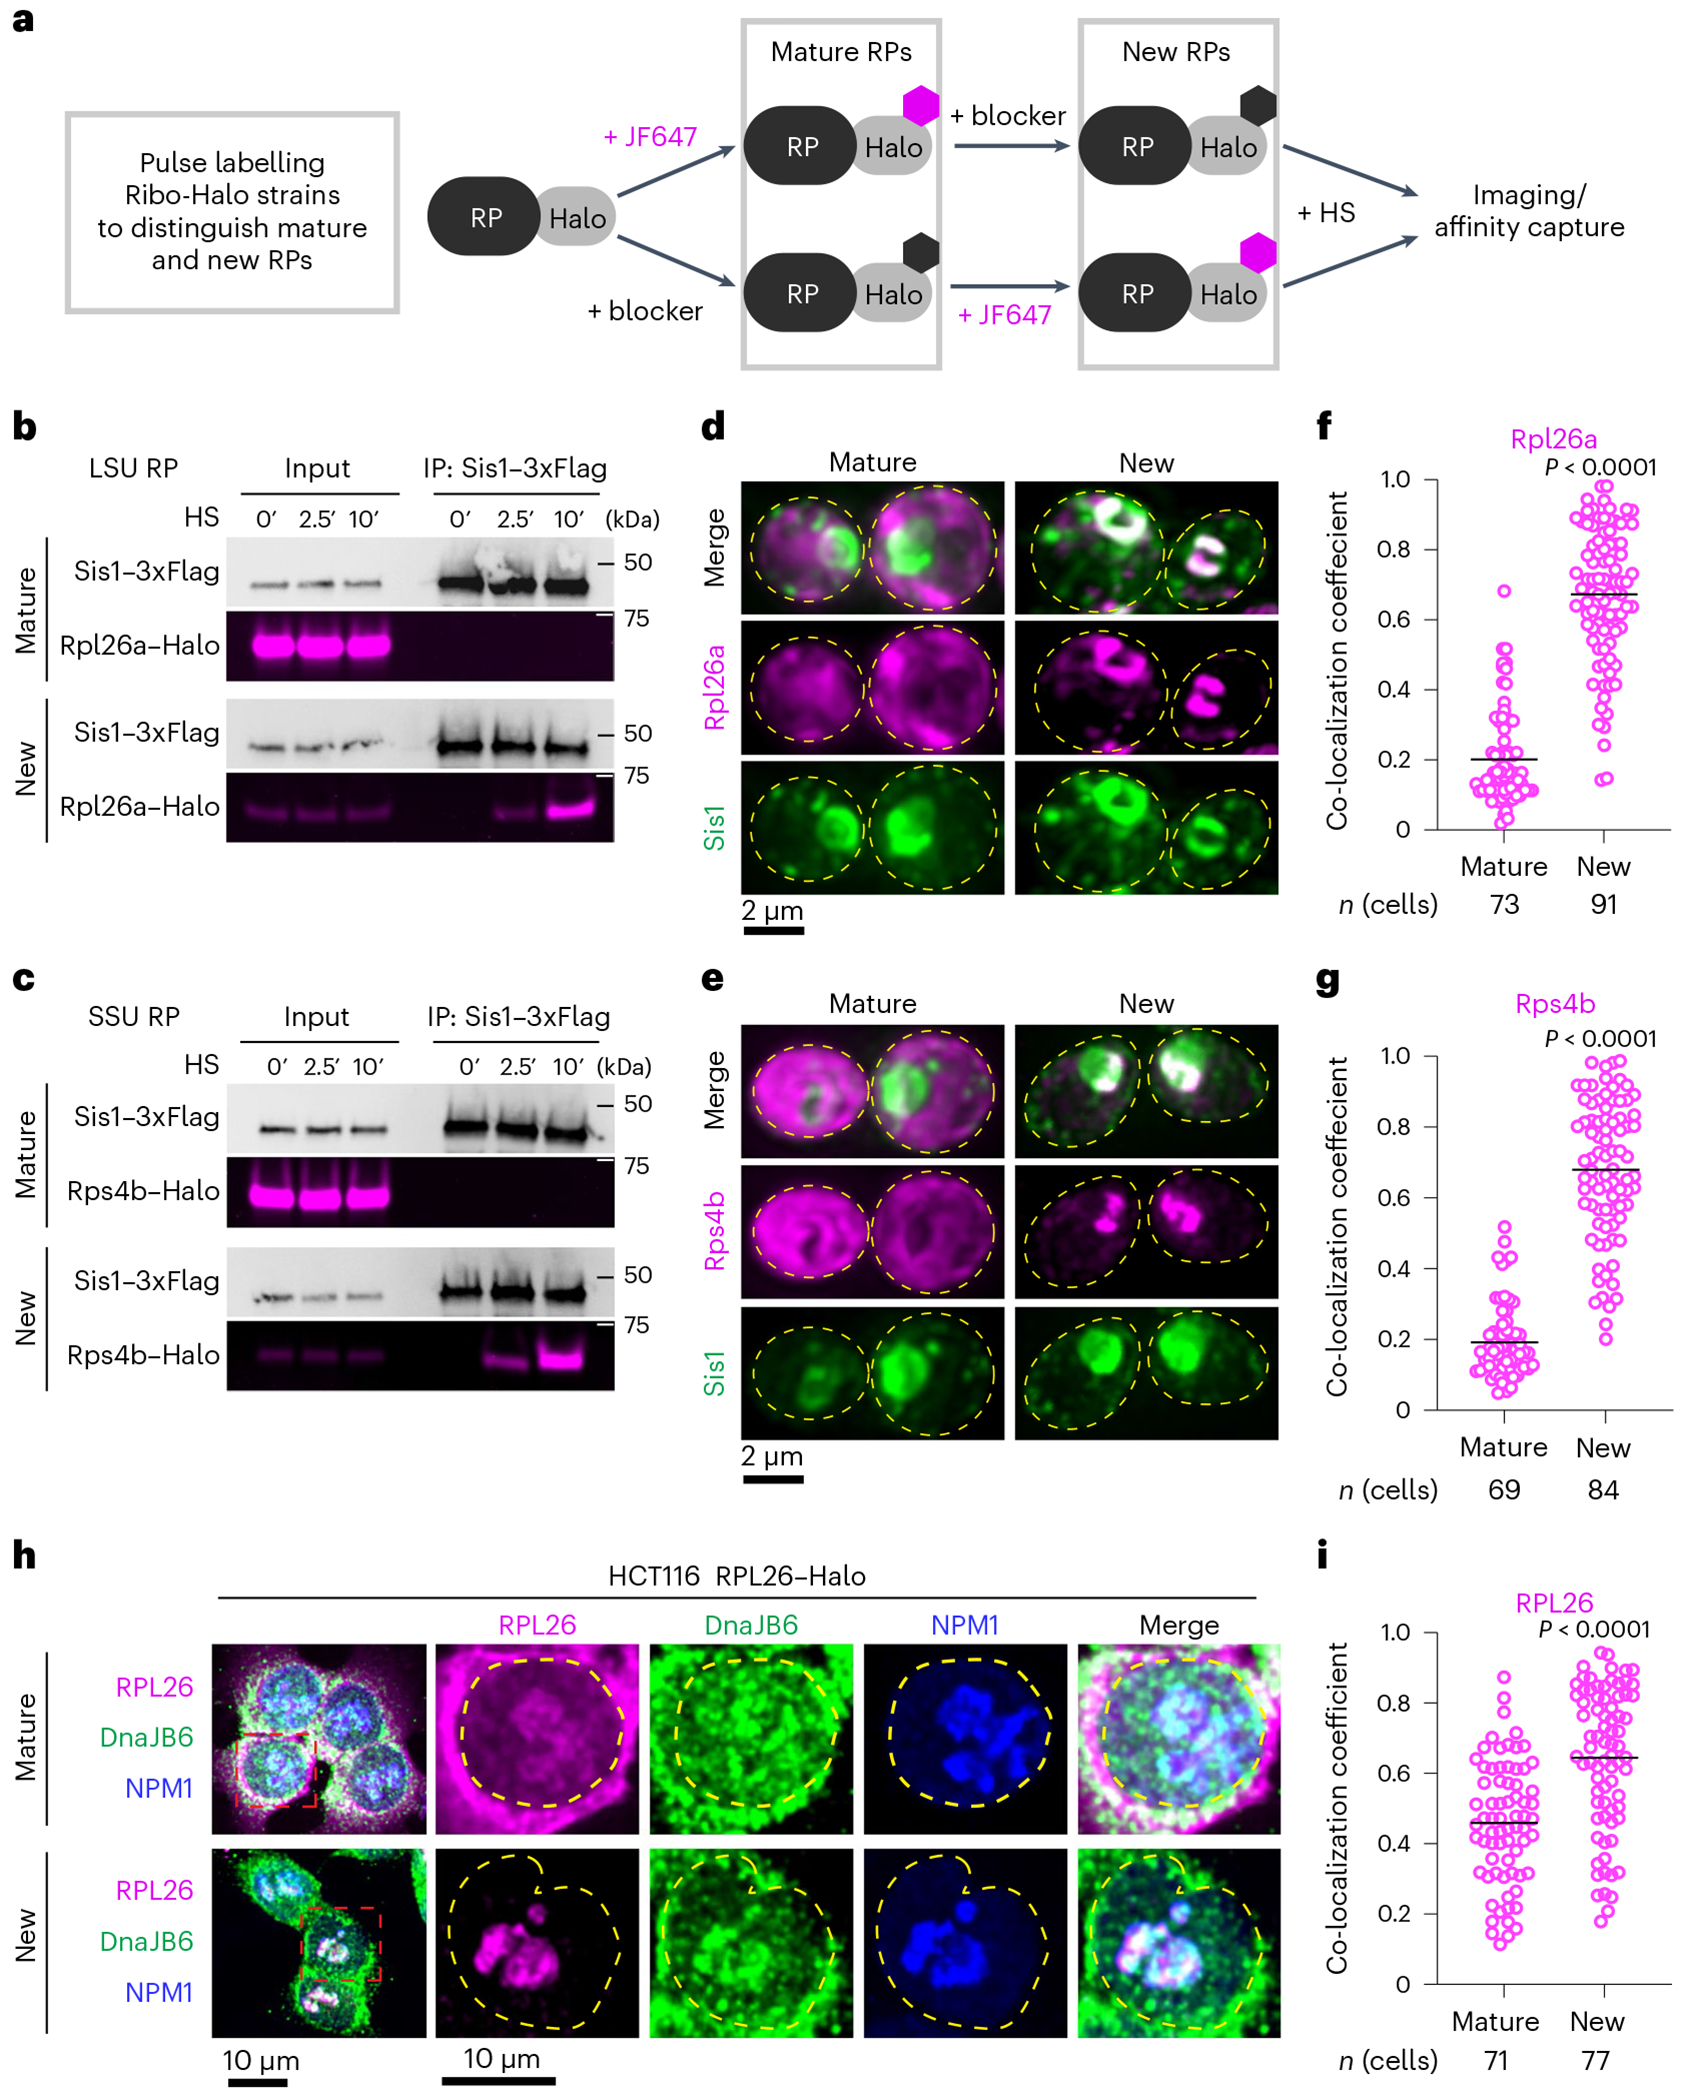
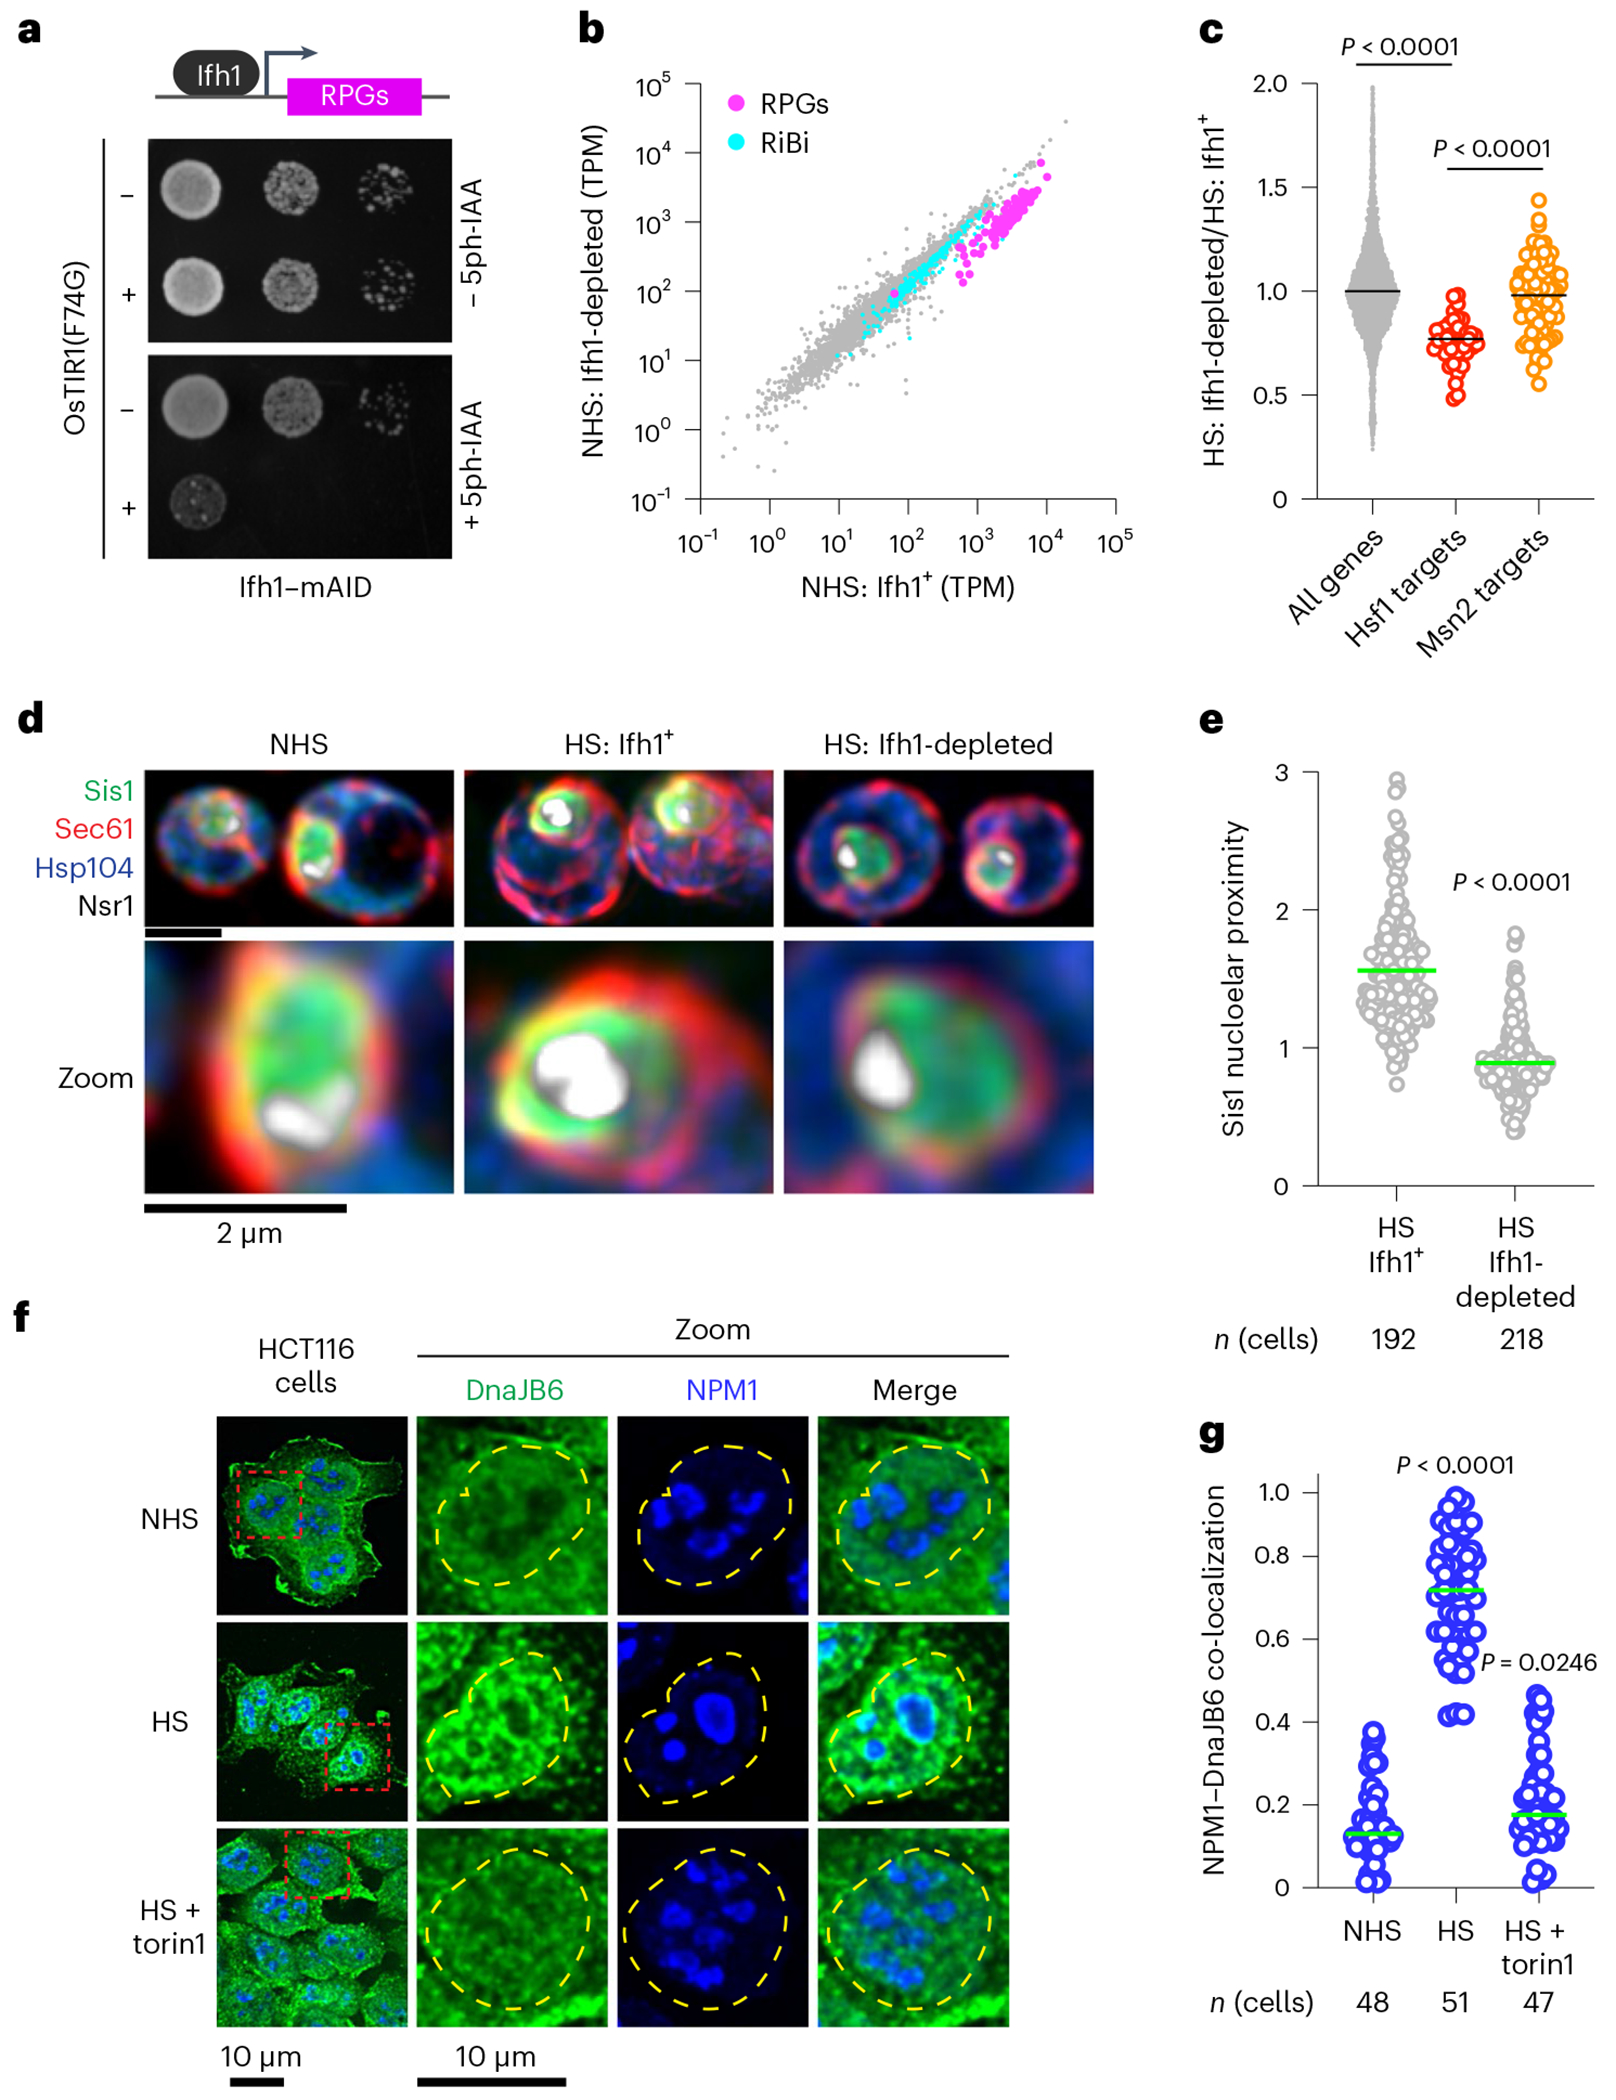
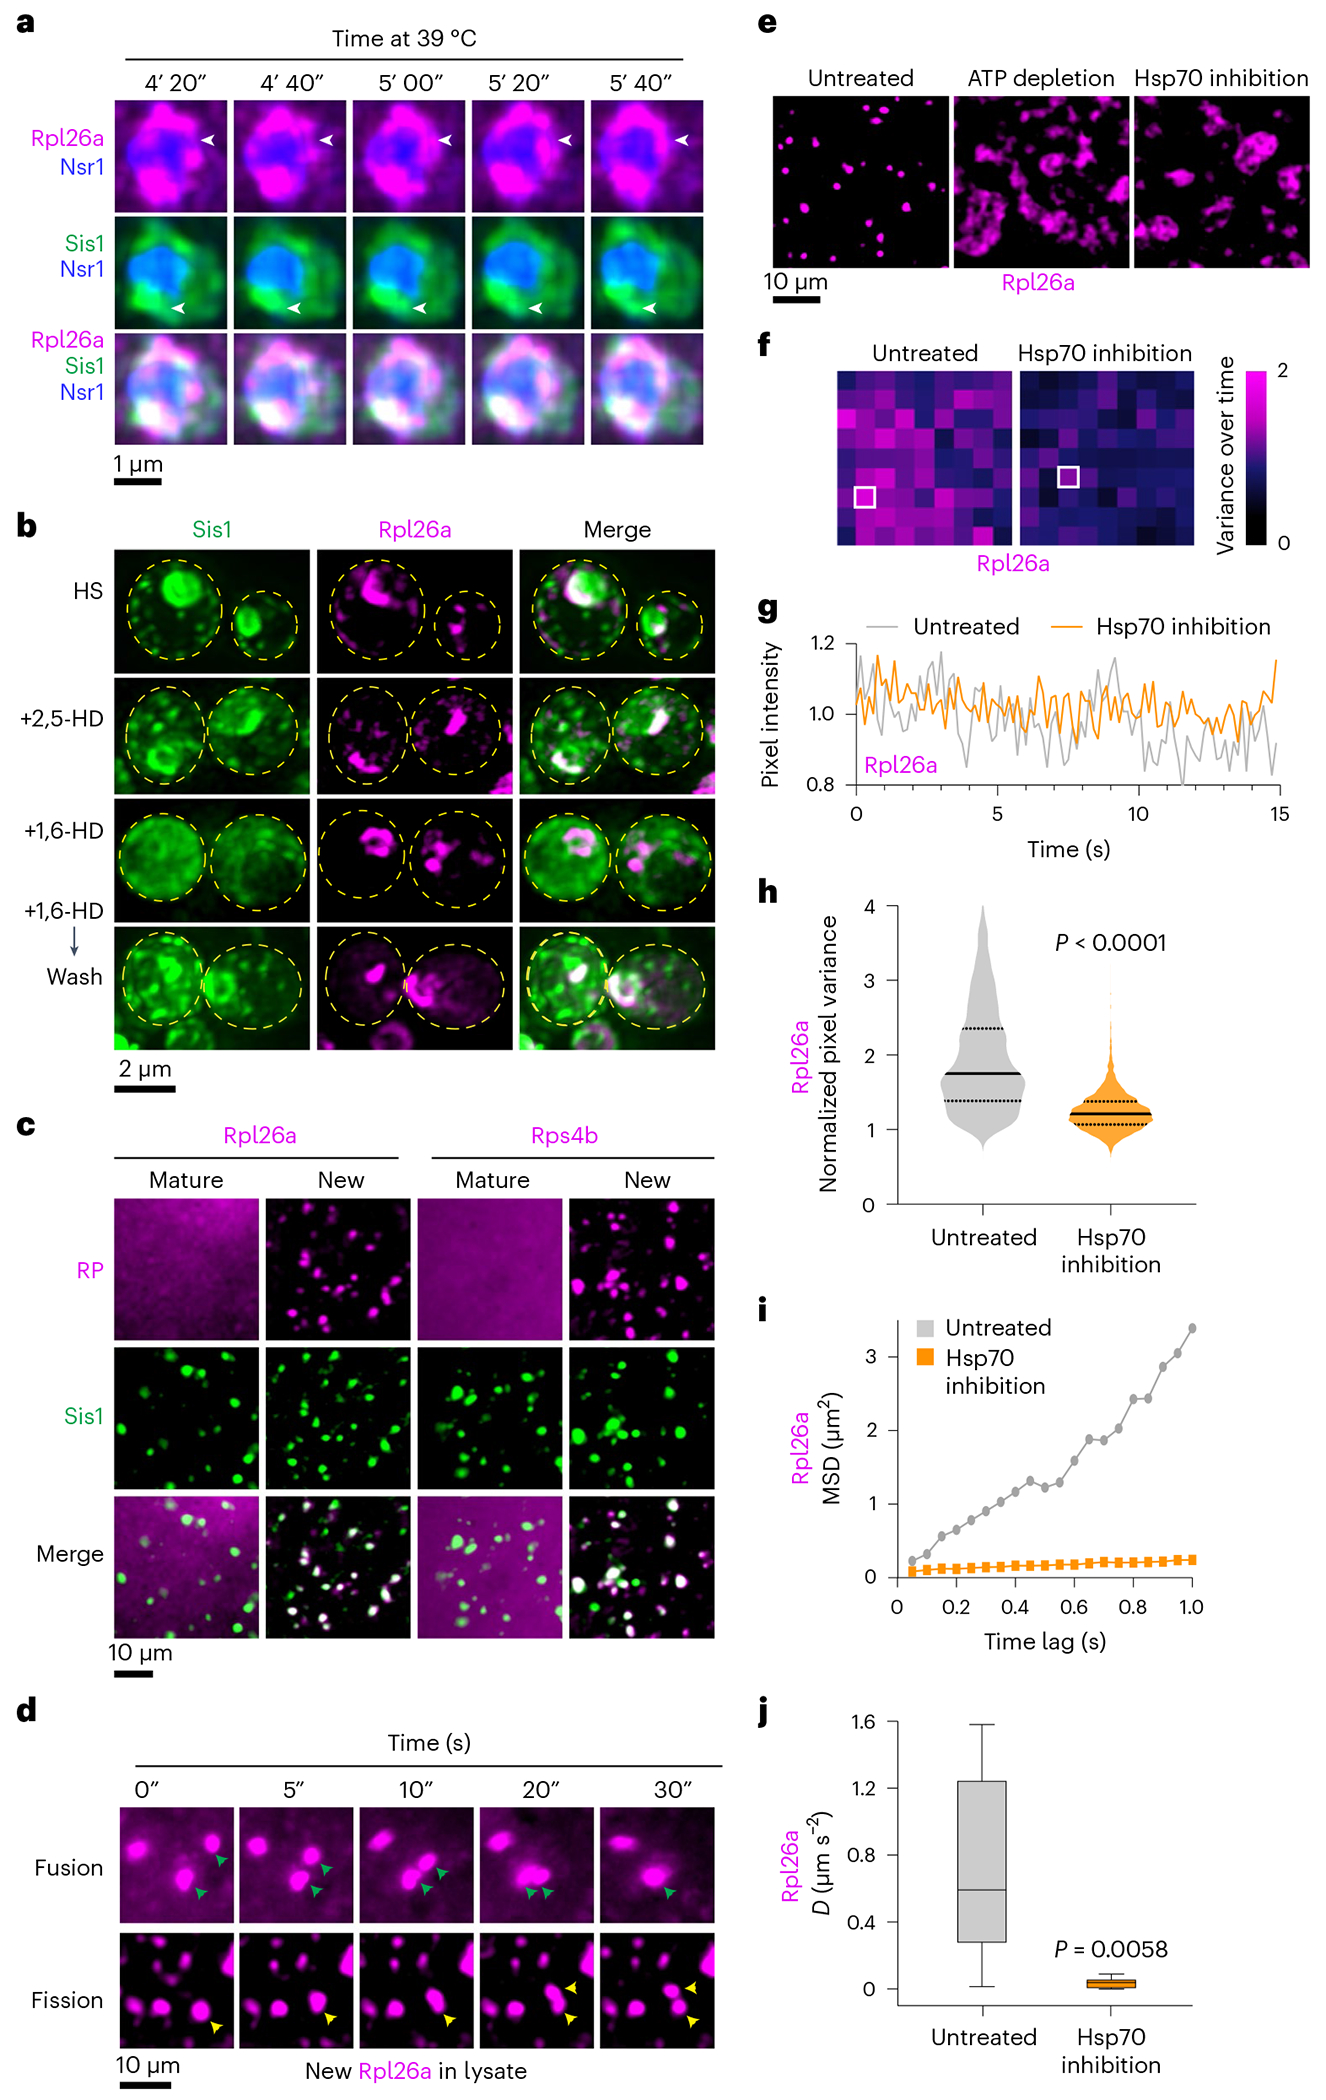
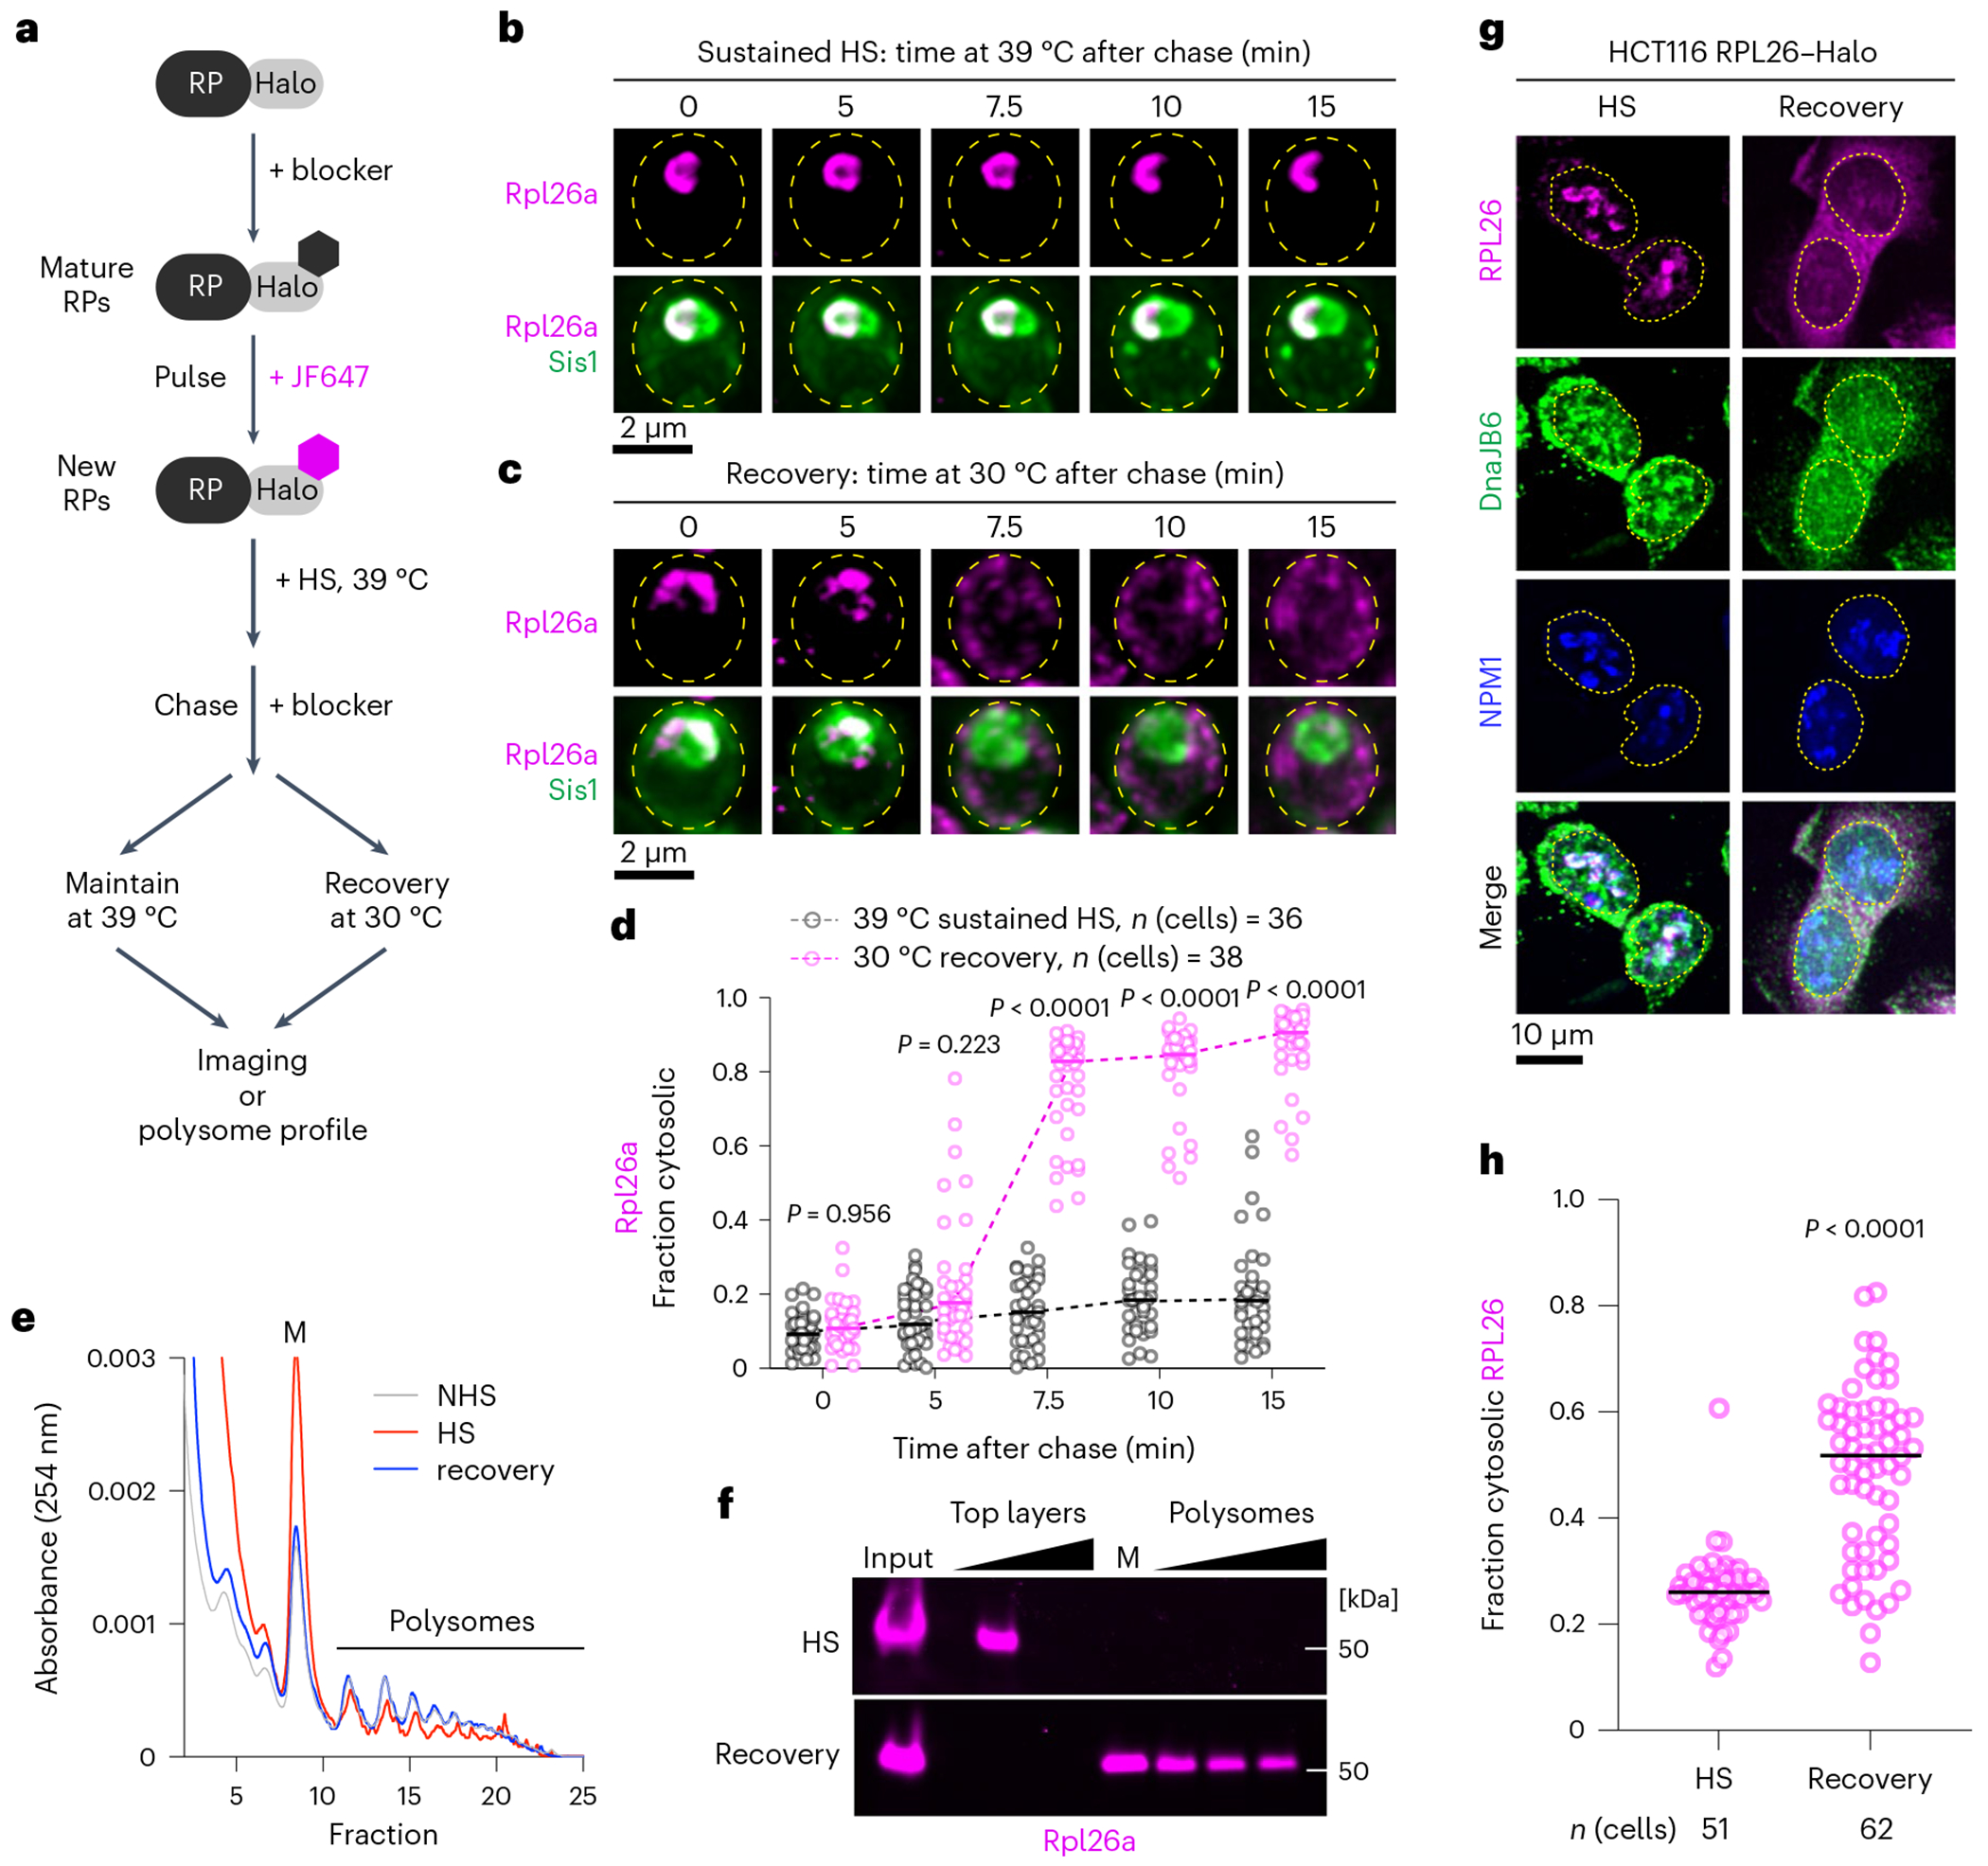
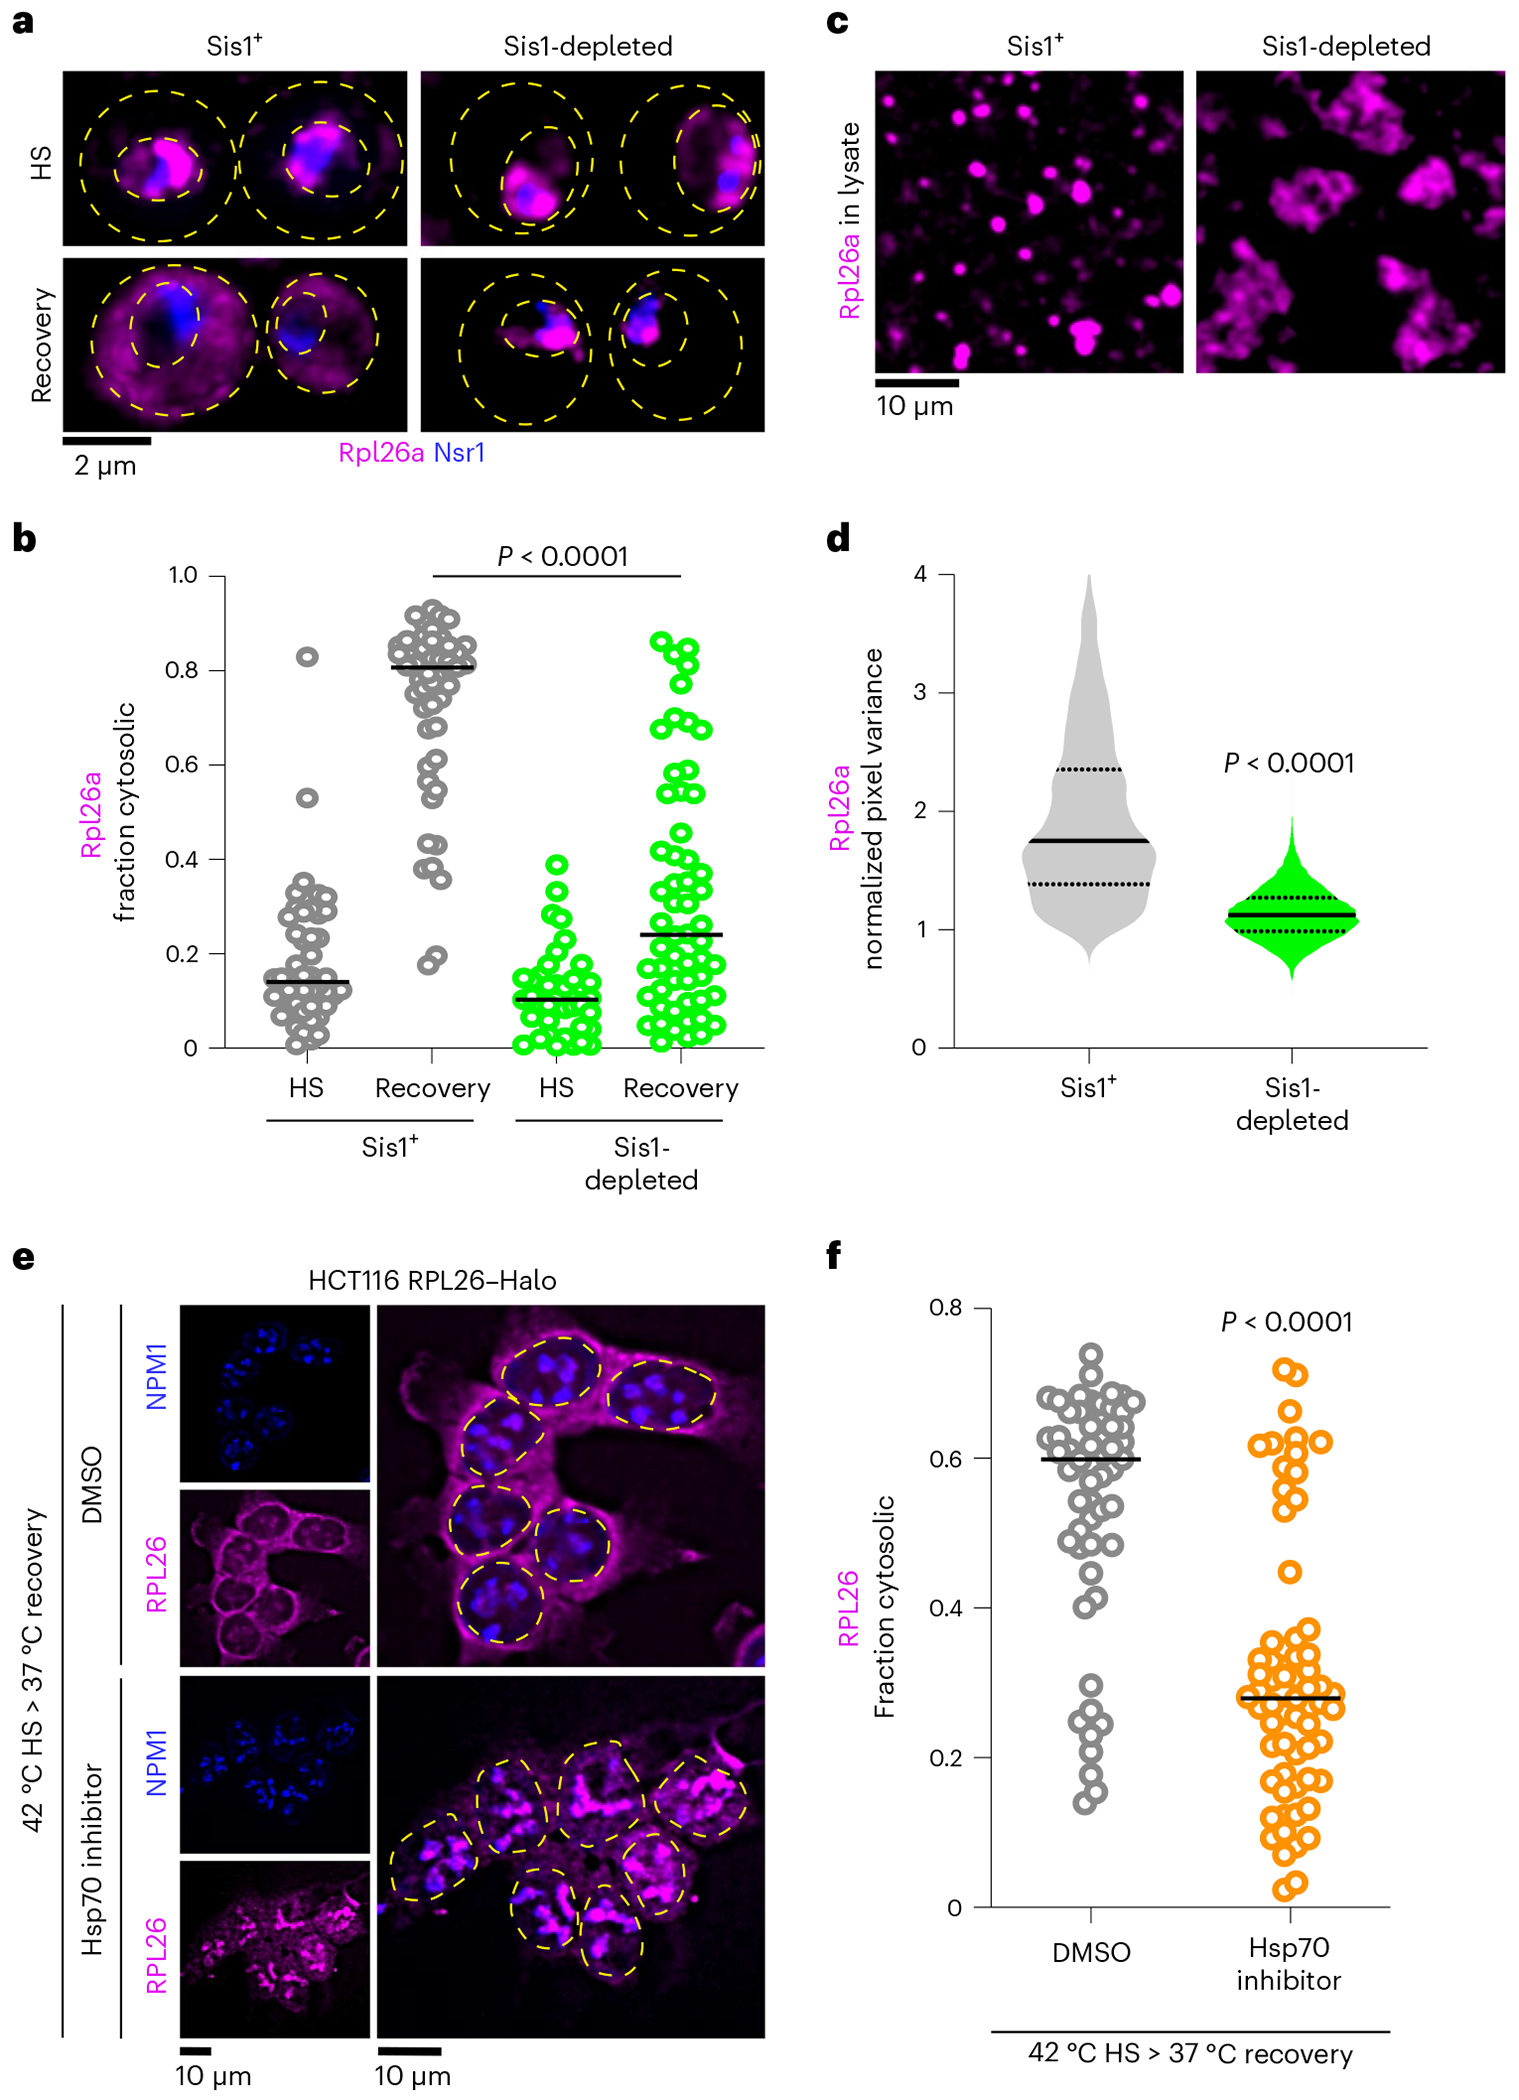
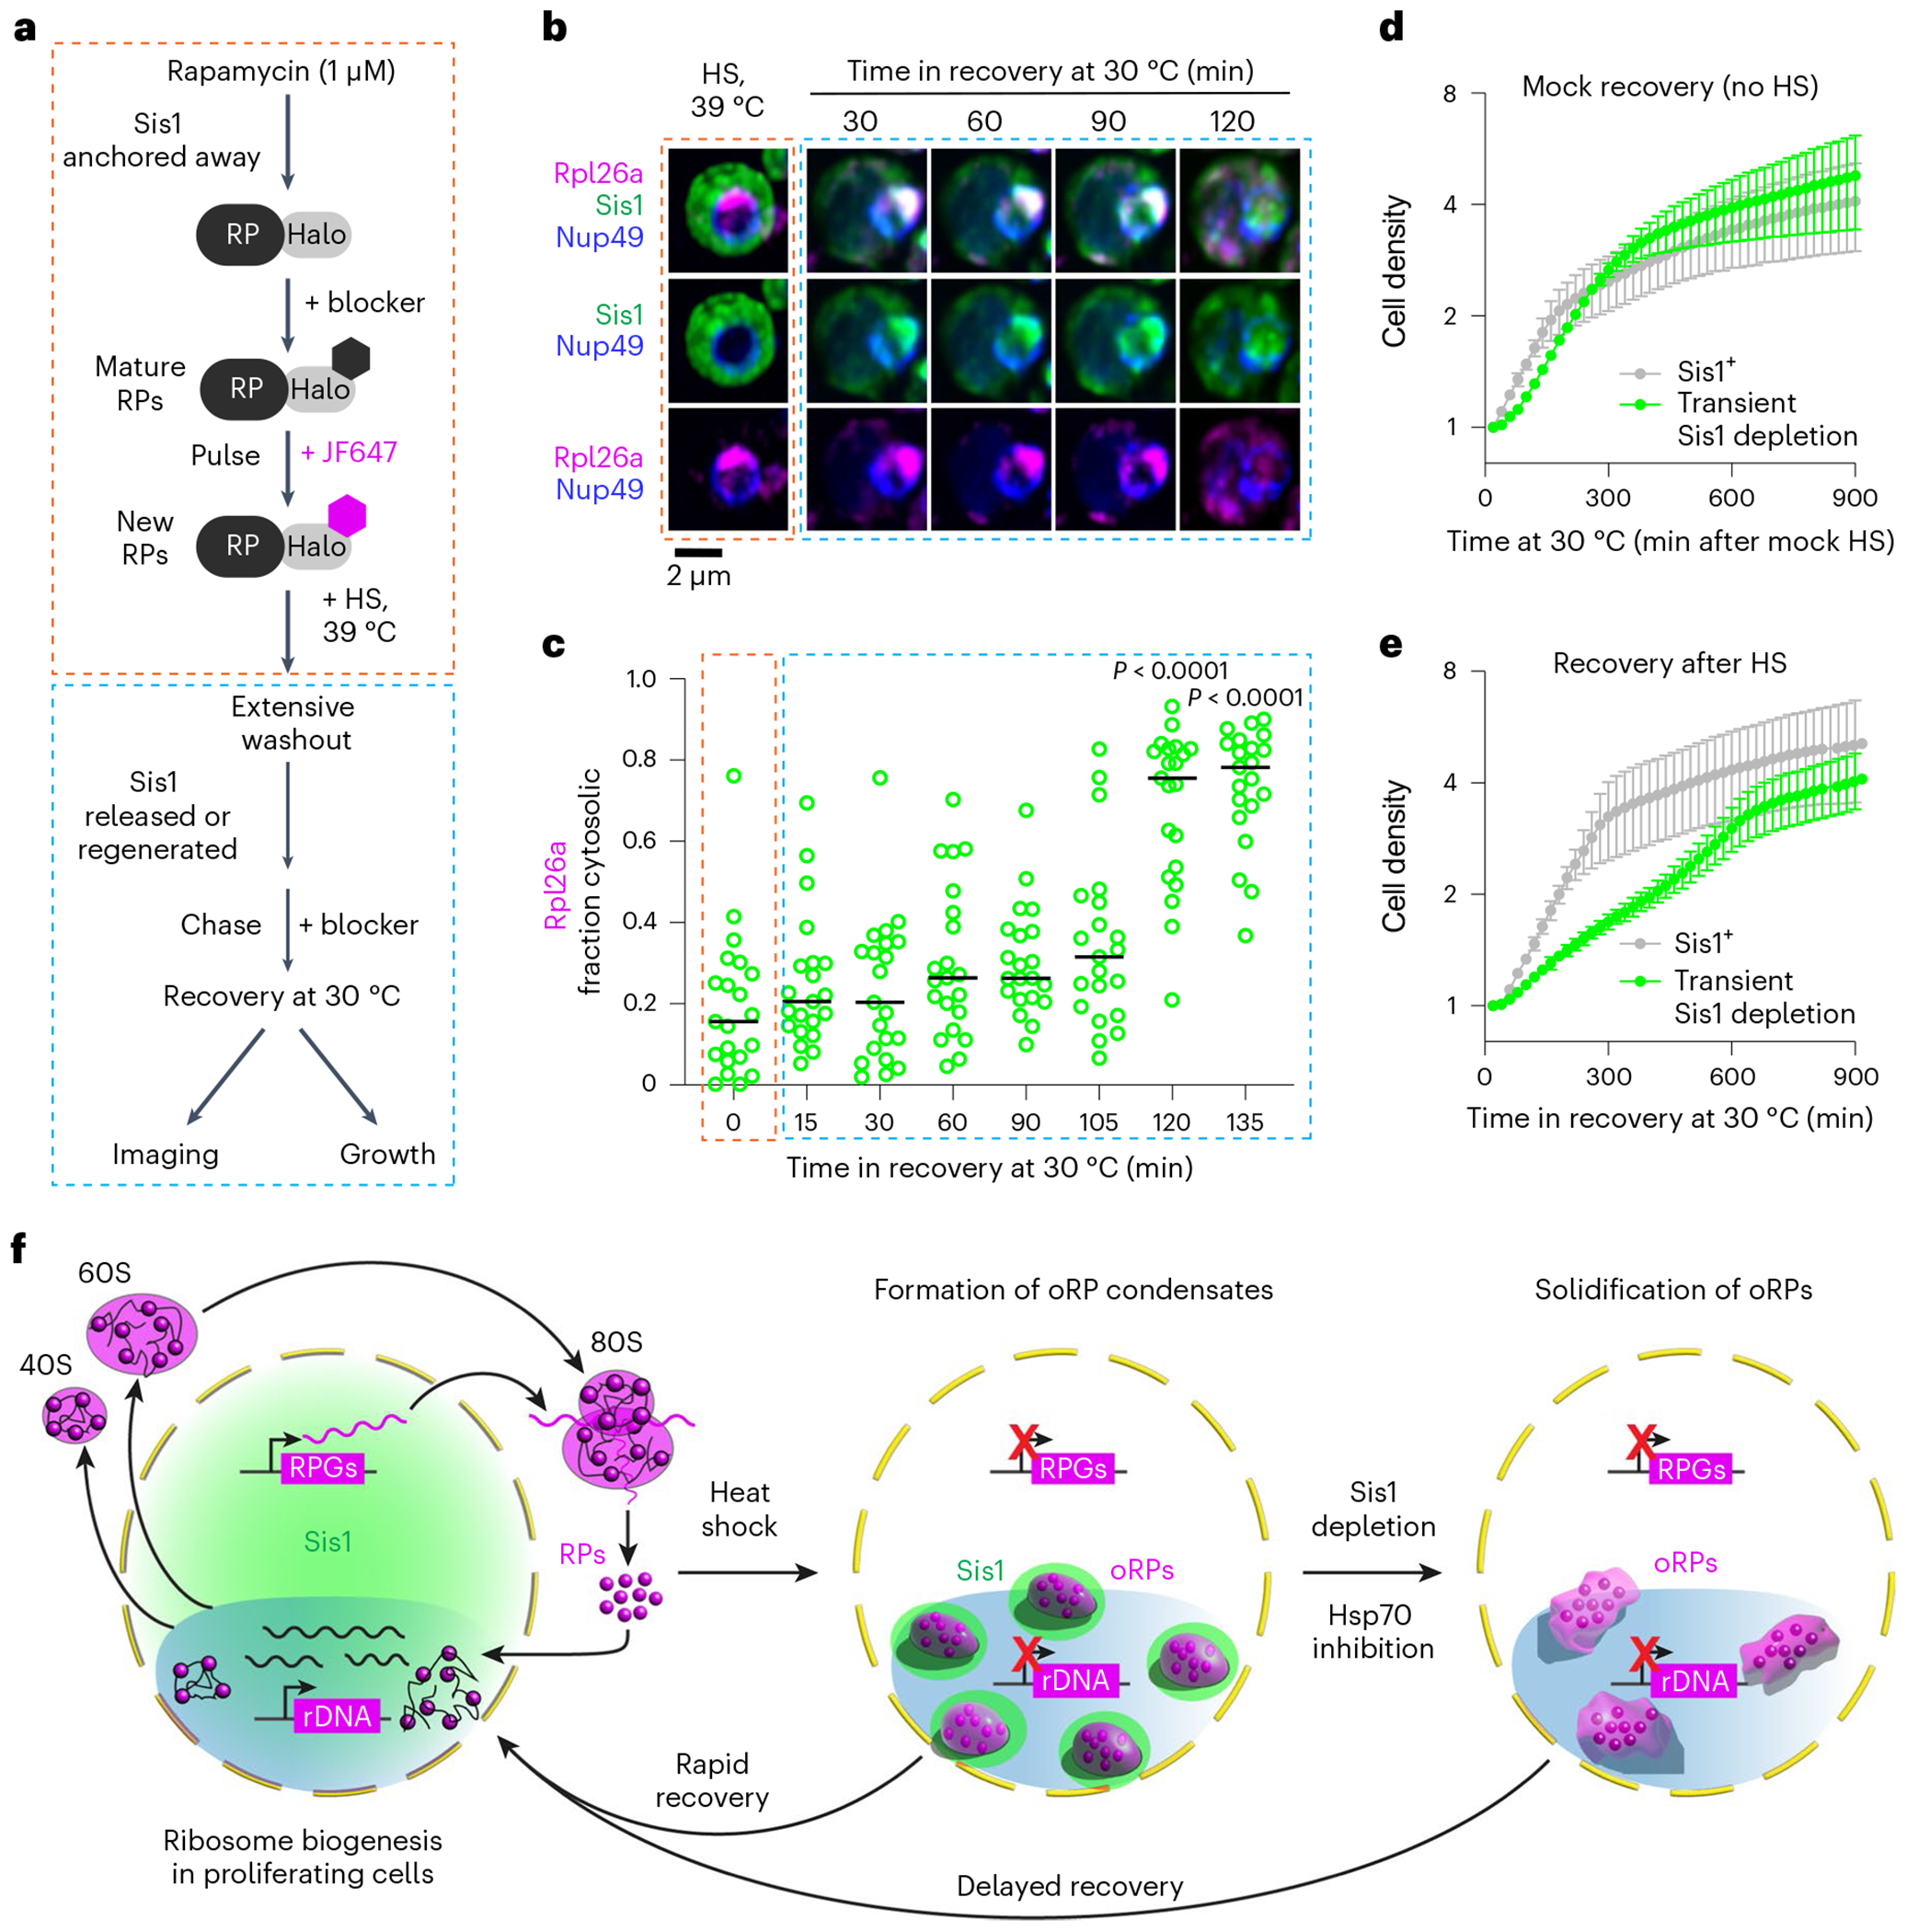
Ribosome biogenesis is among the most resource-intensive cellular processes, with ribosomal proteins accounting for up to half of all newly synthesized proteins in eukaryotic cells. During stress, cells shut down ribosome biogenesis in part by halting rRNA synthesis, potentially leading to massive accumulation of aggregation-prone 'orphan' ribosomal proteins (oRPs). Here we show that, during heat shock in yeast and human cells, oRPs accumulate as reversible peri-nucleolar condensates recognized by the Hsp70 co-chaperone Sis1/DnaJB6. oRP condensates are liquid-like in cell-free lysate but solidify upon depletion of Sis1 or inhibition of Hsp70. When cells recover from heat shock, oRP condensates disperse in a Sis1- and Hsp70-dependent manner, and the oRP constituents are incorporated into functional ribosomes in the cytosol, enabling cells to efficiently resume growth. Preserving biomolecules in reversible condensates-like mRNAs in cytosolic stress granules and oRPs at the nucleolar periphery-may be a primary function of the Hsp70 chaperone system.


Conflict of interest statement

Competing interests

We declare that none of the authors has competing financial or non-financial interests.

Figures

Extended Data Fig. 1 |
Extended Data Fig. 1 |. Sis1 localization and interactions during heat shock.
(a) Left: Schematic of how to bisect the nucleus with the nucleolus on one side by finding the line angle with the maximum difference in signal of the nucleolar marker in the two halves. Middle: Representative 2D projections of cells showing Nsr1 (blue) to mark the nucleolus and Sis1 (green). Line is set to maximize the difference in nucleolar signal and the ratio of Sis1 in the two halves is calculated. Right: Sis1 ratio as a function of the line angle rotated as depicted in the schematic to the left. (b) Quantification of Sis1 cytosolic foci per cell in the conditions listed. Foci were identified using the FindFoci plugin in ImageJ. Statistical significance was determined by Brown-Forsythe and Welch one-way ANOVA test followed by Games-Howell multiple comparison tests. n obtained from 3 independent experiment. (c) Volcano plot of Sis1-APEX2 interactors during heat shock. (d) Scatter plot showing the percentage of disorder in Sis1 interactors relative the whole proteome. P values were calculated with unpaired two-tailed Welch’s t-test. n = 2 biological replicates. Each dot symbolizes individual proteins, with ‘n’ representing 5151 proteins for the entire yeast proteome and 731 proteins for the Sis1 interactors induced by heat shock. Data is representative of 2 biologically independent experiments. (e) Bar plots representing the amino acid sequences enrichment of the Sis1 interactors compared to the yeast proteome. Data is representative of 2 biologically independent experiments. (f) Biological replicates of Sis1-3xFlag IP interactors.
Extended Data Fig. 2 |
Extended Data Fig. 2 |. Interaction and localization of pulse-labeled ribosomal proteins with Sis1.
(a) IP of Sis1-3xFlag and either mature or new Rpl25-Halo and Rps9a-Halo from cells left unstressed or heat shocked at 39 °C for the indicated times. n = 2 biologically independent experiment. (b) In the absence of heat shock, pulse-labeled RPs localize immediately to the cytosol. Micrograph represents data obtained from 3 biologically independent experiments. (c) Left Panel: Lattice light sheet live imaging of yeast under heat shock (39 °C, 10 min) expressing Sisl-mVenus and labeled for either new or mature Rpl25-Halo. Right Panel: Dot plot representing the colocalization coefficient (Mander’s overlap coefficient) of Sis1-mVenus with either mature or new Rpl25-Halo in heat shocked cells (39 °C, 10 min). n = number of cells pooled from 3 biologically independent replicates. (d) As in (c) but for Rps9a-Halo. n = number of cells pooled from 3 biologically independent replicates. (e) As in (c) but for the latejoining subunit Rpl29-Halo. n = number of cells pooled from 3 biologically independent replicates. (f) As in (c) but for the late joining subunit Rps3-Halo. n = number of cells pooled from 3 biologically independent replicates. P values were calculated with unpaired two-tailed Welch’s t-test.
Extended Data Fig. 3 |
Extended Data Fig. 3 |. Localization of pre-60S ribosome biogenesis factors during heat shock.
(a) Illustrate showing the association of assembly factors with various states of pre60S maturation. Clustering and coloration in the diagram indicate the time points of stable association and dissociation from the maturing particle, as denoted by the horizontal lines. (b-p) LLS imaging of Live cells representing the localization of oRpl26a during heat shock in context of pre-60S ribosome assembly factors as depicted in (a). Scale bar = 2 μm. Inset shows the normalized line scan graph of representing assembly factors across the oRpl26a signal.
Extended Data Fig. 4 |
Extended Data Fig. 4 |. Cell biological and transcriptional effects of Ifh1 depletion during heat shock.
(a) Immunoblot showing of the level of Ifh1-mAID-3xFlag upon incubation with 5ph-IAA and β-estradiol. PGK1 level is used as loading control between the samples. (b) HSE-YFP reporter heat shock time course showing reduced HSR induction when Ifh1 is depleted. Data are presented as mean ± S.D. n = 3 biologically independent sample. (c) RT-qPCR of the HSR target gene transcript SSA4 over a heat shock time course in the absence and presence of Ifh1 depletion. Data are presented as mean ± S.D n = 3 biologically independent sample. (d) LLS live-imaging of yeast cells with endogenously tagged Sis1-mVenus (green), Hsp104-TFP (blue), Sec61-Halo (red) and Nsr1-mScarlet-I (white) under non-stress (30 °C) and heat shock (39 °C, 10 min) in the absence and presence of Ifh1 depletion. (e) Quantification of Sis1 cytosolic foci per cell in the conditions shown in (d). Statistical significance was assessed using the Brown-Forsythe and Welch ANOVA test, along with Games-Howell multiple post hoc comparisons. n denotes number of cells from 3 independent experiment.
Extended Data Fig. 5 |
Extended Data Fig. 5 |. oRP condensates are stable and heat shock-dependent.
(a) oRP proteins are stable (not degraded) in condensates in cells. (b) oRP condensates are more abundant in lysate from heat-shocked cells. Micrograph represents data of 3 biologically independent experiments.
Extended Data Fig. 6 |
Extended Data Fig. 6 |. Temperature scan and RNA assessment of oRP condensates.
(a) Illustrate depicting the workflow to label newly synthesized RP in yeast and lysate preparation to conduct temperature scan. (b) Micrograph of oRP condensate prepared from non-stressed or heat shocked yeast and upon incubation at indicated temperature. n = 3 biologically independent experiments. (c) RNA dye (SYTO RNASelect, 0.5 mM, 10 min) is excluded from the oRP condensate. n = 3 biologically independent experiments. (d) oRP condensates are resistant to RNaself (5units/μl, 15 min, 25 °C). (e) Quantification of number of droplets per field in buffer or RNaself treatment to the lysate. P values were calculated with unpaired two-tailed Welch’s t-test. n is representing number of droplets quantified in microscopic field of 53 and 42 for Buffer and RNasel conditions respectively.
Extended Data Fig. 7 |
Extended Data Fig. 7 |. Effect of Hsp70 inhibition and hexanediol on oRP condensates in lysate.
(a) Effect of Hsp70 inhibition in the morphology of Rpl26a and Sis1 condensates. (b) Effect of 5% 1,6-HD upon the condensates with or without Hsp70 inhibition. The micrograph represents data derived from 3 independent experiments.
Extended Data Fig. 8 |
Extended Data Fig. 8 |. oRPs in condensates are not degraded and are transported to the cytosol upon recovery.
(a) Live cell time lapse imaging of the spatial distribution of Rps4b (magenta) and Sis1-mVenus (green) during sustained heat shock and recovery. (b) Quantification of the fraction of cytosolic Rps4b signal under sustained HS or recovery. Statistical significance was established using the Brown-Forsythe and Welch one-way ANOVA test, followed by Dunnett T3 multiple comparison analyses. n = number of cells pooled from 3 biologically independent replicates. (c) Fraction of total pulse labeled Rpl26a or Rps4b remaining after chase for 15 minutes at indicated temperature. n=number of cells pooled from 3 biologically independent replicates.
Extended Data Fig. 9 |
Extended Data Fig. 9 |. oRP condensate reversibility depends upon Sis1 availability.
(a) imaging of Sis1-mVenus (green) and Nup49-mScarlet-I (red) following Sis1 depletion or not. (b) Quantification of fraction of nuclear Sis1 upon Sis1 depletion or not. P values were calculated with unpaired two-tailed Welch’s t-test. n denotes number of cells as obtained from 4 independent experiment. n = number of cells pooled from 4 biologically independent replicates. (c) LLS imaging of Hsp104-mKate2 during heat shock (39 °C, 15 mins) pre-depleted for Sis1 (green) or not. (d) Quantification of Hsp104-mKate2 foci per cell for (c). P values were calculated with unpaired two-tailed Welch’s t-test. n denotes number of cells from 3 independent experiments. n = number of cells pooled from 3 biologically independent replicates. (e) LLS live cell imaging of Rps4b (magenta) and the nucleolar marker Nsr1 (blue) during heat shock and recovery in the absence or presence of Sis1 depletion. (f) Quantification of the fraction of cytosolic Rps4b under sustained HS or recovery in the absence or presence of Sis1 depletion. P values were calculated with unpaired two-tailed Welch’s t-test. n denotes number of cells obtained from 3 independent experiment. n = number of cells pooled from 3 biologically independent replicates.
Fig. 1 |
Fig. 1 |. Sis1 localizes to the nucleolar periphery and interacts with RPs during heat shock.
a, Lattice light sheet live imaging of yeast cells with endogenously tagged Sis1–mVenus (green), Hsp104–TFP (blue), Sec61–Halo (red) and Nsr1–mScarlet-I (white) under non-stress (30 °C), heat shock (39°C, 2.5 and 10 min) and pre-treatment with CHX (50 μg ml−1, 5 min) followed by heat shock (39 °C, 10 min). b, Single-cell quantification of Sis1 nucleolar proximity defined as the ratio of mean Sis1 intensity in the half of the nucleus containing the nucleolus to the mean Sis1 intensity in the other half of the nucleus. Statistical significance was determined by Brown–Forsythe and Welch’s one-way ANOVA analysis, coupled with Games–Howell post hoc multiple comparisons. n denotes number of cells, pooled from four biologically independent replicates for 0, 2.5 and 10 min heat shock (HS) and from five biologically independent replicates for CHX pre-treatment followed by the 10 min heat shock (CHX + 10 min HS) conditions. c, Top: schematic of in vivo proximity labelling of Sis1–APEX2 followed by MS analysis. Bottom: enrichment of proteins labelled by Sis1–APEX2 following HS in two biological replicates. RPs highlighted in magenta. UPS, ubiquitin-proteasome system. d, Top: workflow to IP Sis1–3xFlag following heat shock (39°C, 10 min) pre-treated with either vehicle or CHX (50 μg ml−1, 5 min). Bottom: volcano plot demonstrating magnitude and statistical significance of CHX sensitivity of Sis1 interactors. e, Venn diagram of proteins identified in c and d. f, Gene Ontology (GO) terms enriched among the 178 intersection proteins from e. Yeastmine (http://yeastmine.yeastgenome.org/yeastmine) was employed to carry out GO analysis and Bonferroni test corrections were used to account for multiple testing and P value determination.
Fig. 2 |
Fig. 2 |. oRPs interact with Sis1/DnaJB6 at the nucleolar periphery.
a, Workflow for in vivo pulse-labelling of mature and new RPs. b, IP of Sis1–3xFlag and either mature or new Rpl26a–Halo from cells left unstressed or heat shocked at 39 °C for the indicated times. n = 2 biologically independent experiment. LSU, 60S large subunit. c, As in b, but for Rps4b–Halo. n = 2 biologically independent experiment. SSU, 40S small subunit. d, Lattice light sheet live imaging of yeast under heat shock (39 °C, 10 min) expressing Sis1–mVenus and labelled for either new or mature Rpl26a–Halo. The dashed line indicates the cellular boundary. e, As in c, but for Rps4b–Halo. f, Co-localization (Mander’s overlap coefficient) of Sis1–mVenus with either mature or new Rpl26a–Halo in heat-shocked cells (39 °C, 10 min). P values were calculated with unpaired two-tailed Welch’s t-test. n indicates number of cells, pooled from four independent biological replicates. g, As in f, but for Rps4b–Halo. P values were calculated with unpaired two-tailed Welch’s t-test. n indicates number of cells, pooled from four independent biological replicates. h, Human HCT116 cells stably expressing RPL26–Halo labelled for mature or new RPL26 and heat shocked (43 °C for 30 min). Cells were fixed and immunostained for DnaJB6 and NPM1. Dashed line indicates the nuclear boundary. i, Co-localization (Mander’s overlap coefficient) of DnaJB6 with either mature or new RPL26–Halo in heat-shocked cells (43 °C, 30 min). P values were calculated with unpaired two-tailed Welch’s t-test. n indicates number of cells, pooled from three independent biological replicates.
Fig. 3 |
Fig. 3 |. RPs drive Sis1/DnaJB6 localization to the nucleolar periphery.
a, Dilution series spot assay of yeast cells expressing Ifh1–mAID with or without β-oestradiol-inducible OsTIR1(F74G) spotted on to rich medium supplemented with either β-oestradiol (1 μM) alone or with 5ph-IAA (5 μM) grown for 48 h. b, Scatter plot of RNA-seq data from Ifh1–mAID/OsTIR1(F74G) treated with β-oestradiol alone or along with 5phIAA for 30 min. RiBi factors (cyan) and ribosomal protein genes (RPGs, magenta) are highlighted. NHS, non heat shock c, Ifh1-dependent fold change in expression in heat-shocked cells showing a reduction in Hsf1 target gene induction but not Msn2 target induction. Statistical significance was assessed using the Brown–Forsythe and Welch one-way ANOVA, followed by Dunnett T3 multiple comparison tests. Each dot symbolizes individual genes, where n = 4,983, 42 and 90 for all genes, Hsf1 target genes and Msn2 target genes, respectively. Gene expression analysis was carried out across two biologically independent experiments. d, Lattice light sheet imaging of the distribution of Sis1–mVenus in non-stressed cells, heat-shocked cells and heat-shocked cells depleted for Ifh1. e, Quantification of Sis1 nucleolar proximity during heat shock (HS) in cells with Ifh1 and following Ifh1 depletion. Statistical significance was determined by Brown–Forsythe and Welch’s one-way ANOVA analysis combined with Games–Howell post hoc multiple comparisons. n indicates number of cells, pooled from four and five biologically independent replicates for Ifh1+ and Ifh1-depleted conditions, respectively. f, Immunostaining of HCT116 cell lines for DnaJB6 (green) and NPM1 (blue) under non-stressed conditions, heat shock (43 °C, 30 min) and heat shock of cells pre-treated with Torin1 (300 nM, 30 min). g, Quantification of co-localization (Mander’s overlap coefficient) of NPM1 and DnaJB6 in single cells in the conditions in f. Statistical significance was assessed using the Brown–Forsythe and Welch one-way ANOVA, followed by Dunnett T3 multiple comparison tests. n indicates number of cells, pooled from three, four and three biologically independent replicates for NHS, HS, and HS + torin1 conditions, respectively.
Fig. 4 |
Fig. 4 |. oRPs form dynamic condensates that are stable in cell-free extract.
a, 4D LLS imaging of Sis1–mVenus (green) and oRpl26a (magenta). b, Effect of 1,6-HD and 2,5-HD on Sis1 localization and oRP condensates. Cells were heat shocked for 10 min and incubated with either 5% 1,6 HD or 2,5 HD for 2 min. 1,6-HD was washed out for an additional 2 min at heat shock temperature, and cells were imaged again. Micrograph represents data of three biologically independent experiment. c, Imaging of mature and new Rpl26a–Halo and Rps4b–Halo along with Sis1–mVenus in cell-free lysate from heat-shocked cells. Micrograph represents data of four independent experiments. d, Time lapse imaging of heat-shocked cell-free lysate depicting fission and fusion of oRpl26a droplets. e, Depletion ofATP (apyrase, 0.05 units μl−1) or inhibition of Hsp70 (VER-155008, 50 μM) activity in the lysate resulted in the formation of irregular clumps of oRpl26a. The micrograph illustrates data from three independent experiments. f, Heat map representing the normalized variance of pixel photon count over time within the heat shock-induced oRpl26a condensate and upon Hsp70 inhibition. Data are representative of seven and five condensates of untreated and Hsp70 inhibited conditions pooled from three biologically independent experiments. g, Shot noise-normalized intensity over time of the most variable pixel from an oRpl26a condensate in lysate with versus without Hsp70 inhibition. Data are representative of seven and five condensates of untreated and Hsp70 inhibited conditions pooled from three biologically independent experiments. h, Violin plots showing the distribution of normalized pixel variance of oRpl26a in condensates over time in lysate with and without Hsp70 inhibition. P values were calculated with unpaired two-tailed Welch’s t-test. n = 7 and 5 condensates in untreated and Hsp70 inhibited conditions pooled from three biologically independent experiments. i, MSD traces have decreased slope for beads in Hsp70-inhibited condensates. n = 7 condensates for each condition pooled from three biologically independent experiments. j, Inhibition of Hsp70 activity in lysate leads to 20× decrease in the effective diffusion coefficient (D) of beads inside the condensates (mean D untreated 0.73 μm2 s−1, s.d. 0.55 μm2 s−1; mean D inhibited 0.038 μm2 s−1, s.d. 0.031 μm2 s−1). Box plots display medians at their centres and are enclosed by the first and third quartiles. Whiskers extend to 1.5 times the interquartile range (IQR) on both ends. Each condition was analysed using seven condensates, sourced from three biologically independent experiments. P values were calculated with unpaired two-tailed Student’s t-test.
Fig. 5 |
Fig. 5 |. oRP condensates are reversible upon recovery from heat shock.
a, Workflow to evaluate the fate of oRPs during sustained heat shock (HS) or recovery. b, Representative live-cell time lapse images of the spatial distribution of oRpl26a (magenta) and Sis1–mVenus (green) during sustained heat shock. c, As in b but following recovery from heat shock. d, Quantification of the fraction of cytosolic Rpl26a signal under sustained heat shock or recovery. Statistical significance was assessed using the Brown–Forsythe and Welch one-way ANOVA test, followed by Dunnett T3 multiple comparison tests. n indicates number of cells pooled from three biologically independent replicates. e, Polysome profiles of yeast expressing Rpl26a–Halo during non-stress, heat shock and recovery conditions. f, In-gel fluorescence of oRpl26a across the polysome profile in heat shock and recovery. g, Localization of oRPL26 (magenta) in HCT116 cells following heat shock and recovery. Cells were fixed and immunostained for DnaJB6 (green) and NPM1 (blue). h, Quantification of the fraction of cytosolic RPL26 in HCT116 cells under sustained heat shock or recovery. P values were calculated with unpaired two-tailed Welch’s t-test. n indicates number of cells pooled from three biologically independent replicates.
Fig. 6 |
Fig. 6 |. Sis1 and Hsp70 promote oRP condensate reversibility.
a, LLS imaging of oRpl26a (magenta) and the nucleolar marker Nsr1 (blue) during heat shock and recovery in the absence or presence of Sis1 depletion. b, Quantification of the fraction of cytosolic Rpl26a under sustained HS or recovery in the absence or presence of Sis1 depletion. P values were calculated with unpaired two-tailed Welch’s t-test. n indicates number of cells pooled from three biologically independent replicates. c, Depletion of Sis1 resulted in formation of irregular clumps of Rpl26a in lysate. d, Distribution of normalized pixel variance of Rpl26a in condensates over time in control lysate and lysate with Sis1 depletion. Control lysate distribution replotted from Fig. 4a. P values were calculated with unpaired two-tailed Welch’s t-test. n = 7 and 5 condensates of SIS1+ and Sis1-depleted conditions pooled from three biologically independent experiments. e, Micrograph representing the localization of oRPL26 (magenta) in NPM1-immunostained HCT116 cells following recovery from heat shock pre-treated for DMSO or Hsp70 inhibitor (VER-155008, 50 μM). f, Quantification of the fraction of cytosolic RPL26 from e. P values were calculated with unpaired twotailed Welch’s t-test. n indicates number of cells pooled from three biologically independent replicates.
Fig. 7 |
Fig. 7 |. oRP condensate reversibility promotes growth recovery following stress.
a, Workflow of transient Sis1 depletion in oRpl26a-labelled yeast. b, LLS imaging of oRPl26a (magenta) and the nuclear membrane marker Nup49 (blue), in Sis1 (green) transient depleted condition during the period of heat shock (HS) and recovery. c, Quantification of the fraction of cytosolic oRpl26a from b. n denotes number of cells pooled from three biologically independent replicates. P values were computed using a Brown–Forsythe and Welch one-way ANOVA test, followed by Dunnett T3 multiple comparison tests. d, Growth curve of cells following ‘recovery’ from mock heat shock in the absence or presence of transient Sis1 depletion. Mean and standard deviation of three biological replicates are plotted. e, Growth curve of cells following recovery from heat shock in the absence or presence of transient Sis1 depletion. Mean and standard deviation of three biological replicates are plotted. f, Model of oRP preservation during stress in chaperone-stirred condensates. RPG, ribosomal protein gene.

Similar articles

Cited by

References

    1. Warner JR The economics of ribosome biosynthesis in yeast. Trends Biochem. Sci 24, 437–440 (1999). - PubMed
    1. Maaløe O & Kjeldgaard NO Control of macromolecular synthesis; a study of DNA, RNA, and protein synthesis in bacteria. (W. A. Benjamin, 1966).
    1. Scott M, Klumpp S, Mateescu EM & Hwa T Emergence of robust growth laws from optimal regulation of ribosome synthesis. Mol. Syst. Biol 10, 747 (2014). - PMC - PubMed
    1. Lempiainen H & Shore D Growth control and ribosome biogenesis. Curr. Opin. Cell Biol 21, 855–863 (2009). - PubMed
    1. Ingolia NT, Ghaemmaghami S, Newman JR & Weissman JS Genome-wide analysis in vivo of translation with nucleotide resolution using ribosome profiling. Science 324, 218–223 (2009). - PMC - PubMed

MeSH terms

Substances