. 2023 Oct 16;6(1):1047.
doi: 10.1038/s42003-023-05426-5.

MafB regulates NLRP3 inflammasome activation by sustaining p62 expression in macrophages

Affiliations

MafB regulates NLRP3 inflammasome activation by sustaining p62 expression in macrophages

Huachun Cui et al. Commun Biol. .

Abstract

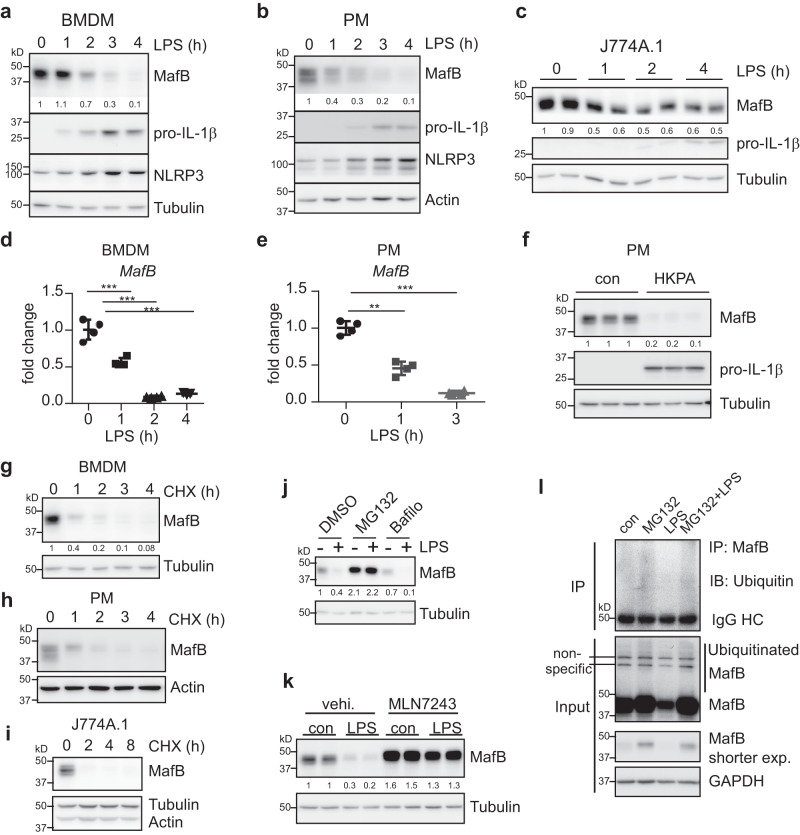
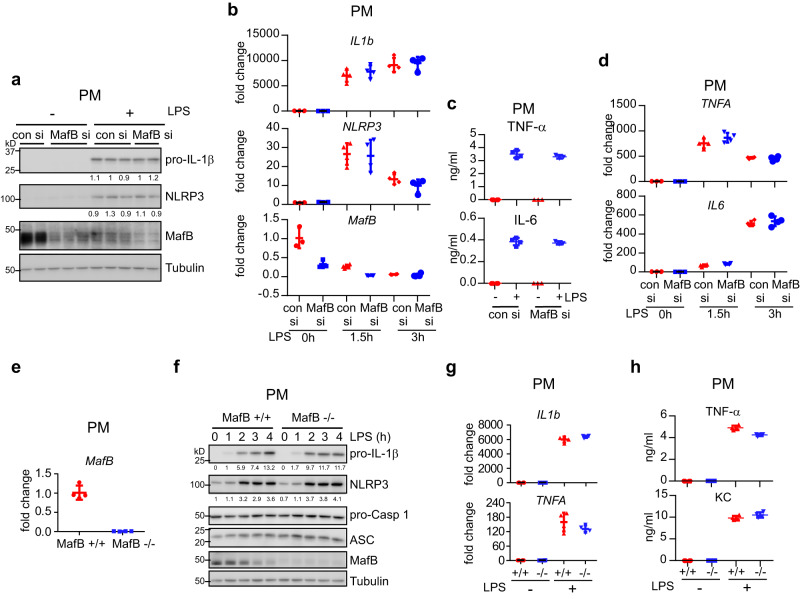
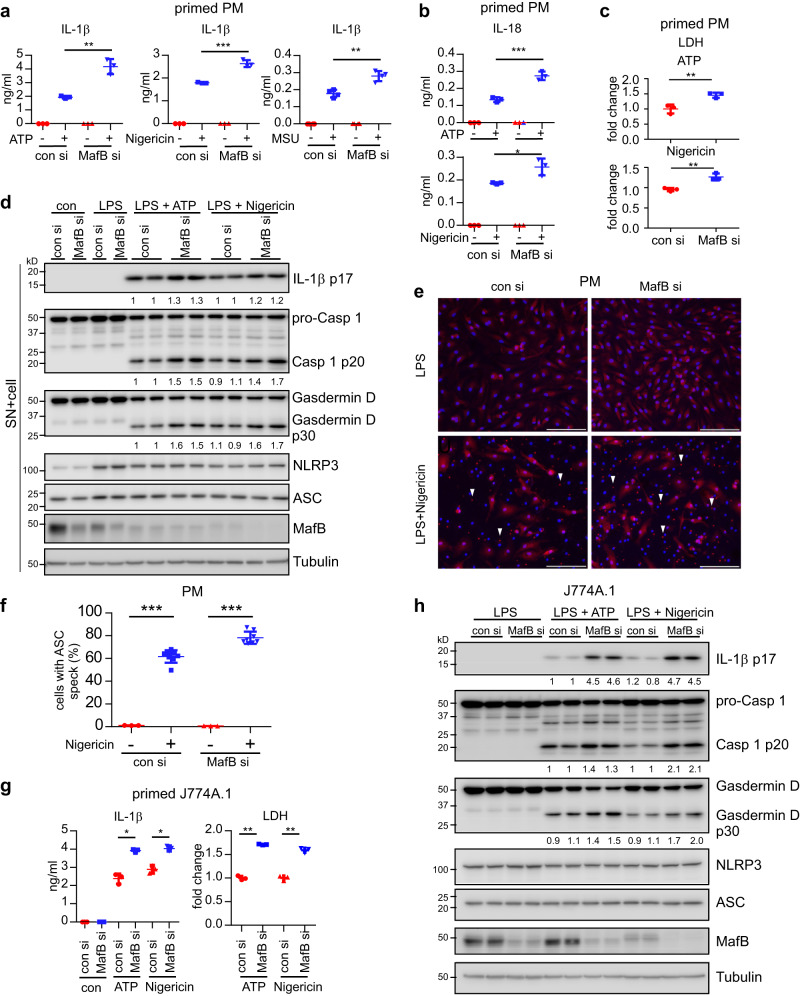
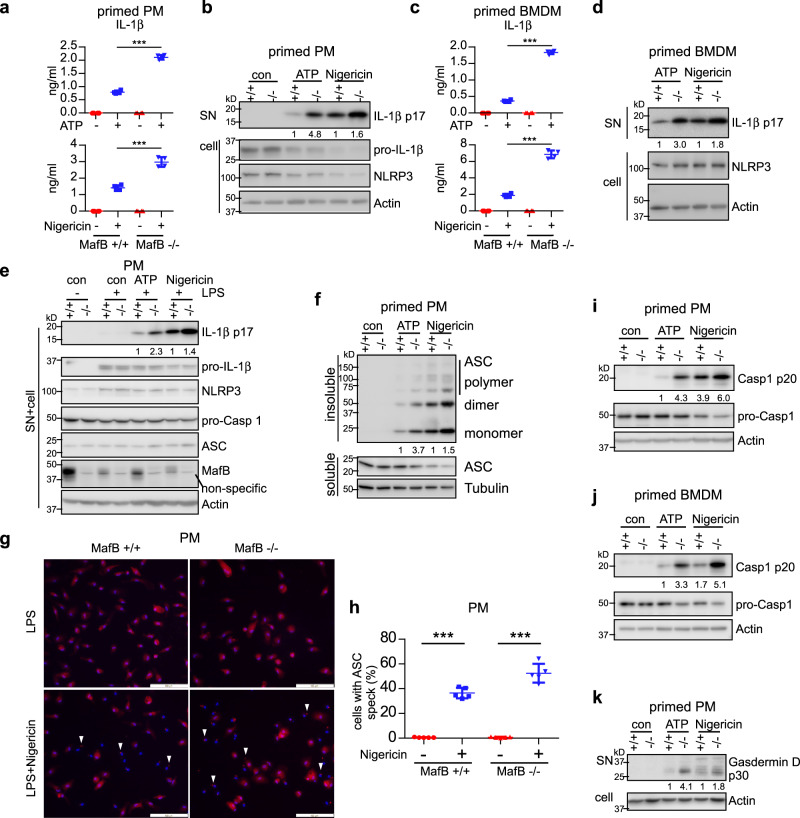
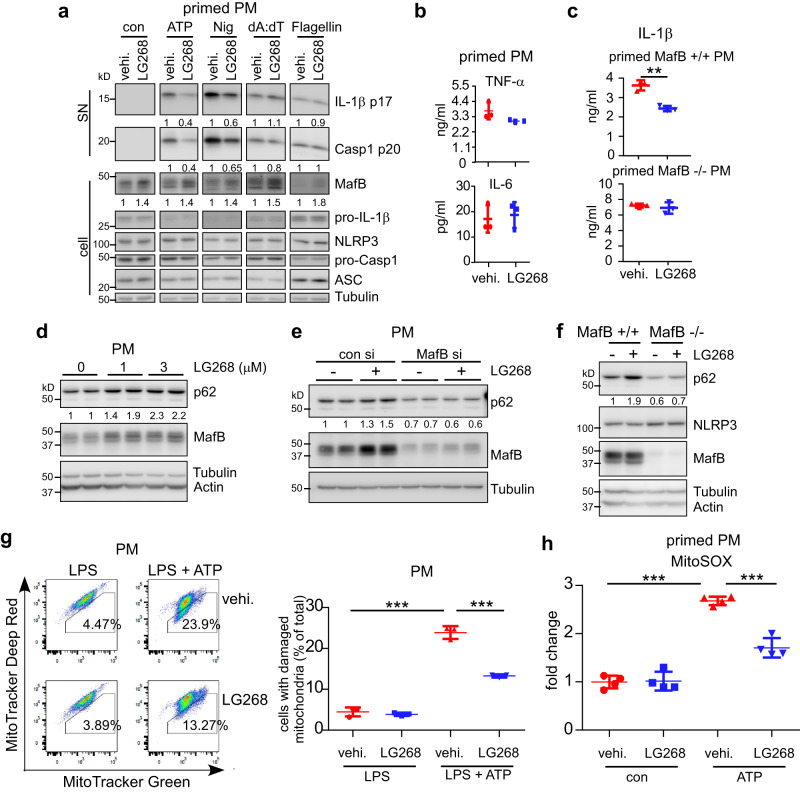
Activation of the NLRP3 inflammasome is a two-step process: the priming and the activating. The priming step involves the induction of NLRP3 and pro-IL-1β, while the activating step leads to the full inflammasome activation triggered by a NLRP3 activator. Although mechanisms underlying the NLRP3 inflammasome activation have been increasingly clear, the regulation of this process remains incompletely understood. In this study, we find that LPS and Pseudomonas aeruginosa cause a rapid downregulation in MafB transcription in macrophages, which leads to a quick decline in the level of MafB protein because MafB is short-lived and constantly degraded by the ubiquitin/proteasome system. We find that MafB knockdown or knockout markedly enhances the NLRP3, but not the NLRP1, NLRC4, or AIM2, inflammasome activation in macrophages. Conversely, pharmacological induction of MafB diminishes the NLRP3 inflammasome activation. Mechanistically, we find that MafB sustains the expression of p62, a key mediator of autophagy/mitophagy. We find that MafB inhibits mitochondrial damage, and mitochondrial ROS production and DNA cytoplasmic release. Furthermore, we find that myeloid MafB deficient mice demonstrate increased systemic and lung IL-1β production in response to LPS treatment and P. aeruginosa infection and deficient lung P. aeruginosa clearance in vivo. In conclusion, our study demonstrates that MafB is an important negative regulator of the NLRP3 inflammasome. Our findings suggest that strategies elevating MafB may be effective to treat immune disorders due to excessive activation of the NLRP3 inflammasome.


Conflict of interest statement

The authors declare no competing interests.

Figures

Fig. 1
Fig. 1. MafB undergoes a rapid downregulation in response to LPS and P. aeruginosa, coinciding with the NLRP3 inflammasome priming in macrophages.
ac BMDMs, PMs and J774A.1 macrophages were treated with or without 100 ng/ml LPS for the indicated time. Levels of the indicated proteins in the cells were determined by western blotting. Vertically stacked bands in (a) originate either from a single membrane or from a replicate membrane, with the same sample loadings. d, e BMDMs and PMs were treated with LPS for the indicated time. mRNA levels of MafB in the cells were determined by real-time PCR. Representative of three independent experiments. f PMs were treated with or without 1 × 107/ml HKPA for 4 h. Protein levels were determined by western blotting. gi BMDMs, PMs and J774A.1 cells were treated with or without 5 µg/ml CHX for the indicated time. Levels of the indicated proteins were determined by western blotting. j BMDMs were pre-treated with 10 μM MG132 or 10 nM Bafilomycin A1 for 30 min, followed by LPS treatment for 3 h. k J774A.1 cells were pre-treated with or without 1 µM MLN7243 for 30 min, followed by LPS treatment for 3 h. l BMDMs were pre-treated with MG132 for 30 min, followed by treatment of LPS for another 3 h. Cellular extracts were prepared, followed by immunoprecipitation with MafB antibody. Western blotting with the IP and input samples was performed. Mean ± SD; **P < 0.01, ***P < 0.001. Protein densitometric analyses were performed using ImageJ (NIH) and shown under their corresponding bands. Representative of three independent experiments. HKPA heat-killed Pseudomonas aeruginosa, CHX cycloheximide, Bafilo Bafilomycin A1, vehi. vehicle.
Fig. 2
Fig. 2. MafB does not participate in the LPS induced early pro-inflammatory response or the expression of NLRP3 and pro-IL-1β.
a PMs were transfected with 50 nM control or MafB siRNAs. Forty-eight hours after transfection, cells were treated with or without 100 ng/ml LPS for 3 h. Protein levels were determined by western blotting. Vertically stacked bands originate either from a single membrane or from a replicate membrane, with the same sample loadings. b PMs were transfected and treated similarly to (a). mRNA levels of the indicated genes were determined by real-time PCR. c PMs were transfected and treated as in (a). Supernatant TNF-α and IL-6 levels were determined by ELISA. d PMs were transfected and treated as in (b). The expression of the indicated genes were determined by real-time PCR. e, f MafB+/+ and MafB−/− PMs were treated with LPS. MafB mRNA levels were determined by real-time PCR (e). Protein levels were determined by western blotting (f). g, h MafB+/+ and MafB−/−. PMs were treated with or without LPS. mRNA levels and supernatant TNF-α and keratinocyte-derived chemokine (KC) were determined by real-time PCR and ELISA, respectively. Mean ± SD. Representative of three independent experiments.
Fig. 3
Fig. 3. MafB knockdown promotes the activation of the NLRP3 inflammasome.
ac PMs were transfected with 50 nM control or MafB siRNAs. Forty-eight hours after transfection, cells were treated with 100 ng/ml LPS for 3 h. Cells were then washed and stimulated with or without ATP (5 mM), Nigericin (5 uM) or MSU (1 mM) in serum-free media for an additional 1 h. Levels of the supernatant IL-1β (a) and IL-18 (b) were determined by ELISA. Levels of the supernatant LDH (c) were determined by LDH assay. d PMs were transfected, primed and stimulated with the NLRP3 agonists as in (a). Supernatant proteins were precipitated by TCA and combined with the respective cellular extracts. Levels of the indicated proteins were determined by western blotting. Vertically stacked bands originate either from a single membrane or from a replicate membrane, with the same sample loadings. e, f PMs were transfected with control siRNAs or MafB siRNAs. Forty-eight hours after transfection, cells were primed with LPS for 3 h, followed by stimulation with or without Nigericin for 1 h. Cells were then fixed with 4% PFA and subjected to immunofluorescence staining for ASC. Scale bars: 100 μm (e). ASC specks in the cells were quantified (f). n = 3–8. g, h J774A.1 macrophages were transfected with control siRNAs or MafB siRNAs. 48 h after transfection, cells were primed with LPS for 4 h, followed by stimulation with or without ATP (5 mM) or Nigericin (10 μM) for 1 h. Levels of the supernatant IL-1β and LDH were determined (g). Levels of the indicated proteins in the supernatants and cells were determined by western blotting (h). Vertically stacked bands originate either from a single membrane or from a replicate membrane, with the same sample loadings. Mean ± SD; *P < 0.05, **P < 0.01, ***P < 0.001. Representative of three independent experiments. LDH lactate dehydrogenase.
Fig. 4
Fig. 4. MafB −/− macrophages demonstrate enhanced activation of the NLRP3 inflammasome.
ad Primed MafB+/+ and MafB−/− PMs (a, b) and BMDMs (c, d) were washed and stimulated with or without NLRP3 agonists ATP (5 mM) or Nigericin (5 μM) for 1 h. Levels of the supernatant IL-1β were determined by ELISA (a, c), and levels of the indicated proteins in the cells were determined by western blotting (b, d). e MafB+/+ and MafB−/− PMs were treated as in (a). Levels of the indicated proteins in the combined extracts of supernatants and cells were determined by western blotting. Vertically stacked bands originate either from a single membrane or from a replicate membrane, with the same sample loadings. f Primed MafB+/+ and MafB−/− PMs were treated as in (a). Triton X-100 soluble and insoluble extracts were prepared. Insoluble extracts were cross-linked and ASC oligomerization determined. g, h Primed MafB+/+ and MafB−/− PMs were stimulated with or without Nigericin for 1 h. Cells were then fixed with 4% PFA and subjected to immunofluorescence staining for ASC. Scale bars: 100 μm (g). ASC specks in the cells were quantified (h). n = 5. ik Primed MafB+/+ and MafB−/− PMs (i, k) and BMDMs (j) were stimulated with ATP or Nigericin for 1 h. The levels of cleaved Caspase 1 (p20), pro-Caspase 1, and cleaved Gasdermin D (p30) in the supernatants and cells were determined by western blotting. Mean ± SD; **P < 0.01, ***P < 0.001. Representative of three independent experiments.
Fig. 5
Fig. 5. MafB does not participate in the NLRP1, NLRC4, or AIM2 inflammasome activation.
a, b Primed MafB+/+ and MafB−/− PMs were stimulated with the mix of LipoJet liposome and the AIM2 activator poly(dA:dT) (2 µg/ml), the NLRC4 activator Flagellin (1 µg/ml), or the NLRP1 activator muramyl dipeptide (MDP) (10 µg/ml). Levels of supernatant IL-1β were determined by ELISA. Levels of the indicated proteins in the supernatants and cells were determined by western blotting. c Primed MafB+/+ and MafB−/− PMs were treated as in (a, b). Insoluble extracts were cross-linked and ASC oligomerization determined. ASC in the soluble extracts was used as loading controls. d, e Primed MafB+/+ and MafB−/− BMDMs were stimulated with poly(dA:dT) or Flagellin. Supernatant IL-1β was determined by ELISA and the indicated proteins in the supernatants and cells were determined by western blotting. Mean ± SD. Representative of three independent experiments.
Fig. 6
Fig. 6. MafB restricts the NLRP3 agonists induced mitochondrial damage.
a, b J774A.1 macrophages were transfected with control siRNAs or MafB siRNAs. 48 h later, cells were treated with or without 100 ng/ml LPS for 4 h, ATP (5 mM) or Nigericin (10 µM) for 30 min, and stained with 100 nM MitoTracker Deep Red and 100 nM MitoTracker Green for additional 20 min. Cells were collected, and flow cytometric analysis was performed to determine the mitochondria damage. c Primed J774A.1 macrophages transfected with control siRNAs or MafB siRNAs were incubated with 2.5 µM MitoSOX for 15 min, followed by stimulation with ATP or Nigericin for 30–60 min. Mitochondrial ROS (mtROS) was determined by fluorescence microplate reader under 530/590 nm (Ex/Em). d, e J774A.1 macrophages transfected with control siRNAs or MafB siRNAs were primed with LPS for 4 h, followed by stimulation with Nigericin for 30 min. The cells were permeabilized with 25 µg/ml Digitonin for 10–15 min and cytoplasmic DNAs were prepared. Levels of mtDNA were determined by real-time PCR assay. f, g J774A.1 macrophages transfected with control siRNAs or MafB siRNAs were treated with LPS for 4 h, followed by MitoTempo (100 µg/ml) treatment for 30 min. The cells were stimulated with Nigericin for 60 min. Supernatant IL-1β was determined by ELISA (f), and levels of the indicated proteins in the supernatants and cells were determined by western blotting (g). Vertically stacked bands originate either from a single membrane or from a replicate membrane, with the same sample loadings. Mean ± SD; **P < 0.01, ***P < 0.001. Representative of three independent experiments. ns not significant.
Fig. 7
Fig. 7. MafB sustains p62 expression in macrophages.
a J774A.1 macrophages were transfected with 50 nM control siRNAs or MafB siRNAs. 48 h after transfection, cells were collected, and protein levels of the indicated genes were determined by western blotting. b Levels of the indicated proteins in control siRNAs or MafB siRNAs transfected macrophages treated with LPS for 4 h, followed by Nigericin stimulation. c Experiment was done as in (a) and levels of SQSTM1 (p62) transcription was determined by real-time PCR. d, e Levels of the indicated proteins in control siRNAs or p62 siRNAs transfected macrophages treated with or without LPS for 4 h (d) and the levels of supernatant TNF-α and IL-6 (e). f, g Levels of supernatant IL-1β (f) and the indicated proteins (g) in control siRNAs or p62 siRNAs transfected macrophages treated with LPS for 4 h, followed by Nigericin or ATP stimulation. Mean ± SD; ***P < 0.001. Representative of three independent experiments.
Fig. 8
Fig. 8. MafB upregulation diminishes the NLRP3 inflammasome activation.
a, b PMs were pre-treated with vehicle or the RXR activator LG100268 (LG268) (1 µM) for 1 day, followed by LPS treatment for 3 h. The cells were then treated with or without ATP (5 mM) or Nigericin (5 µM), or transfected with poly(dA:dT) or Flagellin. Levels of the indicated protein in supernatants and cell extracts was determined by western blotting (a). Levels of supernatant TNF-α and IL-6 were determined by ELISA (b). Vertically stacked bands originate either from a single membrane or from a replicate membrane, with the same sample loadings. c MafB+/+ and MafB−/− PMs were pre-treated with LG268, followed by LPS priming and ATP activation. ELISA for IL-1β was performed. d MafB+/+ PMs were treated with various concentrations of LG268 for 1 day. Western blotting was performed for the indicated proteins. e Levels of the indicated proteins in control siRNAs or MafB siRNAs transfected PMs treated with or without LG268 for 1 day. f MafB+/+ and MafB−/− PMs were treated with or without LG268 for 1 day. g PMs were pre-treated with vehicle or the RXR activator LG268 for 1 day, followed by LPS treatment for 4 h. The cells were then stimulated with ATP for 30 min, and stained with 100 nM MitoTracker Deep Red and 100 nM MitoTracker Green for additional 20 min. Cells were collected, and flow cytometric analysis was performed to determine the mitochondria damage. h Primed PMs were incubated with MitoSOX for 15 min, followed by ATP stimulation. mtROS levels were determined. Mean ± SD; **P < 0.01, ***P < 0.001. Representative of three independent experiments.
Fig. 9
Fig. 9. Mye MafB −/− mice demonstrate elevated LPS and P. aeruginosa induced systemic and pulmonary IL-1β production and deficient lung P. aeruginosa clearance in vivo.
ac Ten-week MafB fl/fl and Mye MafB−/− mice were injected i.p. saline or LPS (10 mg/kg). Three hours after injection, mice were sacrificed and sera and lung extracts prepared. Levels of the indicated cytokines were determined by ELISA (a, b). Levels of the indicated protein in the lung extracts were determined by western blotting (c). df Ten-week MafB fl/fl and Mye MafB−/− mice were i.t. instilled with 0.6 × 107 PAK. 24 h after infection, lung extracts were prepared and levels of the indicated cytokines were determined by ELISA (d); BAL protein levels were measured (e); and lung extracts were diluted and plated. Bacterial colonies were counted to determine CFU (f). g MafB+/+ and MafB−/− BMDMs in 96-well plates were incubated with 2 × 106 PAK for 1 h. The cells were lysed in 100 µl sterile H2O for 20 min and combined with supernatants for serial dilution and plating. Bacterial colonies were counted to determine CFU. n = 3–8; mean ± SD or SE; *P < 0.05, **P < 0.01, ***P < 0.001. PAK  P. aeruginosa strain K, CFU colony-forming unit.

References

    1. Broz P, Dixit VM. Inflammasomes: mechanism of assembly, regulation and signalling. Nat. Rev. Immunol. 2016;16:407–420. - PubMed
    1. Latz E, Xiao TS, Stutz A. Activation and regulation of the inflammasomes. Nat. Rev. Immunol. 2013;13:397–411. - PMC - PubMed
    1. Swanson KV, Deng M, Ting JP. The NLRP3 inflammasome: molecular activation and regulation to therapeutics. Nat. Rev. Immunol. 2019;19:477–489. - PMC - PubMed
    1. Afonina IS, Zhong Z, Karin M, Beyaert R. Limiting inflammation-the negative regulation of NF-kappaB and the NLRP3 inflammasome. Nat. Immunol. 2017;18:861–869. - PubMed
    1. Rathinam VA, Vanaja SK, Fitzgerald KA. Regulation of inflammasome signaling. Nat. Immunol. 2012;13:333–342. - PMC - PubMed

Publication types

MeSH terms

Substances

LinkOut - more resources