Meta-Analysis
. 2023 Nov;55(11):1831-1842.
doi: 10.1038/s41588-023-01510-y. Epub 2023 Oct 16.

Genome-wide association meta-analysis identifies risk loci for abdominal aortic aneurysm and highlights PCSK9 as a therapeutic target

Tanmoy Roychowdhury #  1   2 Derek Klarin #  3   4 Michael G Levin #  5 Joshua M Spin  4   6   7 Yae Hyun Rhee  4   6   7 Alicia Deng  4   6   7 Colwyn A Headley  4   6   7 Noah L Tsao  8 Corry Gellatly  9 Verena Zuber  10   11   12 Fred Shen  13 Whitney E Hornsby  14 Ina Holst Laursen  15 Shefali S Verma  16 Adam E Locke  17 Gudmundur Einarsson  18 Gudmar Thorleifsson  18 Sarah E Graham  14 Ozan Dikilitas  19   20   21 Jack W Pattee  22 Renae L Judy  8 Ferran Pauls-Verges  23 Jonas B Nielsen  14   24 Brooke N Wolford  25   26 Ben M Brumpton  24   26   27 Jaume Dilmé  28 Olga Peypoch  23   28 Laura Calsina Juscafresa  29 Todd L Edwards  30 Dadong Li  17 Karina Banasik  31 Søren Brunak  31 Rikke L Jacobsen  15 Minerva T Garcia-Barrio  14 Jifeng Zhang  14 Lars M Rasmussen  32 Regent Lee  33 Ashok Handa  33 Anders Wanhainen  34   35 Kevin Mani  34 Jes S Lindholt  36 Lasse M Obel  36 Ewa Strauss  37   38 Grzegorz Oszkinis  38   39 Christopher P Nelson  9 Katie L Saxby  9 Joost A van Herwaarden  40 Sander W van der Laan  41 Jessica van Setten  42 Mercedes Camacho  23 Frank M Davis  43   44 Rachael Wasikowski  45 Lam C Tsoi  45 Johann E Gudjonsson  45 Jonathan L Eliason  46 Dawn M Coleman  46 Peter K Henke  46 Santhi K Ganesh  14   47 Y Eugene Chen  14 Weihua Guan  48 James S Pankow  49 Nathan Pankratz  50 Ole B Pedersen  51   52 Christian Erikstrup  53 Weihong Tang  49 Kristian Hveem  24   26   54 Daniel Gudbjartsson  18   55 Solveig Gretarsdottir  18 Unnur Thorsteinsdottir  18   56 Hilma Holm  18 Kari Stefansson  18   56 Manuel A Ferreira  17 Aris Baras  17 Iftikhar J Kullo  20 Marylyn D Ritchie  57 Alex H Christensen  52   58   59 Kasper K Iversen  52   59 Nikolaj Eldrup  52   60 Henrik Sillesen  52 Sisse R Ostrowski  15   52 Henning Bundgaard  52   58 Henrik Ullum  61 Stephen Burgess  62   63 Dipender Gill  10   64 Katherine Gallagher  43   44 Maria Sabater-Lleal  23   65 DiscovEHRRegeneron Genetics CenterUK Aneurysm Growth StudyDBDS Genomic ConsortiumVA Million Veteran ProgramIda Surakka  14 Gregory T Jones  66 Matthew J Bown  9 Philip S Tsao  4   6   7 Cristen J Willer  67   68   69 Scott M Damrauer  70   71   72
Collaborators, Affiliations
Meta-Analysis

Genome-wide association meta-analysis identifies risk loci for abdominal aortic aneurysm and highlights PCSK9 as a therapeutic target

Tanmoy Roychowdhury et al. Nat Genet. 2023 Nov.

Abstract

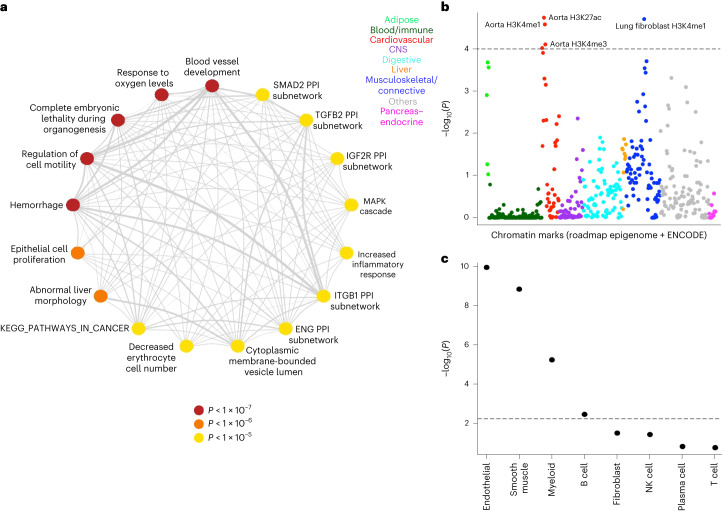
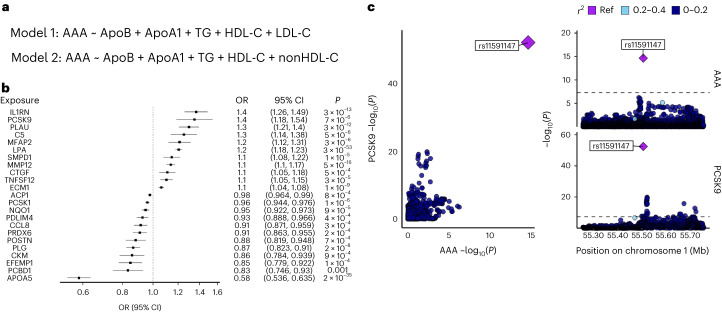
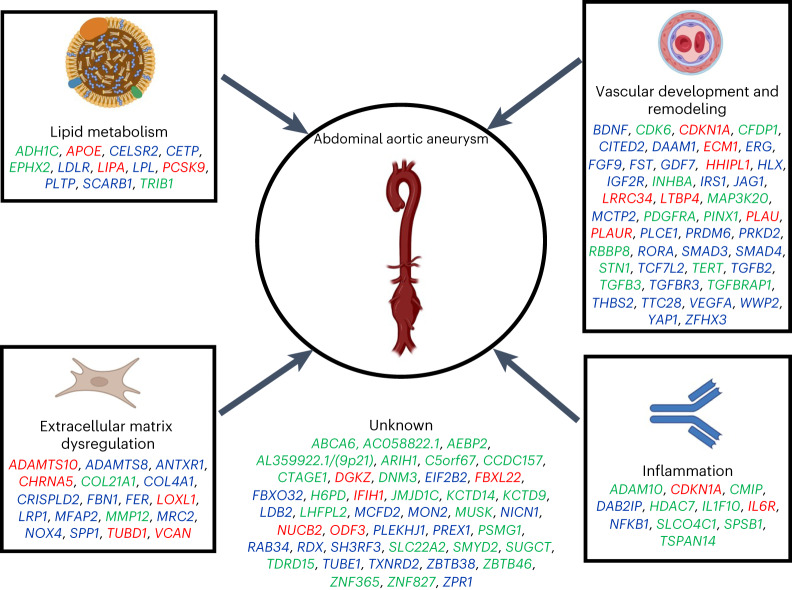
Abdominal aortic aneurysm (AAA) is a common disease with substantial heritability. In this study, we performed a genome-wide association meta-analysis from 14 discovery cohorts and uncovered 141 independent associations, including 97 previously unreported loci. A polygenic risk score derived from meta-analysis explained AAA risk beyond clinical risk factors. Genes at AAA risk loci indicate involvement of lipid metabolism, vascular development and remodeling, extracellular matrix dysregulation and inflammation as key mechanisms in AAA pathogenesis. These genes also indicate overlap between the development of AAA and other monogenic aortopathies, particularly via transforming growth factor β signaling. Motivated by the strong evidence for the role of lipid metabolism in AAA, we used Mendelian randomization to establish the central role of nonhigh-density lipoprotein cholesterol in AAA and identified the opportunity for repurposing of proprotein convertase, subtilisin/kexin-type 9 (PCSK9) inhibitors. This was supported by a study demonstrating that PCSK9 loss of function prevented the development of AAA in a preclinical mouse model.


Conflict of interest statement

A.E.L. is an employee of Regeneron Genetics Center and a shareholder of Regeneron Pharmaceuticals. A.B. is an employee of Regeneron Genetics Center and a shareholder of Regeneron Pharmaceuticals. C.J.W. is currently employed by Regeneron Pharmaceuticals, but scientific input to this manuscript occurred prior to employment at Regeneron Pharmaceuticals. D.K. is a scientific advisor and reports consulting fees from Bitterroot Bio, Inc unrelated to the present work. D.L. is an employee of Regeneron Genetics Center and a shareholder of Regeneron Pharmaceuticals. D.G. is employed part-time by Novo Nordisk. J.B.N. is employed by Regeneron Pharmaceuticals, unrelated to this work. J.A.v.H. is a consultant and/or proctor for Terumo Aortic, Cook Medical, Microport, WL Gore and Philips. M.A.F. is an employee of Regeneron Genetics Center and a shareholder of Regeneron Pharmaceuticals. M.R. is a member of the Scientific Advisory Board for Cipherome. S.E.G. is currently employed by Regeneron Pharmaceuticals. S.M.D. receives research support to the University of Pennsylvania from RenalytixAI and Novo Nordisk and personal consulting fees from Calico Labs, all outside the scope of the current research. S.B. has ownerships in Intomics A/S, Hoba Therapeutics Aps, Novo Nordisk A/S, Lundbeck A/S, ALK-Abello A/S and managing board memberships in Proscion A/S and Intomics A/S. The remaining authors declare no competing interests.

Figures

Fig. 1
Fig. 1. GWAS meta-analysis and PRS of AAA.
a, Flowchart of GWAS meta-analysis. The initial analysis generated 126 genome-wide significant loci but five were excluded based on sensitivity analysis and QC. b, MAF is plotted against effect estimates (39,221 AAA cases and 1,086,107 controls) for genome-wide significant index variants. The robust increase in sample size compared to previous studies allowed for the identification of new disease-associated variants with smaller effect estimates. Two dashed lines represent MAF = 0.01 and 0.05. c, Performance of PRS constructed based on the current meta-analysis (AAAgen) was compared with the one in ref. , the largest previously published GWAS of AAA. We observed improved prediction by AUC in all validation datasets. d, C-index of Cox models (10-year risk) with 95% CI in UKBB (838 incident AAA cases and 329,983 controls). The baseline model includes age, age2 and sex. The dashed line is at the C-index value from the baseline model. All subsequent models with clinical measurements and PRS incorporate the baseline variables.
Fig. 2
Fig. 2. Enrichment analysis.
a, Gene-set enrichment analysis by DEPICT. Nodes represent the representative gene sets from DEPICT (colored by P value). Thickness of the edges represents the overlap between gene sets. b, P values for enrichment of per-SNP heritability calculated by LDSC using tissue-specific chromatin marks. Different colors were used to classify tissues from broad categories. The dashed line represents the significance threshold after correcting for multiple testings. c, P values for estimation of the nonzero regression coefficient for each cell type calculated by RolyPoly using single-cell RNA of the aorta. The dashed line represents the significance threshold after correcting for multiple testing. NK, natural killer.
Fig. 3
Fig. 3. Gene prioritization.
a, Flowchart for the gene-prioritization pipeline. The primary goal of this pipeline was to identify a single gene for each of the 121 genome-wide significant loci. Evidence of eight indicators was collected in two stages so that each prioritized gene was supported by at least one indicator from stage 1. At stage 1, we used five indicators to collect evidence for all genes within 1 Mb of index variants. This procedure identified 523 candidate genes with evidence of at least one indicator. At stage 2, evidence of three additional indicators was collected for these 523 genes. Finally, at stage 3, the above eight indicators were combined in three steps in order of precedence to identify a single prioritized gene for 121 loci. b, Support of various gene prioritization indicators for 84 loci where a putative causal gene could be prioritized by protein-altering variants or by consensus. Rows (gene names) represent these loci and columns represent eight supporting indicators used for the prioritization. Black dots at the row/column intersection indicate support by a particular indicator for a particular gene.
Fig. 4
Fig. 4. Direction of gene-expression changes.
a, Aortic tissue-based TWAS z scores plotted against genomic coordinates of genes. The dashed line represents the associated z score for the significance threshold after multiple testing corrections. A positive or negative z score indicates the association of, respectively, higher or lower gene expression with AAA. Triangle/square(s) represent genes that were also differentially expressed in the mouse model of AAA. Upward/downward triangles represent genes that were observed to have high and low expression, respectively, in the mouse model. Squares represent genes where both directions were observed. Eleven prioritized genes (Results) are highlighted with text. Two colors represent odd and even number chromosomes sequentially (chromosomes 1–22). b, Results of qPCR in 11 prioritized genes (nAAA = 97; ncontrol = 36). An asterisk indicates five genes with a significant (Mann–Whitney rank-sum test; two-sided P values < 0.05/11 after adjusting for multiple comparisons) difference in expression level between cases and controls. The boxplot is the IQR range, defined by the 25th (lower edge) and the 75th (upper edge) percentiles, with the middle bar representing the median. Whiskers define the 10th and 90th percentiles. IQR, interquartile range.
Fig. 5
Fig. 5. Pleiotropy.
a, PheWAS network diagram representing seven modules (indicated by circles). b, Hierarchical clustering of scaled, normalized effects (β/s.e.) in established risk factor traits for 52 index variants (Results). Alleles in risk factor traits were aligned with the AAA-increasing allele. Index variants (rows) are named by the prioritized genes. PP, pulse pressure; DBP, diastolic blood pressure; SBP, systolic blood pressure.
Fig. 6
Fig. 6. Causal inference methods for the evaluation of AAA risk.
a, In the MR-BMA analysis to prioritize likely causal lipoprotein fractions, two separate models were used for analysis given the strong correlation between non-HDL-C and LDL-C. All other lipid fractions were included in both models. b, A proteome-wide MR analysis using high-confidence cis-acting genomic instruments for circulating plasma proteins identified 23 putative causal protein–AAA associations at two-sided Benjamini–Hochberg FDR < 0.05. ORs are depicted per unit change in protein level (1 s.d.). Genetic instruments were constructed from GWAS of circulating proteins among up to 35,559 individuals. c, LocusCompare plot of circulating PCSK9 protein pQTL results and AAA GWAS results demonstrating evidence of colocalization. TG, triglyceride lipoprotein.
Fig. 7
Fig. 7. Loss of Pcsk9 inhibits growth of experimental AAA in mouse models.
PPE surgery was performed on day 0 and maximal aortic diameter was monitored by B-mode ultrasound. Knockout of Pcsk9 resulted in blunted AAA growth starting at experimental day 7 (PPE ctrl group n = 6; Pcsk9−/− group n = 6). Graphs show aortic aneurysm diameter percentage increase versus baseline (means ± s.e.m.). Two-sided P values from the Mann–Whitney test were reported.
Fig. 8
Fig. 8. Biological mechanisms underlying genetic loci associated with AAA.
The AAA GWAS loci for which we have identified a candidate causal gene are depicted along with the plausible relationship to its underlying biological mechanism. Loci names are based on the candidate causal gene identified in our analysis. However, the biological pathway(s) remain unclear for many associated loci and, as such, the resultant annotation may prove incorrect in some cases. Gene names are colored according to the gene prioritization scheme used to obtain the candidate (red, protein-altering variants; blue, consensus of indicators and green, nearest gene).

References

    1. Stuntz M. Modeling the burden of abdominal aortic aneurysm in the USA in 2013. Cardiology. 2016;135:127–131. doi: 10.1159/000446871. - DOI - PubMed
    1. Summers KL, Kerut EK, Sheahan CM, Sheahan MG., 3rd Evaluating the prevalence of abdominal aortic aneurysms in the United States through a national screening database. J. Vasc. Surg. 2021;73:61–68. doi: 10.1016/j.jvs.2020.03.046. - DOI - PubMed
    1. O’Donnell TFX, Schermerhorn ML. Abdominal aortic aneurysm screening guidelines: United States Preventative Services Task Force and Society for Vascular Surgery. J. Vasc. Surg. 2020;71:1457–1458. doi: 10.1016/j.jvs.2020.01.054. - DOI - PubMed
    1. Lo RC, Schermerhorn ML. Abdominal aortic aneurysms in women. J. Vasc. Surg. 2016;63:839–844. doi: 10.1016/j.jvs.2015.10.087. - DOI - PMC - PubMed
    1. Pleumeekers HJ, et al. Aneurysms of the abdominal aorta in older adults. The Rotterdam Study. Am. J. Epidemiol. 1995;142:1291–1299. doi: 10.1093/oxfordjournals.aje.a117596. - DOI - PubMed

Publication types

LinkOut - more resources