. 2023 Nov;55(11):1987-1997.
doi: 10.1038/s41588-023-01530-8. Epub 2023 Oct 16.

Regulatory controls of duplicated gene expression during fiber development in allotetraploid cotton

Affiliations

Regulatory controls of duplicated gene expression during fiber development in allotetraploid cotton

Jiaqi You et al. Nat Genet. 2023 Nov.

Abstract

Polyploidy complicates transcriptional regulation and increases phenotypic diversity in organisms. The dynamics of genetic regulation of gene expression between coresident subgenomes in polyploids remains to be understood. Here we document the genetic regulation of fiber development in allotetraploid cotton Gossypium hirsutum by sequencing 376 genomes and 2,215 time-series transcriptomes. We characterize 1,258 genes comprising 36 genetic modules that control staged fiber development and uncover genetic components governing their partitioned expression relative to subgenomic duplicated genes (homoeologs). Only about 30% of fiber quality-related homoeologs show phenotypically favorable allele aggregation in cultivars, highlighting the potential for subgenome additivity in fiber improvement. We envision a genome-enabled breeding strategy, with particular attention to 48 favorable alleles related to fiber phenotypes that have been subjected to purifying selection during domestication. Our work delineates the dynamics of gene regulation during fiber development and highlights the potential of subgenomic coordination underpinning phenotypes in polyploid plants.


Conflict of interest statement

The authors declare no competing interests.

Figures

Fig. 1
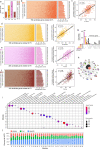
Fig. 1. Gene expression atlas and genetic regulation during fiber development.
a, Samples used for RNA-seq in fiber development. The samples include ovules at 0 DPA and fibers at 4 DPA, 8 DPA, 12 DPA, 16 DPA and 20 DPA. The sample number of each stage is shown in parentheses. b, Principal component analysis (PCA) plots of the first two components for 2,215 RNA-seq samples. c, The number of genes expressed (dark gray outside line) or not expressed (lighter gray outside line) in all RNA-seq samples. d, The number of expressed homoeologous genes in each timepoint. Red, homoeologous genes with expression bias toward the At (BiasA); blue, homoeologous genes with expression bias toward the Dt (BiasD); gray, homoeologous genes without expression bias (BiasN); purple, homoeologous genes with expression bias toward the At and Dt (bidirect bias). e, The number of eQTLs and distribution of eGenes that had cis-eQTL, trans-eQTL or both. At, the At subgenome; Dt, the Dt subgenome; Sca, genes in unanchored scaffolds.
Fig. 2
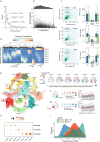
Fig. 2. Fine-mapping of fiber quality associations.
a, Manhattan plot of the genome-wide association study (top panel) and transcriptome-wide association study (bottom panel) for fiber quality. Significant QTLs are labeled. Significance thresholds of P = 3.76 × 10−7 (one-sided F test) and FDR = 0.05 (P value of two-sided Student’s t test corrected by FDR) were used, respectively. b, Phenotypic effects (TWAS z score or correlation between expression and phenotype) of FL/FS-related candidate genes. Strategies are shown at the left, with illustrative color ranges. Positive z scores or correlations are shown in orange and negative values in purple. Significant genes are marked with ‘check mark.’ c, Regional association plots for FL (top row) and eQTLs for gene Ghir_D05G007220 (BB2) at 12 DPA and 20 DPA. Chromosomal location and gene position were labeled at the bottom. The lead SNPs are highlighted with a purple diamond. Boxplots on the right panel show fiber length and BB2 expression for accessions with different genotypes (n = 154 versus 215; two-sided Wilcoxon rank-sum test; centerline, median; box limits, first and third quartiles; whisker, 1.5× interquartile range). d, Expression profiles of Ghir_D05G007220 (BB2) in 340 accessions were divided into eight expression groups. The figure shows the four larger expression groups. Heatmaps showing normalized FPKM in each accession at each timepoint. Line charts showing the mean expression of accessions at each timepoint. The arrow points to the timepoint with the highest mean expression. e, Boxplot for fiber length of accessions with different expression patterns (n = 16 versus 88 versus 108 versus 109; two-sided Student’s t test; centerline, median; box limits, first and third quartiles; whisker, 1.5× interquartile range). f,g, Dot plot for the genetic effect of variants associated with FL/FS-related candidate genes. X axis indicates the variants sorted by genetic effect. Y axis indicates the genetic effect of variants. The representative variants and regulated genes are labeled. h, The heritability accumulation accompanying the increase of genetic variants. i, The heritability is explained by only GWAS loci and both GWAS loci and eQTLs.
Fig. 3
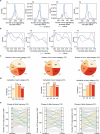
Fig. 3. eQTL hotspots and genetic network of genes associated with fiber quality.
a, Line chart showing the number of genes regulated by eQTL hotspots at each timepoint. Red point, the total number of regulated genes across five timepoints. b, Bubble plot showing the variable number of genes regulated by nine hotspots in fiber development. Point size, the scaled number of regulated genes in each timepoint; line size, the scaled number of genes that were coregulated between adjacent timepoints. c, Genetic network of fiber-related genes. The node color represents the module to which it belongs. Hexagon node, eQTL hotspot; circular, candidate genes; square, eQTL. The edge is used to connect hotspots/eQTLs with genes. Line plot, distribution of node in-degree values (one-sided F test). d, The counts of genes, eQTLs and hotspots (top) in 36 modules and module heritability of four fiber quality-related traits (bottom). e, Analysis of dynamic interpretation (normalized r2) of fiber length in eight modules at five timepoints. The expression patterns of four representative genes are shown with line plots. f, A total of 129 loci with higher favorable allele frequency (>0.2) in the accessions with the longest fiber (n = 50) compared with the accessions with the shortest fiber (n = 50). Centerline, median; box limits, first and third quartiles; whisker, 1.5× interquartile range. g, Module enrichment analysis of the 129 loci in f (one-sided Fisher’s exact test).
Fig. 4
Fig. 4. Genetic regulation of homoeologous expression bias.
a, The circular diagram shows the proportion of homoeologous gene pairs that were characterized as eGenes and non-eGenes. The inner circle shows homoeologous pairs with expression bias, and the outer circle indicates gene pairs without expression bias. b, The number of TWAS genes present in the bias–eQTL gene pairs. Boxplots on the right panel show fiber length and homoeologous expression bias level at 20 DPA for the two haplotypes (n = 85 versus 280; two-sided Wilcoxon rank-sum test; centerline, median; box limits, first and third quartiles; whisker, 1.5× interquartile range). c, The heatmap on the left shows switched, time-dependent and dominant bias patterns for 2,658 gene pairs across stages. The heatmap on the right indicates the correlation (Spearman coefficient) of the eQTL effect for 2,658 gene pairs between stages. d, Histogram shows a significant difference (based on one-sided Fisher’s exact test) in the proportion of gene pairs showing dominant expression bias with shared eQTLs or without shared (nonshared) eQTLs. e, Histogram indicates a significant difference (based on one-sided Fisher’s exact test) in the proportion of gene pairs with switched expression bias in specific cis-eQTLs and trans-eQTLs.
Fig. 5
Fig. 5. Relationships between homoeologous expression and fiber quality.
a, A total of 133 homoeologous gene pairs positively regulate fiber length. Red, favorable homoeologous pairs (homoeologous gene pairs with both favorable genotype and favorable expression). Yellow, homoeologous gene pairs with only favorable genotype of the candidate gene. Light blue, homoeologous gene pairs with only favorable expression. Dark blue, unfavorable homoeologous pairs (homoeologous gene pairs without either favorable genotype or favorable expression). Heatmap shows the classification of 133 gene pairs in 340 accessions at five timepoints. b, A total of 106 homoeologous genes negatively regulate fiber length. The classification is the same as in a. c, Pie charts of the states of homoeologous genes in eight FL-related modules. The number of FL-related genes is shown in the parentheses for each module. d, Proportional distribution of four types of homoeologous genes in accessions that were sorted by FL from short to long. e, Comparison of bias score of gene pairs in samples with favorable and unfavorable alleles. The pie chart shows the ratio of gene pairs with different patterns of bias score change. The boxplots indicate gene pairs that show a significant difference in bias score. Centerline, median; box limits, first and third quartiles; whisker, 1.5× interquartile range. f,g, Correlation between the number of gene pairs with biased expression, the number of favorable loci and fiber length. Panel f shows the accumulation in a single accession of 155 gene pairs that show a decrease in bias score in e. Panel g shows the accumulation in a single accession of 153 gene pairs that show an increase in bias score in e. The gray band represents 95% confidence interval for the fitted regression.
Fig. 6
Fig. 6. Genomic design for fiber quality improvement.
a, Phylogenetic tree and genotypes of fiber-related loci in 332 cotton landraces and 3,220 cultivars. b, Trait-associated loci were grouped into four categories according to their favorable allele frequency in the modern cultivar population. c, Number of loci in four categories with different sharing ratios of favorable allele for FL. d, Heritability of the SNPs in each of the four categories for FL. e, Comparison of favorable allele frequency in the four categories between landrace and cultivar population. The frequency difference above 0.6 was highlighted in green and yellow. f, Favorable allele frequency of loci that were highlighted in green color in e. g, Comparison of fiber traits (FL, FS and FE) and expression levels of Ghir_A01G013620 in accessions with different genotypes (CC and AA). Two-sided Wilcoxon rank-sum test. Centerline, median; box limits, first and third quartiles; whiskers, 1.5× interquartile range. h, Correlation between real FL values and FL breeding value (BV) estimates calculated by ridge regression. i, Model predictability tested by applying the training model in a to an external dataset (1,040 accessions) for FL. j, Distance of real FL (blue dots) and FL BV estimates (red dots) of the accessions to the estimated best value of FL. k, The number of FL-associated genes and the number of the homoeologous genes whose expression was correlated or not correlated with FL. l, Fivefold cross-validated prediction accuracy using ridge regression model based on two predictive sets. One contains genotype and the other contains both genotype and the expression of corresponding homoeologous genes. Hundred replications were run. Circle, mean; error bar, mean ± s.e. m, Genomic-guided donor parent selection. The heatmap (left) shows the level of genetic improvement. Each row represents the accession to be improved and each column represents the donor. Right, the utilization level of FL/FS-associated loci in the eight genetic modules or the homoeologous genes corresponding to these loci of S161 and S003. The loci or the homoeologous genes of S161 that could be improved by S003 were listed at the bottom.
Extended Data Fig. 1
Extended Data Fig. 1. Gene expression atlas in fiber development.
a, Proportion of gene expression variance explained by differences among accessions. Orange band represents 95% confidence interval for the fitted regression. b, Proportion of gene expression variance explained by differences among developmental timepoints. Blue band represents 95% confidence interval for the fitted regression. c, Heatmaps of gene expression in all accessions in ovules (0 DPA) and fibers (4 DPA, 8 DPA, 12 DPA, 16 DPA, 20 DPA). Genes were sorted by proportion of accessions with observed expression. d, Venn diagram showing the number of genes expressed in one to six timepoints. e, The number of expressed homoeologous gene pairs. f, The number of expressed homoeologous gene pairs with steady expression bias. Brown, expression bias towards the At (BiasA); blue, expression bias towards the Dt (BiasD); gray, without expression bias (BiasN).
Extended Data Fig. 2
Extended Data Fig. 2. Characterization of eQTLs across stages.
a, Compared with specific eQTLs, shared eQTLs have markedly higher effects (P < 2.2 × 10⁻¹⁶, two-sided Wilcoxon rank sum test). b, Genes with stage-shared eQTL were linked to the number of shared stages. The pie diagram indicates the proportion of gene pairs that had different types of eQTLs. c, Distribution of the number of stages in which cis-eQTLs were shared by significance (up) or magnitude (down). cis-eQTL magnitude was defined to be shared when the effect estimate outputted by mash was within 2 folds. cis-eQTL was defined significant with a mash local false sign rate (LFSR < 0.05). d, Comparison of effect sizes of stage-shared eQTLs between stages. The effect size was estimated by mash.
Extended Data Fig. 3
Extended Data Fig. 3. Candidate genes identified by TWAS and colocalization analysis.
a, Exon-intron structure and mutant sites of Ghir_D10G004160. GhMYB-CR1 and GhMYB-CR2 represent two different mutant types. The red shadow represents insertions; blue shadow represents deletions. WT, wild type. b, Comparison of fiber length in two years (2020 and 2021) between WT and mutants (GhMYB-CR1 and GhMYB-CR2) (n = 3 in each year; two-sided Student’s t-test; error bar, mean ± SD). c, Phenotypic effects (TWAS z-score or correlation between expression and phenotype) of FE/FU-related candidate genes. Strategies are shown at the left, with illustrative color ranges. Positive z-score or correlation are shown in orange and negative values in purple. Significant betas are marked with ‘check mark.’ d, Expression patterns of 1,258 candidate genes in 340 accessions were divided into 12 groups. Heatmap showing normalized FPKM in each accession at each timepoint. Line charts showing mean values of accessions at each timepoint.
Extended Data Fig. 4
Extended Data Fig. 4. Correlations of expression pattern with fiber quality and characterization of eQTL hotspots and genetic modules.
a, The counts of candidate genes with/without favorable expression patterns for four fiber quality-related traits. b, Heatmap showing FL-related genes with (lighter orange) or without (dark orange) favorable expression patterns in 340 cotton accessions. The 340 accessions are sorted by fiber length. Bar plot indicates mean counts of adjacent accessions. c, Correlation (cor) of fiber length (mm) and the cumulative number of genes with favorable expression patterns. Two-sided Student’s t-test. The gray band represent 95% confldence interval for the fitted regression. df, Heatmap showing FS/FE/FU-related genes with (lighter color) or without (dark color) favorable expression pattern in 340 accessions. Cotton accessions are sorted by values of FS/FE/FU. The right panel shows correlation between values of FS/FE/FU and cumulative number of genes with favorable expression pattern. Two-sided Student’s t-test. The gray band represent 95% confldence interval for the fitted regression. g, Venn diagram showing the number of genes identified for four fiber quality traits. h, Graph diagram showing eQTL-eGene connections within and between modules. Each module is represented as a circle with size proportional to the number of nodes. i, Gene ontology enrichment (biological process) of candidate genes from 15 modules (one-sided Fisher’s exact test). j, Stack bar plot of eQTL distribution in 36 modules.
Extended Data Fig. 5
Extended Data Fig. 5. Characterization of homoeologous expression bias and its dynamics across stages.
a, Comparison of the coefficient of variation for bias score in different expression bias patterns. ‘non-QTL’ indicates gene pairs without significant eQTL and bias-eQTL. ‘Bias/eQTL’ shows gene pairs with one eQTL or bias-eQTL. ‘Bias&eQTL’ indicates gene pairs with both eQTL and bias-eQTL. b, Genetic variance partitioning for a gene pair using intra- and inter-subgenomic SNPs (within 1 Mb up- or downstream of TSS). c, Density map showing the coefficient of variation (CV) of gene expression for gene pairs with different genetic regulatory patterns. The boxplot shows the count of SNPs in gene body and flanking regions (1 kb up- and downstream) (two-sided Wilcoxon rank sum test; center line, median; box limits, first and third quartiles; whisker, 1.5×interquartile range). d, Distribution of the number of accessions belonging to each dynamic bias pattern. Rows contain 8 categories of dynamic bias patterns (Methods) and columns are gene pairs with bias-eQTL. e, The dynamics of homoeologous gene expression patterns was shown in a co-expression network. Nodes were colored for 16 co-expression clusters (left panel). The co-expression network was colored for expression bias (colored by average relative bias ratio; right panel). f, Dynamic expression bias and expression level (FPKM) of co-expression cluster 8 (n = 915 genes in different subgenomes at 6 timepoints; center line, median; box limits, first and third quartiles; whisker, 1.5× interquartile range). g, Dynamic expression bias and expression level (FPKM) of co-expression cluster 1 (n = 646 genes in different subgenomes at 6 timepoints; center line, median; box limits, first and third quartiles; whisker, 1.5× interquartile range). h, Enrichment of gene pairs with three bias patterns in co-expression clusters. The odd ratio and P-values for enrichment of clusters were calculated based on a one-sided Fisher’s exact test. i, Distribution of edge numbers in co-expression clusters that were enriched by switched, time-dependent, and dominant gene pairs.
Extended Data Fig. 6
Extended Data Fig. 6. Characterization of subgenomic coordination on FS, FE, and FU.
ad, FL/FS/FU/FE-associated SNPs and genotypes of pseudo-regulatory sites in the other subgenome. e, 246 homoeologous gene pairs and 258 pairs with positive and negative regulation on fiber strength (FS), respectively. Heatmap shows the classification of 246 positive and 258 negative gene pairs in 340 accessions at five timepoints. f, 127 homoeologous gene pairs and 111 pairs with positive and negative regulation on fiber uniformity (FU), respectively. g, 337 positive homoeologous gene pairs and 337 pairs with positive and negative regulation on fiber elongation rate (FE), respectively.
Extended Data Fig. 7
Extended Data Fig. 7. Relationships between homoeologous expression and three fiber quality-related traits.
a, Proportional distribution of four types of homoeologous genes in accessions that were sorted by fiber strength. The pie chart shows the ratio of gene pairs with different patterns of bias score change. The boxplots indicate gene pairs that show a significant difference in bias score (two-sided Wilcoxon rank sum test; center line, median; box limits, first and third quartiles; whisker, 1.5× interquartile range). The right panel shows correlation between the number of gene pairs with biased expression, the number of favorable loci, and fiber strength, the gray band represent 95% confldence interval for the fitted regression. b, Proportional distribution of four types of homoeologous genes in accessions that were sorted by FE. c, Proportional distribution of four types of homoeologous genes in accessions that were sorted by FU.
Extended Data Fig. 8
Extended Data Fig. 8. Characterization of regulatory variants in cultivar and landrace populations.
a, Distribution of the number of loci which aggregated favorable alleles in landrace and cultivar populations. b, Distribution of favorable allele frequency in landrace and cultivar populations. c, Number of variants in 4 categories with different sharing ratios of favorable allele for FS, FE and FU. d, Heritability of the variants in each of the 4 categories for FS, FE and FU. e, Comparison of the 4 categories between landrace and cultivar populations. The frequency differences above 0.6 were highlighted in yellow and green.
Extended Data Fig. 9
Extended Data Fig. 9. Predictive model and accuracy assessment for fiber-quality traits.
a, Correlation between the favorable allele number and fiber-quality traits. b, Correlation between the observed and predicted values for FL, FE and FU, respectively. Predictions were performed using ridge regression based on the inferred regulatory variants. c, Model predictability tested by applying the trained model in an external dataset (with 1,040 accessions) for FS. d, Fivefold cross-validated prediction accuracy using ridge regression model based on two predictive sets for 3 fiber quality-related traits (FS, FE and FU). One only contains genotype of trait-associated loci and the other contains both genotype and the expression of corresponding homoeologous gene copy. 100 replications were run. Circle, mean; error bar, mean ± SE.

References

    1. Olsen KM, Wendel JF. A bountiful harvest: genomic insights into crop domestication phenotypes. Annu. Rev. Plant Biol. 2013;64:47–70. doi: 10.1146/annurev-arplant-050312-120048. - DOI - PubMed
    1. Fang Z, Morrell PL. Domestication: polyploidy boosts domestication. Nat. Plants. 2016;2:16116. doi: 10.1038/nplants.2016.116. - DOI - PubMed
    1. Qi X, et al. Genes derived from ancient polyploidy have higher genetic diversity and are associated with domestication in Brassica rapa. New Phytol. 2021;230:372–386. doi: 10.1111/nph.17194. - DOI - PubMed
    1. Renny-Byfield S, Wendel JF. Doubling down on genomes: polyploidy and crop plants. Am. J. Bot. 2014;101:1711–1725. doi: 10.3732/ajb.1400119. - DOI - PubMed
    1. Salman-Minkov A, Sabath N, Mayrose I. Whole-genome duplication as a key factor in crop domestication. Nat. Plants. 2016;2:16115. doi: 10.1038/nplants.2016.115. - DOI - PubMed