. 2023 Dec;30(12):2462-2476.
doi: 10.1038/s41418-023-01223-z. Epub 2023 Oct 16.

CDK13 promotes lipid deposition and prostate cancer progression by stimulating NSUN5-mediated m5C modification of ACC1 mRNA

Affiliations

CDK13 promotes lipid deposition and prostate cancer progression by stimulating NSUN5-mediated m5C modification of ACC1 mRNA

Yong Zhang et al. Cell Death Differ. 2023 Dec.

Abstract

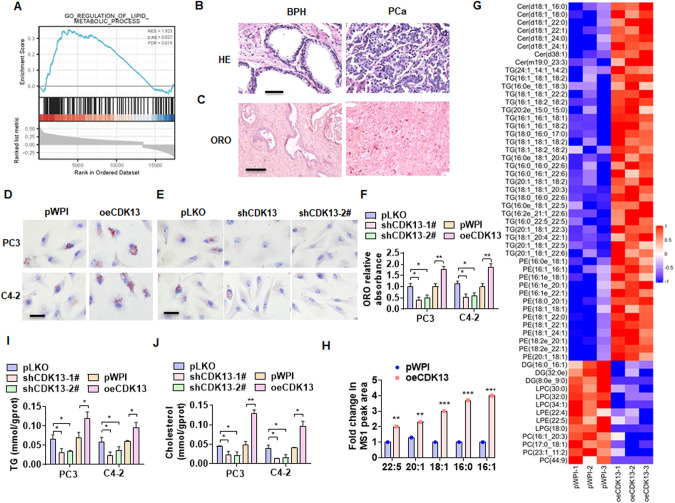
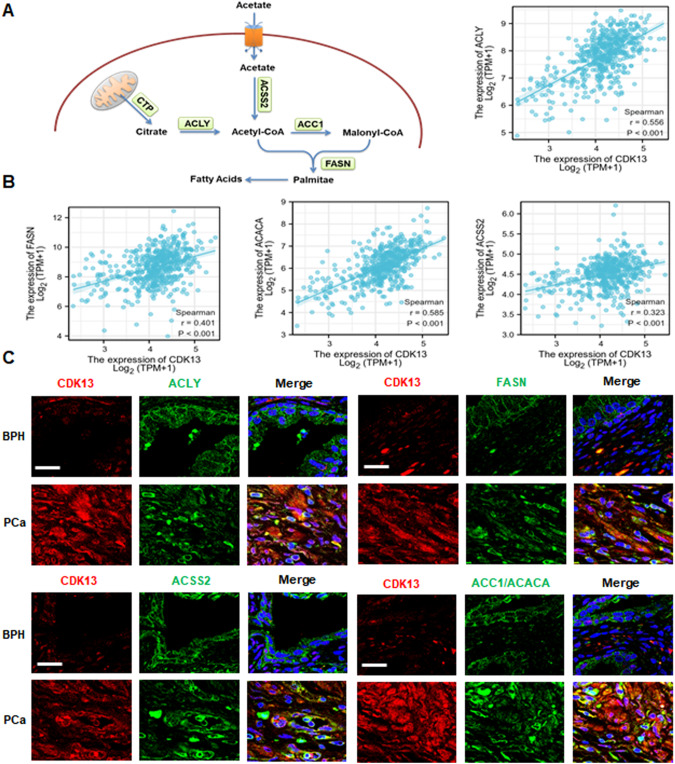
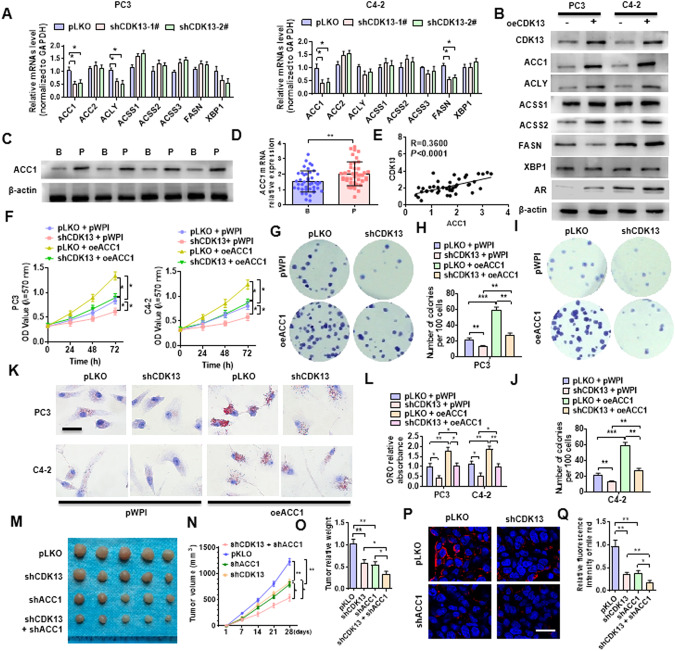
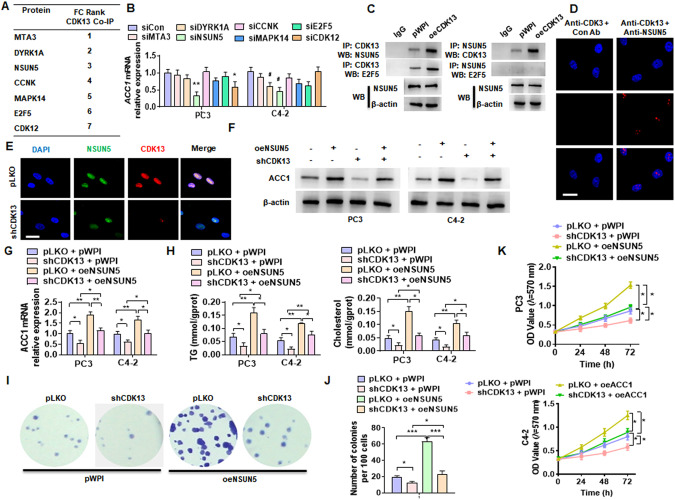
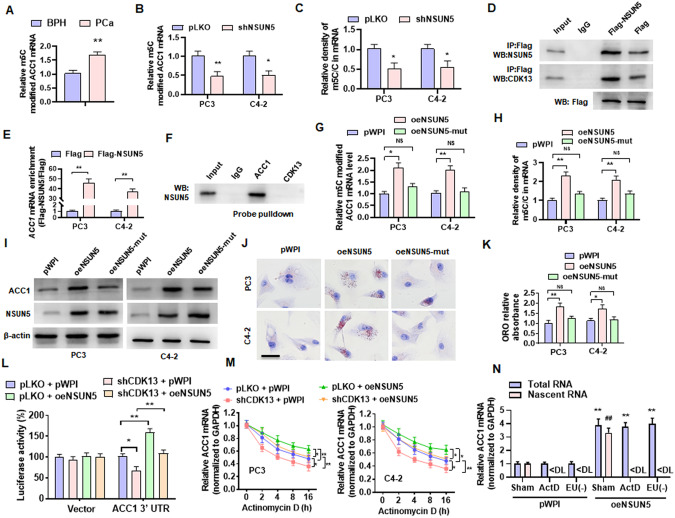
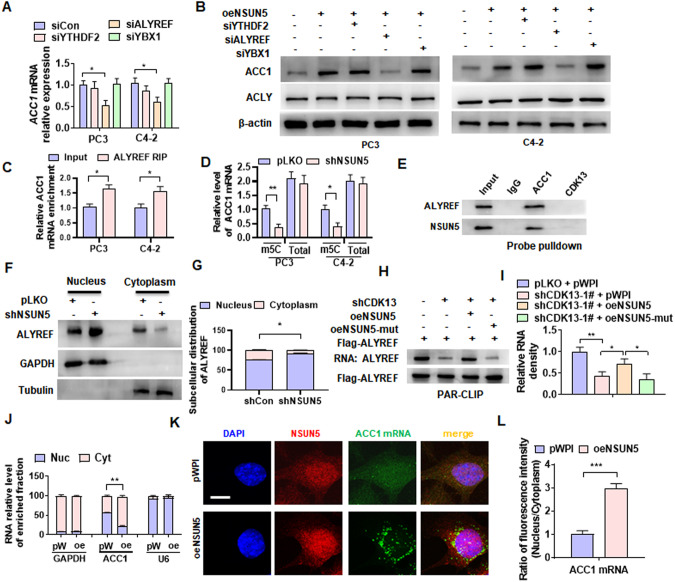
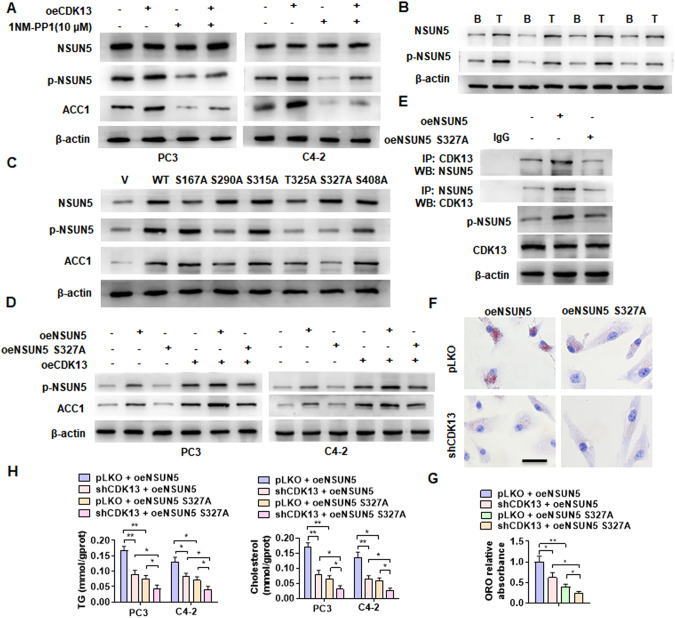
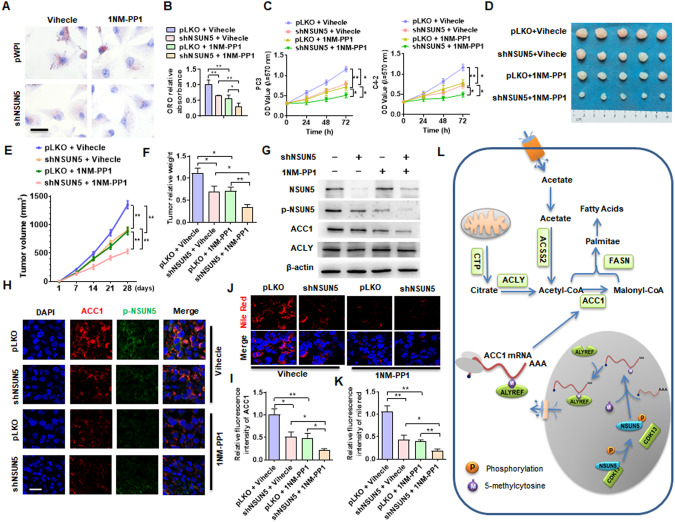
Cyclin-dependent kinases (CDKs) regulate cell cycle progression and the transcription of a number of genes, including lipid metabolism-related genes, and aberrant lipid metabolism is involved in prostate carcinogenesis. Previous studies have shown that CDK13 expression is upregulated and fatty acid synthesis is increased in prostate cancer (PCa). However, the molecular mechanisms linking CDK13 upregulation and aberrant lipid metabolism in PCa cells remain largely unknown. Here, we showed that upregulation of CDK13 in PCa cells increases the fatty acyl chains and lipid classes, leading to lipid deposition in the cells, which is positively correlated with the expression of acetyl-CoA carboxylase (ACC1), the first rate-limiting enzyme in fatty acid synthesis. Gain- and loss-of-function studies showed that ACC1 mediates CDK13-induced lipid accumulation and PCa progression by enhancing lipid synthesis. Mechanistically, CDK13 interacts with RNA-methyltransferase NSUN5 to promote its phosphorylation at Ser327. In turn, phosphorylated NSUN5 catalyzes the m5C modification of ACC1 mRNA, and then the m5C-modified ACC1 mRNA binds to ALYREF to enhance its stability and nuclear export, thereby contributing to an increase in ACC1 expression and lipid deposition in PCa cells. Overall, our results disclose a novel function of CDK13 in regulating the ACC1 expression and identify a previously unrecognized CDK13/NSUN5/ACC1 pathway that mediates fatty acid synthesis and lipid accumulation in PCa cells, and targeting this newly identified pathway may be a novel therapeutic option for the treatment of PCa.


Conflict of interest statement

The authors declare no competing interests.

Figures

Fig. 1
Fig. 1. CDK13 promotes fatty acid synthesis and lipid deposition in PCa cells.
A HE staining was used to detect the change of prostate histopathology in the BPH and PCa tissues. Scale bar = 50 μm. B Oil red O (ORO) staining detected lipid accumulation in the BPH and PCa tissues (n = 31). Scale bar = 100 μm. C GSEA was used to analyze lipid metabolic signaling pathways regulated by CDK13 in PCa. FDR < 0.019 and P = 0.027. D, E PC3 and C4-2 cells were transfected with CDK13-expressing vector (oeCDk13), 2 individual shRNAs targeting different regions of the CDK13 gene (shCDK13-1#, shCDK13-2#) or their corresponding control vectors, and then ORO staining was performed to detect lipid deposition in the cells. Scale bar = 20 μm. F Quantitative analysis of Oil Red O staining in (D) and (E). G Lipidomics analysis by LC/MS was performed to examine lipid components in PC3 cells with and without stable overexpression of CDK3 (n = 3). Heatmap showing lipid molecules with significant change, represented by red (upregulated) and green (downregulated). H A statistically significant increase in abundance of fatty acyl chains in CDK13-overexpressing cells. I, J TG and cholesterol contents were measured as quantitative indicators of lipid deposition in PC3 and C4-2 cells. All data are expressed as the mean ± SEM of 3 independent experiments. *P < 0.05, **P < 0.01, ***P < 0.001 vs. their corresponding controls.
Fig. 2
Fig. 2. CDK13 is positively correlated with the expression of key fatty acid synthesis genes.
A Schematic showing the intermediates in fatty acid synthesis and enzymes involved in this metabolic pathway. B Correlation analysis between CDK13 expression and key fatty acid synthesis genes, such as ACLY, ACSS2, ACC1, and FASN in PCa from TCGA. C Immunofluorescence staining detected the co-expression of CDK13 and fatty acid synthases ACLY, ACSS2, ACC1, and FASN in PCa and BPH tissues. Scale bar = 20 μm.
Fig. 3
Fig. 3. ACC1 mediates CDK13-induced lipid deposition and PCa progression.
A PC3 and C4-2 cells were transfected with shCDK13-1# or shCDK13-2# or control vector, and then RT-qPCR was used to detect the expression of the indicated fatty acid synthase genes. B PC3 and C4-2 cells were transfected with oeCDK13 or control vector, and then Western blotting examined the indicated fatty acid synthases. C, D Western blot and RT-qPCR were used to detect the ACC1 expression in BPH (B) and PCa (P) tissues. E Correlation analysis between CDK13 and ACC1 expression in PCa tissues. F PC3 and C4-2 cells were transfected with shCDK13 or oeACC1 or both, and MTS assay was used to examine cell viability. G–J PC3 and C4-2 cells were transfected as in (F), and clone formation assay was used to detect cellular proliferation. K, L Cells were transfected as in (F), and ORO staining detected the lipid accumulation in cells. Scale bar = 20 μm. M PC3 cells were engineered to stably silence CDK13 or ACC1, alone or together, and xenograft tumor models were established by implanting these engineered cells into nude mice. Tumor sizes of each group were displayed after 21 days. N Tumor volumes were measured with calipers and calculated by the formula: (length × width2)/2. O, Wet weight of xenograft tumors was determined after tumor resection. P Nile red staining was used to detect the lipid deposition in xenograft tumors. Red: lipids; Blue: nuclei. Scale bar = 25 μm. Q Quantitative analysis of Nile red staining in (P). All data are expressed as the mean ± SEM of 3 independent experiments. *P < 0.05, **P < 0.01, ***P < 0.001 vs. their corresponding controls.
Fig. 4
Fig. 4. CDK13 interacts with NSUN5 to promote ACC1 expression.
A The proteins interacting with CDK13 in PC3 cells identified by co-immunoprecipitation coupled with mass spectrometry (CoIP-MS). B The indicated seven genes were knocked down in PC3 and C4-2 cells by their corresponding siRNAs, and the RT-qPCR detected the ACC1 mRNA expression. C CoIP coupled with Western blot was performed to verify the interaction between CDK13 and NSUN5. D Proximity ligation assay (PLA) detected CDK13 and NSUN5 interaction by using the indicated antibodies. E PC3 cells were transfected with shCDK13 or control vector, and then double immunofluorescence staining was used to detect CDK13 and NSUN5 co-localization. F, G PC3 and C4-2 cells were transfected with oeNSUN5 or shCDK13 or both together, and then Western blot and RT-qPCR detected ACC1 and ACLY expression. H TG and cholesterol contents were measured as quantitative indicators of lipid accumulation in PC3 and C4-2 cells. K PC3 and C4-2 cells were transfected as in (F), and MTS assay detected cell viability. I, J Cells were transfected as in (F), and clone formation assay detected cell growth. All data are expressed as the mean ± SEM of 3 independent experiments. *P < 0.05, **P < 0.01, ***P < 0.001 vs. their corresponding controls.
Fig. 5
Fig. 5. NSUN5 promotes ACC1 expression and lipid deposition by regulating the m5C modification of ACC1 mRNA.
A Methylated RNA was immunoprecipitated by an m5C specific antibody (MeRIP), and then qPCR detected the level of m5C-modified ACC1 mRNA in the BPH and PCa tissues. B PC3 and C4-2 cells were transfected with shNSUN5 or control vector, and then MeRIP-qPCR examined m5C-modified ACC1 mRNA. C PC3 and C4-2 cells were ransfected as in (B) and then the UHPLC-MRM-MS/MS analysis detected the m5C methylation levels in the total mRNA. D PC3 cells were transfected with Flag-NSUN5 or a control vector (Flag), followed by CoIP to examine the interaction between CDK13 and NSUN5 and the efficacy pulled down by anti-Flag antibody. E PC3 and C4-2 cells were transfected as in (D), and RNA immunoprecipitation (RIP) with anti-Flag antibody detected the NSUN5 binding to ACC1 mRNA. F Lysates of PC3 cells were pulled down with biotinylated probe recognizing CDK13 or ACC1 mRNA, and then NSUN5 in the precipitates was detected by western blotting. G PC3 and C4-2 cells were transfected with a vector encoding wild-type or mutant forms (oeNSUN5-mut, K65A/C404, L405 del) of NSUN5, and then MeRIP-qPCR examined m5C-modified ACC1 mRNA. H PC3 and C4-2 cells were treated as in (G), and the UHPLC-MRM-MS/MS measured the m5C methylation levels in the total mRNA. I PC3 and C4-2 cells were treated as in (G), Western blot detected ACC1 and NSUN5 protein level. J, K ORO staining examined lipid accumulation in PC3 and C4-2 cells transfected with oeNSUN5 or mutant oeNSUN5. Scale bar = 20 μm. L ACC1 3’UTR was cloned into a psiCHECK™-2 Vector and then co-transfected into HEK-293T cells with shCDK13 or oeNSUN5, alone or together, and then a luciferase reporter assay detected the luciferase activity of ACC1 3ʹ-UTR luciferase reporter. M PC3 and C4-2 cells were transfected with the indicated constructs, followed by stimulation with actinomycin D for 0, 2, 4, 8 and 16 h. The ACC1 mRNA was determined by RT-qPCR. N RT-qPCR detected total and nascent ACC1 mRNA in oeNSUN5-overexpressed PC3 cells treated with or without actinomycin D or EU. ActD: actinomycin D; EU(-): without EU treatment. All data are expressed as the mean ± SEM of 3 independent experiments. *P < 0.05, #P < 0.05, ##P < 0.01 and **P < 0.01 vs. their corresponding controls.
Fig. 6
Fig. 6. ALYREF facilitates the nuclear export of ACC1 mRNA mediated by NSUN5.
A PC3 and C4-2 cells were transfected with specific siRNA against YTHDF2 (siYTHDF2), YBX1 (siYBX1) or ALYREF (siALYREF), and then RT-qPCR detected ACC1 mRNA expression. B PC3 and C4-2 cells were transfected with oeNSUN5 alone or in combination with the indicated siRNAs, and then Western blotting examined ACC1 expression. C RIP-PCR detected the ACC1 mRNA interaction with ALYREF in PC3 and C4-2 cells. D PC3 and C4-2 cells were transfected with shNSUN5 or control vector (pLKO), m5C-modified and total RNA of ACC1 were detected by RT-qPCR. E Lysates of PC3 cells were pulled down with biotinylated probe recognizing CDK13 or ACC1 mRNA. ALYREF and NSUN5 in the precipitates were detected by western blotting. F, G PC3 cells were transfected as in (D), and the nuclear and cytoplasmic fractions were isolated using NE-PER nuclear and cytoplasmic extraction reagents. Western blotting detected the subcellular distribution of ALYREF. H, I PAR-CLIP assay detected the ALYREF RNA-binding affinity. PC3 cells were transfected with the indicated constructs, and RNA was labeled with biotin at its 3’ end. RNA pulled down by Flag-ALYREF was detected and visualized by a chemiluminescent nucleic acid module. J PC3 cells were transfected with oeNSUN5 (oe) or pWPI (pW), and then RNA was isolated from the nucleus (Nuc) and cytoplasm (Cyt). mRNA of GAPDH, ACC1 and U6 was detected by RT-qPCR. K PC3 cells were treated as in (J), and the expression of NSUN5 protein and ACC1 mRNA as well as their distribution in the nucleus and cytoplasm were observed by immunofluorescence combined with FISH. Anti-NSUN5 antibody was used to detect NSUN5 protein (red), while the FITC-labeled probe was used to detect ACC1 mRNA (green). Scale bar = 5 μm. L Quantitative analysis of ACC1 mRNA fluorescence intensity in (K). All data are expressed as the mean ± SEM of 3 independent experiments. *P < 0.05, **P < 0.01, ***P < 0.001 vs. their corresponding controls.
Fig. 7
Fig. 7. Phosphorylation of NSUN5 by CDK13 enhances lipid deposition.
A PC3 and C4-2 cells were transfected with oeCDK13 and then treated with 1NM-PP1 (10 μM). Western blot examined NSUN5, p-NSUN5 and ACC1 protein expression. B Western blot analysis detected NSUN5 and p-NSUN5 expression in BPH and PCa tissues. C C4-2 cells were transfected with the vector encoding NSUN5 (WT) or different phosphorylation-deficient NSUN5 mutants, and then Western blotting examined NSUN5, p-NSUN5 and ACC1 protein level. D PC3 and C4-2 cells were co-transfected with or without oeNSUN5, oeNSUN5-S327A mutant or oeCDK13, and then Western blotting detected p-NSUN5 and ACC1 expression. E C4-2 cells were transfected with oeNSUN5 or oeNSUN5-S327A, and then CoIP-Western blotting detected the interaction between CDK13 and NSUN5. F C4-2 cells were co-transfected with the indicated constructs and then lipid accumulation was detected by ORO straining. Scale bar = 20 μm. G Quantitative analysis of ORO staining in (F). H PC3 and C4-2 cells were treated as in (F), and then TG and cholesterol contents were measured as quantitative indicators of lipid deposition. All data are expressed as the mean ± SEM of 3 independent experiments. *P < 0.05, **P < 0.01 vs. their corresponding controls.
Fig. 8
Fig. 8. Blockade of CDK13/NSUN5/ACC1 pathway-mediated fatty acid synthesis inhibits PCa progression.
A C4-2 cells were transfected with shNSUN5 and then treated with or without 1NM-PP1 (10 μM), lipid accumulation was measured by ORO straining. B Quantitative analysis of ORO staining in (A). C PC3 and C4-2 cells were treated as in (A), and cell viability was assessed by MTS assay. D Xenograft tumor models in nude mice were established by implanting PC3 cells with stable knockdown of NSUN5. From the first day, the mice were intraperitoneally injected with 20 mg/kg 1NM-PP1 every two days. Representative tumor sizes in each group were shown. E Tumor volumes were measured with calipers and calculated by the formula: (length × width2)/2. F Wet weight of the xenograft tumors was determined after tumor resection. G Western blotting detected the expression of NSUN5, p-NSUN5, ACC1 and ACLY proteins in xenograft tumors. H The expression of ACC1 and p-NSUN5 in xenograft tumors was detected by double immunofluorescence staining. Red: ACC1; green: p-NSUN5; blue: DAPI. Scale bar = 25 μm. I Quantitative analysis of fluorescence intensity of ACC1in (H). J Nile red staining detected the lipid deposition in xenograft tumors. Red: lipids; Blue: nuclei. Scale bar = 25 μm. K Quantitative analysis of Nile red staining in (J). L A proposed model illustrating the CDK13/NSUN5/ACC1 regulatory pathway-mediated fatty acid synthesis and lipid deposition. All data are expressed as the mean ± SEM of 3 independent experiments. *P < 0.05, **P < 0.01 vs. their corresponding controls.

References

    1. Coughlin SS, Vernon M, Klaassen Z, Tingen MS, Cortes JE. Knowledge of prostate cancer among African American men: a systematic review. Prostate. 2021;81:202–13. doi: 10.1002/pros.24097. - DOI - PubMed
    1. Rebello RJ, Oing C, Knudsen KE, Loeb S, Johnson DC, Reiter RE, et al. Prostate cancer. Nat Rev Dis Primers. 2021;7:9. doi: 10.1038/s41572-020-00243-0. - DOI - PubMed
    1. Nevedomskaya E, Baumgart SJ, Haendler B. Recent advances in prostate cancer treatment and drug discovery. Int J Mol Sci. 2018;19. 10.3390/ijms19051359. - PMC - PubMed
    1. Teo MY, Rathkopf DE, Kantoff P. Treatment of advanced prostate cancer. Annu Rev Med. 2019;70:479–99. doi: 10.1146/annurev-med-051517-011947. - DOI - PMC - PubMed
    1. Yu JS, Cui W. Proliferation, survival and metabolism: the role of PI3K/AKT/mTOR signalling in pluripotency and cell fate determination. Development. 2016;143:3050–60. doi: 10.1242/dev.137075. - DOI - PubMed

Publication types

LinkOut - more resources