. 2023 Nov;24(11):1947-1959.
doi: 10.1038/s41590-023-01641-8. Epub 2023 Oct 16.

Trimodal single-cell profiling reveals a novel pediatric CD8αα+ T cell subset and broad age-related molecular reprogramming across the T cell compartment

Affiliations

Trimodal single-cell profiling reveals a novel pediatric CD8αα+ T cell subset and broad age-related molecular reprogramming across the T cell compartment

Zachary Thomson et al. Nat Immunol. 2023 Nov.

Erratum in

Abstract

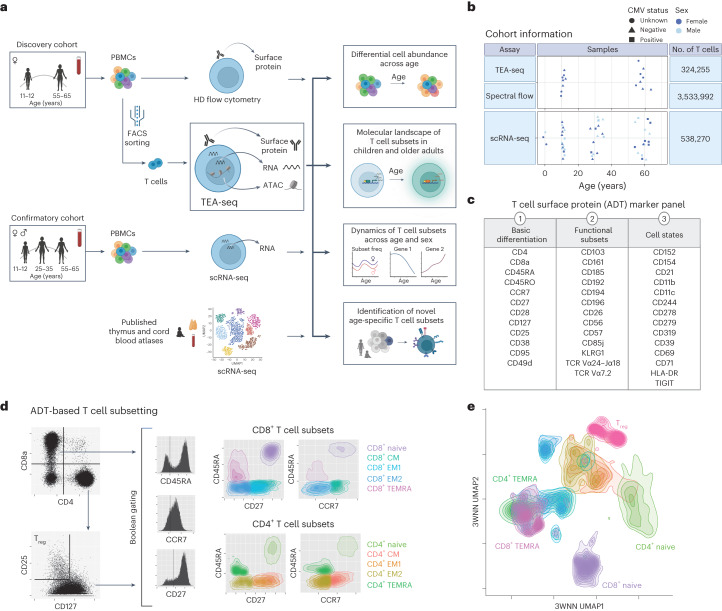
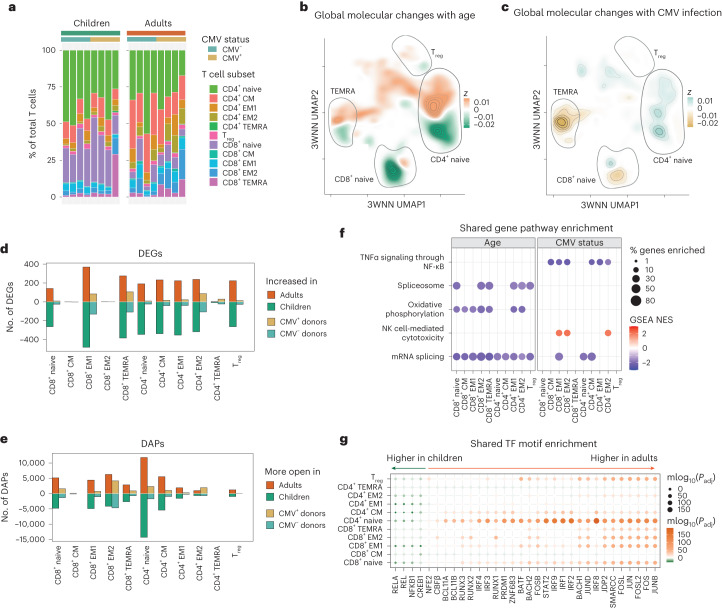
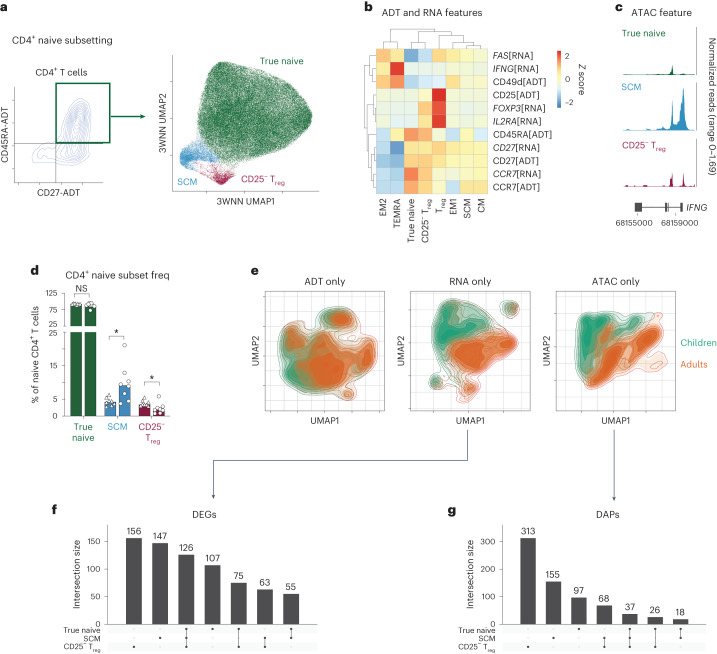
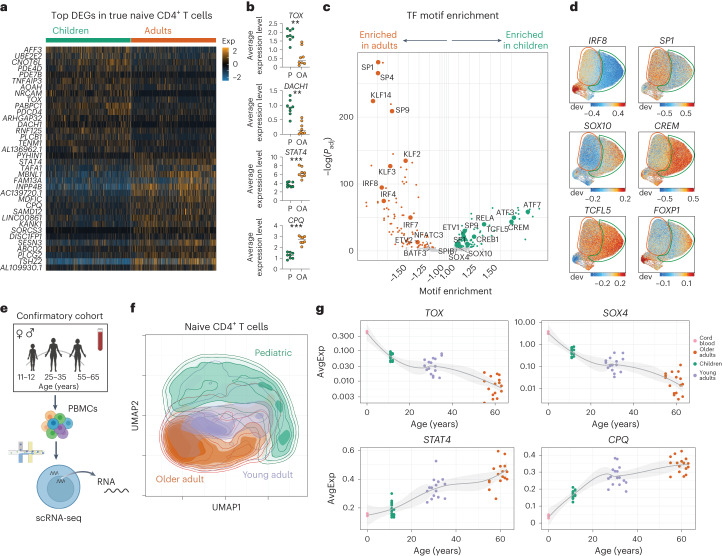
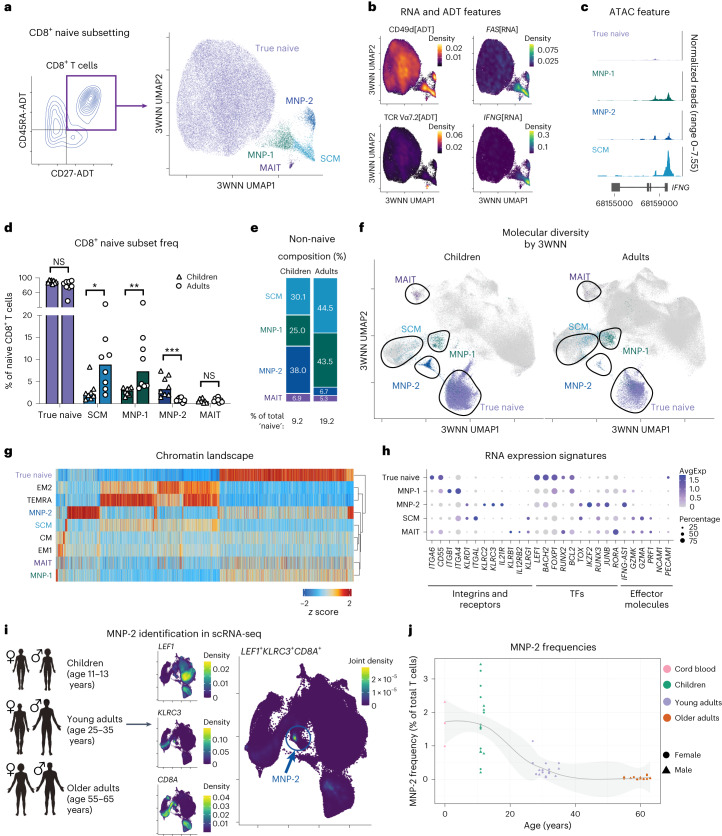
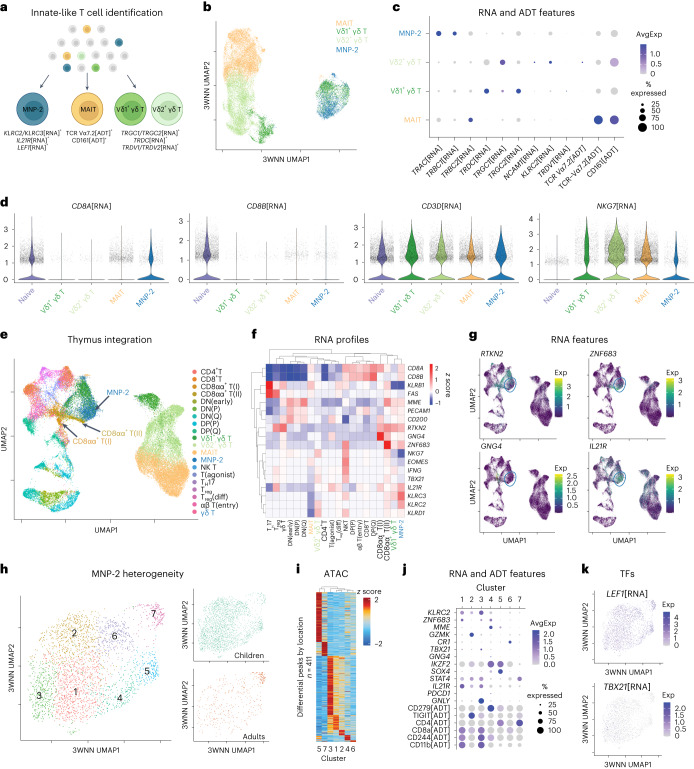
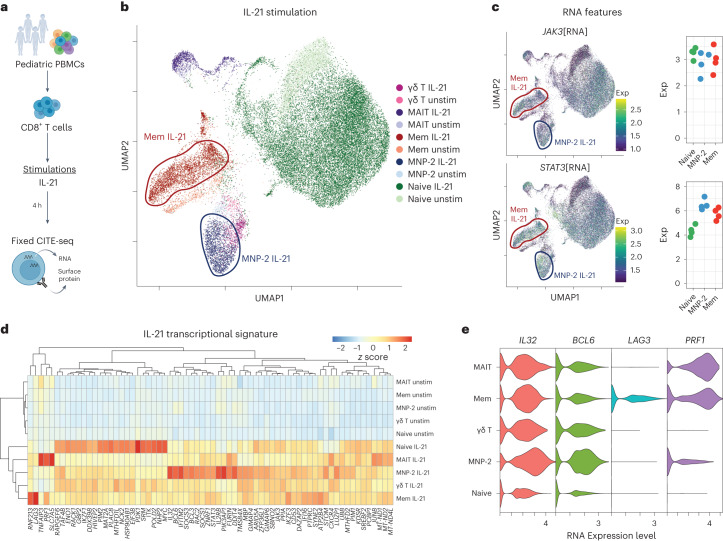
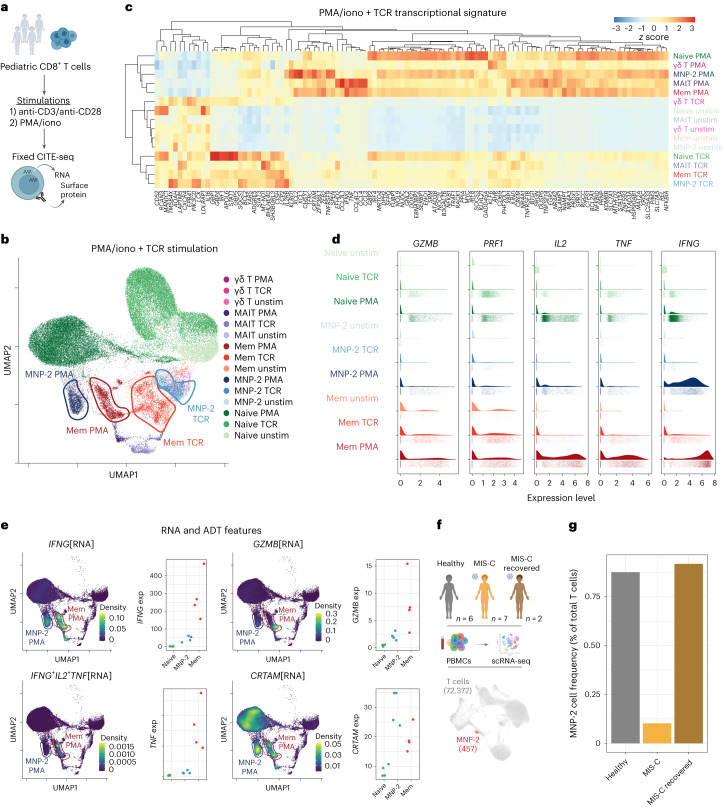
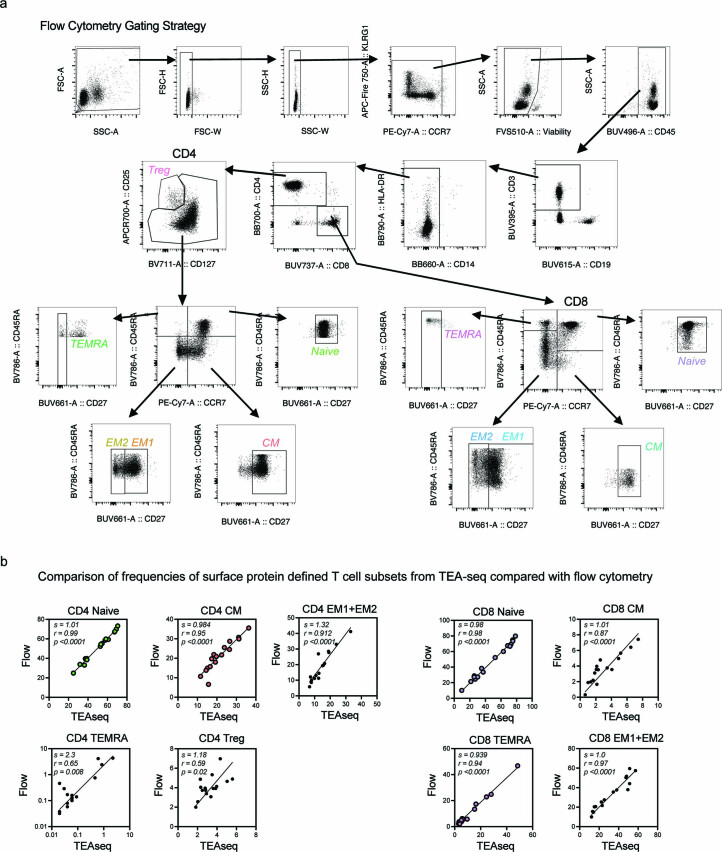
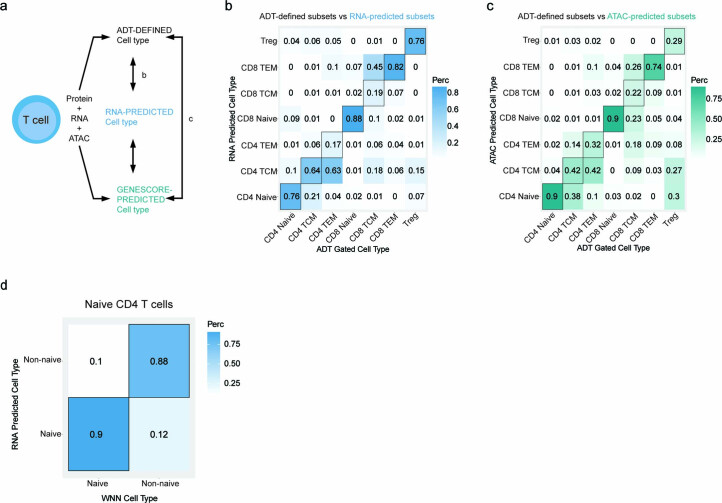
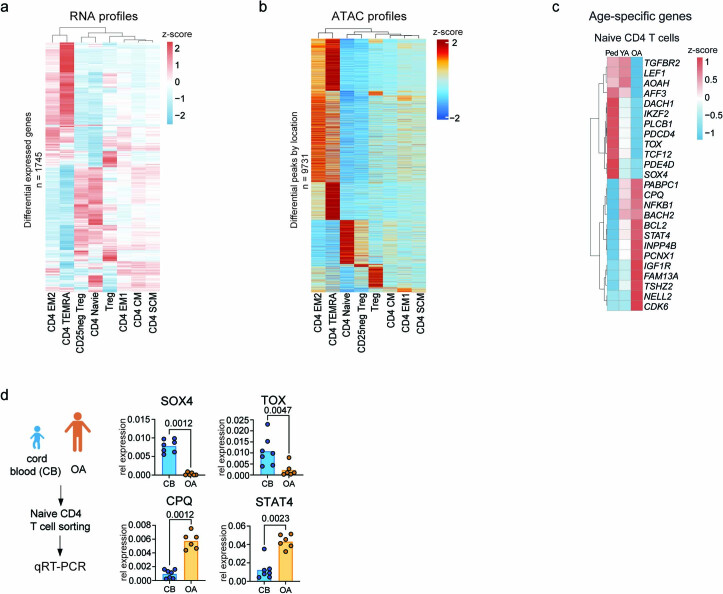
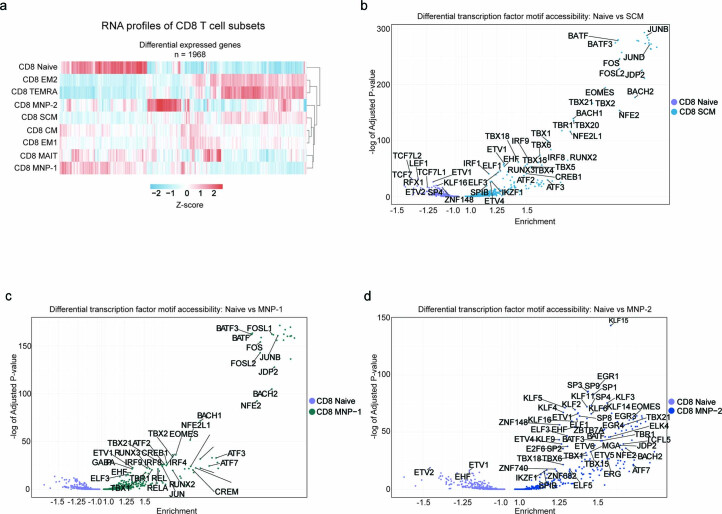
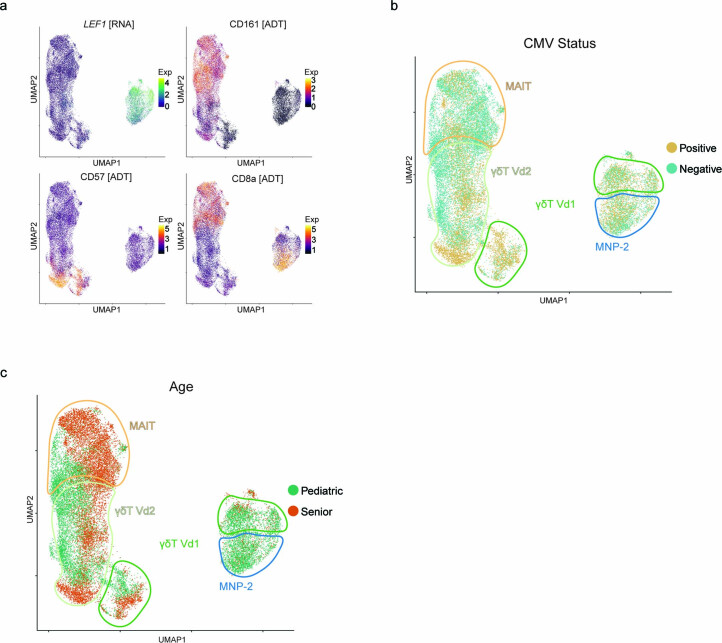
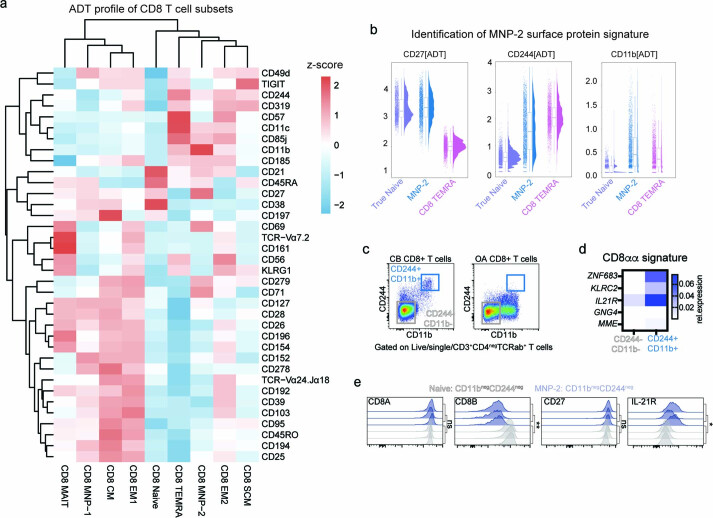
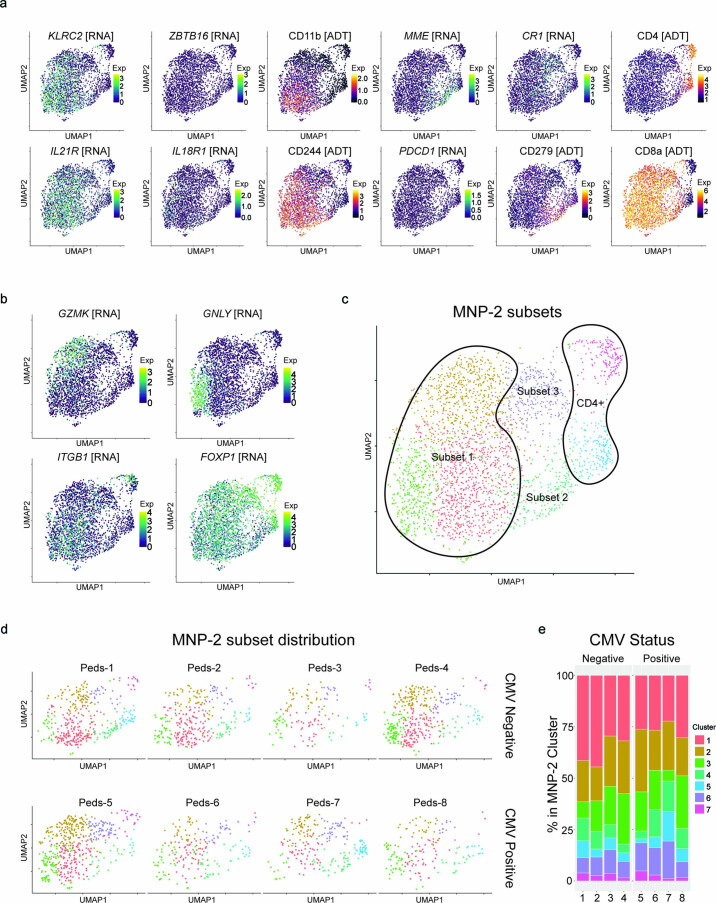
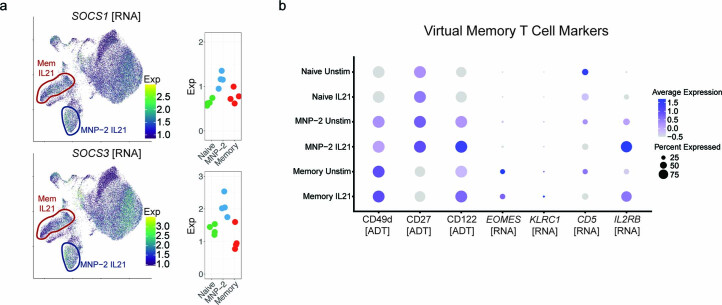
Age-associated changes in the T cell compartment are well described. However, limitations of current single-modal or bimodal single-cell assays, including flow cytometry, RNA-seq (RNA sequencing) and CITE-seq (cellular indexing of transcriptomes and epitopes by sequencing), have restricted our ability to deconvolve more complex cellular and molecular changes. Here, we profile >300,000 single T cells from healthy children (aged 11-13 years) and older adults (aged 55-65 years) by using the trimodal assay TEA-seq (single-cell analysis of mRNA transcripts, surface protein epitopes and chromatin accessibility), which revealed that molecular programming of T cell subsets shifts toward a more activated basal state with age. Naive CD4+ T cells, considered relatively resistant to aging, exhibited pronounced transcriptional and epigenetic reprogramming. Moreover, we discovered a novel CD8αα+ T cell subset lost with age that is epigenetically poised for rapid effector responses and has distinct inhibitory, costimulatory and tissue-homing properties. Together, these data reveal new insights into age-associated changes in the T cell compartment that may contribute to differential immune responses.


Conflict of interest statement

G.L.S. and S.V.V. are current employees of Seagen. All other authors declare that they have no competing interests.

Figures

Fig. 1
Fig. 1. Approach for investigating T cell subsets across age using the trimodal TEA-seq assay.
a, Overview of the discovery (n = 8 donors per age group) and confirmatory (n = 16 donors per age group) cohorts and associated assays. HD, high-dimensional; FACS, fluorescence-activated cell sorting; UMAP 1/2, Uniform Manifold Approximation and Projection 1/2; Subset freq, subset frequency. b, Cohort demographics and number of T cells per assay. c, T cell-targeted ADT surface marker panel (40 antibodies) used in TEA-seq analysis. HLA-DR, human leukocyte antigen D related; TIGIT, T cell immunoglobulin and immunoreceptor tyrosine-based inhibitory motif domain. d, T cell subset gating strategy for TEA-seq data using the expression of seven ADT markers: CD8, CD4, CD25, CD127, CD45RA, CCR7 and CD27. CM, central memory; EM1, effector memory type 1; EM2, effector memory type 2; TEMRA, terminally differentiated effector memory. e, 3WNN (ADT + RNA + ATAC) UMAP plot of ADT-defined T cell subsets from all donors, based on cellular density and colored according to T cell subset.
Fig. 2
Fig. 2. Impact of age on the transcriptional and epigenetic landscape of T cell subsets.
a, Mean frequency of each T cell subset within the T cell compartment in children and older adults, grouped by CMV infection status. b,c, 3WNN UMAP plots colored according to cell density in each age category (b; green, greater in children; orange, greater in older adults) or in each CMV infection status group (c; blue, greater in CMV-negative donors; yellow, greater in CMV-positive donors). d,e, Number of DEGs (d) and DAPs (e) within each T cell subset by age (green, higher in children; orange, higher in older adults) or CMV infection status (blue, higher in CMV-negative donors; yellow, higher in CMV-positive donors). f, Gene set enrichment analysis (GSEA) of each T cell subset, comparing age- or CMV infection status-related differences. A false discovery rate (FDR) of <0.05 was considered significant. Dot size corresponds to the percentage of leading edge genes enriched in the indicated pathway. Dot color corresponds to the normalized enrichment score (NES). g, Shared TF motif enrichment based on DAPs between age groups or CMV infection status within each T cell subset. No significant motifs were detected for CMV comparisons. Both the size and color of each point correspond to the Padj of enrichment determined by hypergeometric testing, with green indicating higher accessibility in pediatric donors and orange indicating higher accessibility in adult donors. NFE2, nuclear factor, erythroid 2; CBFβ, core-binding factor subunit β; BCL11A/BCL11B, B-cell lymphoma/leukemia 11A/B; RUNX1/RUNX2/RUNX3, Runt-related TF 1/2/3; IRF1/IRF2/IRF3/IRF4/IRF8/IRF9, IFN regulatory factor 1/2/3/4/8/9; PRDM1, PR domain zinc finger protein 1; ZNF683, zinc finger protein 683; BATF, basic leucine zipper TF, ATF-like; BACH1/BACH2, broad complex-tramtrack-bric a brac and cap‘n’collar homology 1/2; STAT2, signal transducer and activator of transcription 2; JDP2, JUN dimerization protein 2; SMARCC, SWI/SNF-related, matrix-associated, actin-dependent regulator of chromatin subfamily C. Source data
Fig. 3
Fig. 3. Age-specific alterations in the naive CD4+ T cell compartment.
a, Identification of subsets within CD4+CD27+CD197+CD45RA+ T cells through a trimodal analysis, shown in a 3WNN UMAP plot with the true naive, SCM and CD25[ADT] Treg subsets colored. b, ADT and RNA markers delineating naive CD4+ T cell subsets. The modality of detection is indicated in square brackets. c, Chromatin accessibility tracks of the IFNG gene region in naive CD4+ T cell subsets, showing normalized read coverage. d, Bar plot (median value shown) of the frequencies of naive CD4+ T cell subsets within the overall naive CD4+ compartment by age group (n = 8 per group). Triangles are children and circles are adults. P values were determined by a two-tailed Mann–Whitney test with the Holm–Sidak multiple-comparison method. *P < 0.05 (P = 0.03); NS, not significant. e, Single-modality (ADT, RNA or ATAC) cell density UMAP plots colored by age group (green, children; orange, adults). f,g, UpSet plots showing the number of DEGs (f) or DAPs (g) between age groups for each combination of naive CD4+ T cell subsets. Source data
Fig. 4
Fig. 4. Molecular reprogramming of naive CD4+ T cells across age.
a, Heat map of the top 20 DEGs for each age group in individual true naive CD4+ T cells. For visualization, values are scaled (z score) per gene. Exp, scaled expression. b, Dot plots of average pseudobulk gene expression for select transcripts in true naive CD4+ T cells separated by age (n = 8 per group; P, pediatric; OA, older adult). The line indicates the median value. P values were determined by a two-tailed Mann–Whitney test. **P = 0.0006, ***P = 0.0002. c, TF binding motif enrichment comparison between age groups in true naive CD4+ T cells. The Padj of enrichment was determined by hypergeometric testing. ETV1/ETV2, ETS translocation variant 1/2; NFATC3, nuclear factor of activated T cells, cytoplasmic 3; ATF3/ATF7, activating TF 3/7; TCFL5, TF-like 5 protein; CREM, cAMP-responsive element modulator; SPIB, Spi-B TF; SOX4/SOX10, SRY-box TF 4/10. d, ChromVar motif enrichment UMAP plots. Areas enriched for true naive CD4+ T cells in older adults (orange) and children (green) are outlined. dev, deviation. e, Overview of the scRNA-seq confirmatory cohort (n = 16 per age group). f, RNA-based UMAP plot of naive CD4+ T cells from the confirmatory cohort. g, Average pseudobulk expression of select signature genes in the naive CD4+ T cell subset for each donor across all age groups, including an external cord blood (n = 3) dataset. Best-fit lines with 95% confidence intervals are shown. AvgExp, average expression. Source data
Fig. 5
Fig. 5. Reorganization of the naive-like memory CD8+ T cell compartment across age.
a, Identification of subsets within CD8+CD27+CD197+CD45RA+ T cells through a trimodal analysis, shown in a 3WNN UMAP plot with the true naive, SCM, MNP-1, MNP-2 and MAIT subsets colored. b, Expression of select RNA and ADT cell type markers, shown in 3WNN UMAP plots. The modality of detection is indicated in square brackets. Density, gene-weighted 2D kernel density. c, Chromatin accessibility tracks of the IFNG gene region in naive CD8+ T cell subsets, showing normalized read coverage. d, Bar plot (median value shown) of the frequencies of naive CD8+ T cell subsets within the overall naive CD8+ compartment by age group (n = 8 per group). P values were determined by a two-tailed Mann–Whitney test with the Holm–Sidak multiple-comparison method. *P < 0.05 (P = 0.02), **P < 0.01 (P = 0.003), ***P < 0.001 (P = 0.0008). e, Age-specific composition of the non-naive compartment found within naive CD8+ T cells. f, 3WNN UMAP plot of all T cells overlaid with naive CD8+ T cell subsets and separated by age. Only cells from the naive CD8+ T cell compartment of children (left) or adults (right) are colored; all other cells are gray. g, Comparison of differential chromatin accessibility across all CD8+ T cell subsets (24,874 features). For visualization, all values are scaled (z score) per differential region. h, Dot plot of select DEGs across naive CD8+ T cell subsets. The size of points corresponds to the fraction of cells expressing each gene; color corresponds to average expression. AvgExp, scaled average expression. i, Identification of the MNP-2 subset through gene expression profiling in the scRNA-seq confirmatory cohort. Density, gene-weighted 2D kernel density. j, MNP-2 subset frequencies within the total T cells across all age groups including an external cord blood (n = 3) dataset. Source data
Fig. 6
Fig. 6. A pediatric-specific naive-like memory CD8+ T cell subset (MNP-2) is a unique IL-21RhiCD8αα+ population.
a, In situ reanalysis of the TEA-seq dataset for multimodal identification of MNP-2, MAIT and γδ T cell populations. b, 3WNN UMAP plot of the MNP-2, MAIT, Vδ1+ γδ and Vδ2+ γδ T cell populations. c, Dot plot showing the expression of γδ T (for example, TRDC[RNA], TRGC1[RNA], TRDV1[RNA]), MAIT (for example, TCR Vα7.2[ADT], CD161[ADT]) and NK T (for example, NCAM1[RNA]) cell-type-specific markers on each defined T cell subset. d, Violin plots of the single-cell expression of select genes for all T cells (for example, CD3D[RNA]), T cell coreceptors (for example, CD8A[RNA], CD8B[RNA]) and innate-like T cells (for example, NKG7[RNA]). e, UMAP integration of RNA expression for MNP-2, MAIT and γδ T cells from the TEA-seq dataset with an external pediatric thymic T cell dataset. DN, double negative; DP, double positive; P, proliferating; Q, quiescent; TH17, T helper type 17 cell; diff, differentiating. f, Heat map of select genes related to T cell subsets and functionality compared across T cell types. For visualization, values are scaled (z score) for each gene. Hierarchical clustering of rows (genes) and columns (cell types) was constructed using pheatmap. g, CD8αα+ subset-specific gene expression shown in integrated RNA UMAP plots with the MNP-2 population circled in blue. h, Subclustering of MNP-2 cells shown in a 3WNN UMAP plot (clusters are numbered); right plots show cells divided by age (green, children; orange, adults). i, Comparison of differential chromatin accessibility across MNP-2 subclusters (411 features). For visualization, all values are scaled (z score) per differential region. j, Dot plot of select protein and RNA expression of cluster-defining markers. k, Single-cell RNA expression of the TFs TBX21 and LEF1 in MNP-2 subsets, shown in 3WNN UMAP plots.
Fig. 7
Fig. 7. IL-21-induced responses in pediatric CD8+ T cell subsets.
a, Overview of a fixed CITE-seq experiment for IL-21 stimulation. b, RNA-based UMAP plot of unstimulated and IL-21 (50 ng ml−1, 4 h)-stimulated pediatric CD8+ T cells (n = 4 pediatric donors). Select stimulated subsets are indicated. Mem, memory; unstim, unstimulated. c, Select gene expression indicative of IL-21R signaling in IL-21 stimulation, shown in RNA-based UMAP plots. Pseudobulk RNA expression in naive, MNP-2 and memory CD8+ T cells after IL-21 stimulation is shown to the right of each UMAP plot. exp, average expression level. d, Comparison of DEGs across each subset of IL-21-stimulated and unstimulated CD8+ T cells. e, Violin plots of select DEGs from CD8+ T cell subsets after stimulation with IL-21. Source data
Fig. 8
Fig. 8. Distinct effector responses in MNP-2 cells from children.
a, Overview of a fixed CITE-seq experiment (n = 4 pediatric donors) for TCR stimulation. b, RNA-based UMAP plot of unstimulated, anti-CD3/anti-CD28 (TCR; 0.5:1 beads per cell)-stimulated and PMA/iono (PMA 50 ng ml−1, iono 1 μg ml−1)-stimulated pediatric CD8+ T cells. Stimulated subsets are indicated with the stimulation condition. c, Comparison of DEGs across each subset of unstimulated, TCR-stimulated and PMA/iono-stimulated CD8+ T cells. d, Violin plots of the single-cell expression of select effector genes for naive, MNP-2 and memory CD8+ T cells before and after stimulation with TCR and PMA/iono. e, Expression density of select RNA and ADT cell type markers, shown in UMAP plots of PMA/iono-stimulated and unstimulated cells. The modality of detection is indicated in square brackets. Density, gene-weighted 2D kernel density; exp, average expression level. f, Overview of an external pediatric MIS-C scRNA-seq dataset used for MNP-2 cell identification and frequency comparison. g, Frequency of MNP-2 cells in the total peripheral T cells of healthy children (n = 6), children with active MIS-C (n = 7) and children who had recovered from MIS-C (n = 2). Source data
Extended Data Fig. 1
Extended Data Fig. 1. Defining T cell subsets based on surface proteins across different assays.
(a) Flow cytometry gating strategy for identifying T cell subsets. (b) Two-sided Spearman correlations for frequencies of T cell subsets within total T cells determined by either ADT-based gating in TEA-seq or by flow cytometry in the same donor samples. s, slope. Source data
Extended Data Fig. 2
Extended Data Fig. 2. Comparative analysis of T cell subset definitions across individual modalities.
(a) Overview of single-cell labeling methods used for each TEA-seq modality (ADT, RNA, or ATAC). (b) Confusion plot comparison of T cell subset labels of single T cells between ADT-defined and Seurat RNA-prediction methods. (c) Confusion plot comparison of T cell subset labels of single T cells between ADT-defined and ATAC-prediction (ArchR) methods. (d) Confusion plot comparison of WNN labels and RNA-based label transfer of ADT-defined (CD45RA+CD197+CD27+) naive CD4 T cells.
Extended Data Fig. 3
Extended Data Fig. 3. Comparison of transcriptional and epigenetic profiles of true naive CD4 T cells with CD4 T cell subsets and across age.
(a) Heatmap of all differentially expression genes (DEGs) using Seurat’s FindAllMarkers function (parameters: logfc.threshold = 0.25, P < 0.05 determined by two-tailed Wilcoxon’s rank sum test) between CD4 T cell subsets in TEA-seq dataset. (b) Heatmap of all differentially accessible peaks using ArchR’s getMarkerFeatures (parameters: FDR< = 0.1, Log2FC ≥ 0.5) between CD4 T cell subsets in TEA-seq dataset. (c) Pseudo-bulk expression values from our confirmatory scRNA-seq dataset from pediatric (Ped), young adult (YA), and older adult naive CD4 T cells of select age-specific genes identified in TEA-seq. (d) Gene expression of SOX4, TOX, CPQ, and STAT4 in bulk-sorted naive CD4 T cells (CD3+CD4+CD8neg CD45RA+CCR7+CD27+CD95neg) from newborn cord blood (n = 7 donors) and older adult peripheral blood (n = 6 donors) using qRT-PCR. Two-tailed Mann-Whitney test. * P < 0.05, **** P < 0.0001. In panels a–c, values have been scaled (z-score) per gene or peak. Source data
Extended Data Fig. 4
Extended Data Fig. 4. Comparison of transcriptional and epigenetic profiles of naive CD8 T cell subsets.
(a) Heatmap of all differentially expression genes using Seurat’s FindAllMarkers function (parameters: logfc.threshold = 0.25, P < 0.05 determined by two-tailed Wilcoxon’s rank sum test) between CD8 T cell subsets in TEA-seq dataset. For visualization, values have been scaled (z-score) for each marker. (b–d) Transcription factor motif enrichment based on differentially accessible peaks between (b) true naive versus SCM, (c) true naive vs MNP-1, and (d) true naive versus MNP-2 CD8 T cell subsets. The adjusted pval of enrichment determined by hypergeometric testing. Source data
Extended Data Fig. 5
Extended Data Fig. 5. Comparison of MNP-2, MAIT and gdT cell subsets.
(a) Protein and RNA markers of interest on integrated 3WNN UMAP of innate-like T cell subsets and MNP-2 cells. (b-c) Distribution of innate-like T cell subsets and MNP-2 cells by (b) CMV infection status and (c) age. Each specific cell subset is labeled.
Extended Data Fig. 6
Extended Data Fig. 6. ADT expression profiles of MNP-2 CD8 T cells.
(a) Expression heatmap of 36 ADTs across all CD8 T cell subsets in our TEA-seq dataset. Lineage markers CD3, CD4, CD8a, and CD16 were excluded from analysis. For visualization, values have been scaled (z-score) for each marker. (b) Single cell expression of surface protein ADTs CD27, CD244, and CD11b on MNP-2, true naive and TEMRA CD8 T cell subsets pooled from all donors (n = 16) in our TEA-seq dataset. Box plots are 25% and 75% quartiles with median shown. c) Protein expression of CD244 and CD11b on TCRab+ CD8+CD4neg T cells in cord blood (CB) and older adult (OA) PBMCs determined by flow cytometry. (d) Average RNA expression of CD8aa-specific genes in CD244+CD11b+ and CD244negCD11bneg populations of TCRab+CD8+CD4neg T cells sorted from cord blood (n = 4 donors) determined by qRT-PCR. (e) Surface protein expression of CD8A, CD8B, CD27, and IL-21R on CD244+CD11b+ and CD244negCD11bneg populations of TCRab+ CD8+CD4neg T cells from cord blood (n = 3 donors). P-values were determined by two-tailed paired t-test. *P < 0.05 (p = 0.028), **P < 0.01 (P = 0.0016), ns = not significant. Source data
Extended Data Fig. 7
Extended Data Fig. 7. No expression of MNP-2 surface phenotype with naive CD8 T cell activation.
(a) Surface protein marker profiles of naive and MNP-2 CD8 T cells. (b) Naive CD8 T cell activation experiment with TCR stimulation (anti-CD3/anti-CD28 beads (0.5 beads per cell)). Cells were assessed over a 7-day time course for MNP-2 surface markers (CD8-beta, CD244, CD11b, IL21R) and activation markers (CD69, CD25, CD71) by flow cytometry. (c) Representative plot of MNP-2 cells delineated by CD8-betaLow and CD244high co-expression pre- and post-isolation, as well as over a 7-day time course post-TCR stimulation. (d) Frequencies of CD8-betaLowCD244high MNP-2 cells over the TCR stimulation time course (n = 4–7 donors). Results are from three independent experiments. P-values were determined by one-way ANOVA with Holm-Sidak’s multiple comparisons test. ****P < 0.0001. Tukey’s box plots with median with 1st and 3rd quartiles shown. (e) Representative histograms of activation markers and (f) frequencies of positive cells for each activation marker over the TCR stimulation time course (n = 4 donors). Mean +/− sem. Source data
Extended Data Fig. 8
Extended Data Fig. 8. Heterogeneity within MNP-2 cells in children.
(a–b) Single-cell RNA and ADT expression of (a) MNP-2 subset and (b) state-specific markers in total MNP-2 cells on 3WNN UMAP. (c) Different MNP-2 subsets identified in 3WNN clustering. (d) Distribution of MNP-2 cells with 3WNN UMAP for each individual pediatric donor. Top row is CMV-negative donors, bottom row is CMV-positive donors. (e) Proportion of each identified cluster within MNP-2 cells in children, separated by CMV infection status (n = 8 total donors).
Extended Data Fig. 9
Extended Data Fig. 9. Pediatric CD8 T cell responses to IL-21 stimulation.
(a) Select gene expression from IL-21R signaling pathway in IL-21 stimulation UMAP. (b) Violin plots of RNA and ADT expression of virtual memory CD8 T cell markers on naïve, MNP-2 and memory CD8 T cells pre- and post-IL-21 stimulation. Source data
Extended Data Fig. 10
Extended Data Fig. 10. Profiling MNP-2 responses to TCR and PMA/iono stimulation.
(a) RNA-based UMAP of TCR (upper row) and PMA/ionomycin (lower row) stimulations for each of the 4 pediatric donors. (b) RNA-based UMAP with CD69 gene and ADT expression in unstimulated and 4h TCR (aCD3/aCD28 beads; 0.5:1 beads per cell) and 4h PMA/iono stimulated pediatric CD8 T cells (n = 4 donors). Subsets with stimulation condition are circled. (c) GSEA analysis in naive, MNP-2, and memory CD8 T cell subsets comparing TCR stimulated versus unstimulated conditions. FDR < 0.05 was considered significant in the fgsea analysis. Dot size corresponds to the percent of genes that showed enrichment for the indicated pathway and cell type. Dot color corresponds to the normalized enrichment score (NES). (d) Pseudobulk RNA expression in naive, MNP-2, and memory CD8 T cells of IFNG and SPRY2 post-TCR or post-PMA/iono stimulation. (e) Dot plot of exhaustion and senescence-related gene and protein (ADT) expression profiles in naive, MNP-2, and memory CD8 T cells pre- and post-TCR stimulation. (f) CD27 and CD28 surface protein expression in unstimulated and TCR stimulated pediatric CD8 T cells on RNA-based UMAP. (g) Effector gene profile (CCL3, CCL4, CCL5, CSF2) and (h) co-stimulatory receptor (CD137[ADT], TNFRSF9[RNA]) expression in unstimulated and PMA (50 ng/ml) plus ionomycin (1 μg/ml) (PMA/iono) stimulated pediatric CD8 T cells on RNA-based UMAP. Pseudobulk RNA expression in naive, MNP-2, and memory CD8 T cells is shown to the right of each UMAP. (i) Frequency of MNP-2 cells in total peripheral T cells in healthy (n = 6), moderate MIS-C (n = 2), recovered moderate MIS-C (n = 1), severe MIS-C (n = 5), recovered severe MIS-C (n = 1) children from an external dataset (GSE166489)). (j) TCR alpha and beta V-J gene usage in MNP-2 cells in healthy (TRA: 153 cells, TRB: 208 cells) and recovered MIS-C (TRA: 67 cells, TRB: 84 cells) children. Source data

References

    1. Santesmasses D, et al. COVID-19 is an emergent disease of aging. Aging Cell. 2020;19:e13230. doi: 10.1111/acel.13230. - DOI - PMC - PubMed
    1. Akondy RS, et al. Origin and differentiation of human memory CD8 T cells after vaccination. Nature. 2017;552:362–367. doi: 10.1038/nature24633. - DOI - PMC - PubMed
    1. Fuertes Marraco SA, et al. Long-lasting stem cell-like memory CD8+ T cells with a naïve-like profile upon yellow fever vaccination. Sci. Transl. Med. 2015;7:282ra48. doi: 10.1126/scitranslmed.aaa3700. - DOI - PubMed
    1. Gattinoni L, et al. A human memory T cell subset with stem cell-like properties. Nat. Med. 2011;17:1290–1297. doi: 10.1038/nm.2446. - DOI - PMC - PubMed
    1. Moskowitz DM, et al. Epigenomics of human CD8 T cell differentiation and aging. Sci. Immunol. 2017;2:eaag0192. doi: 10.1126/sciimmunol.aag0192. - DOI - PMC - PubMed