. 2023 Sep;28(9):3930-3942.
doi: 10.1038/s41380-023-02290-x. Epub 2023 Oct 16.

cAMP-mediated upregulation of HCN channels in VTA dopamine neurons promotes cocaine reinforcement

Affiliations

cAMP-mediated upregulation of HCN channels in VTA dopamine neurons promotes cocaine reinforcement

Lianwei Mu et al. Mol Psychiatry. 2023 Sep.

Abstract

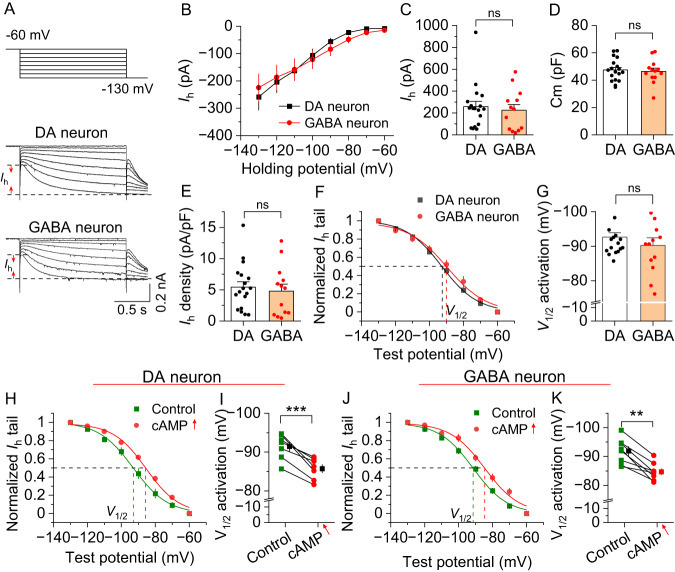
Chronic cocaine exposure induces enduring neuroadaptations that facilitate motivated drug taking. Hyperpolarization-activated cyclic nucleotide-gated (HCN) channels are known to modulate neuronal firing and pacemaker activity in ventral tegmental area (VTA) dopamine neurons. However, it remained unknown whether cocaine self-administration affects HCN channel function and whether HCN channel activity modulates motivated drug taking. We report that rat VTA dopamine neurons predominantly express Hcn3-4 mRNA, while VTA GABA neurons express Hcn1-4 mRNA. Both neuronal types display similar hyperpolarization-activated currents (Ih), which are facilitated by acute increases in cAMP. Acute cocaine application decreases voltage-dependent activation of Ih in VTA dopamine neurons, but not in GABA neurons. Unexpectedly, chronic cocaine self-administration results in enhanced Ih selectively in VTA dopamine neurons. This differential modulation of Ih currents is likely mediated by a D2 autoreceptor-induced decrease in cAMP as D2 (Drd2) mRNA is predominantly expressed in dopamine neurons, whereas D1 (Drd1) mRNA is barely detectable in the VTA. Moreover, chronically decreased cAMP via Gi-DREADD stimulation leads to an increase in Ih in VTA dopamine neurons and enhanced binding of HCN3/HCN4 with tetratricopeptide repeat-containing Rab8b-interacting protein (TRIP8b), an auxiliary subunit that is known to facilitate HCN channel surface trafficking. Finally, we show that systemic injection and intra-VTA infusion of the HCN blocker ivabradine reduces cocaine self-administration under a progressive ratio schedule and produces a downward shift of the cocaine dose-response curve. Our results suggest that cocaine self-administration induces an upregulation of Ih in VTA dopamine neurons, while HCN inhibition reduces the motivation for cocaine intake.


Conflict of interest statement

The authors declare no competing interests.

Figures

Fig. 1
Fig. 1. Expression of Hcn1–4 mRNA in rat VTA dopamine and GABA neurons.
Representative 63x images of VTA sections labeled with RNAscope in situ hybridization for Hcn1–4 (red), Gad1 (GABA neuron, yellow) and Slc6a3 (dopamine neuron, green) mRNA. A, B Hcn1 and Hcn2 mRNA were highly expressed in Gad1 neurons, but barely detectable in Slc6a3 neurons. Hcn2 mRNA was also expressed on a cell type that remains to be detected. C, D Hcn3 and Hcn4 mRNA were expressed in both Gad1 neurons and Slc6a3 neurons. E Left, percentage of VTA dopamine neurons co-expressing Hcn1–4 (Hcn1: 208 of 2245 neurons; Hcn2: 286 of 2350 neurons; Hcn3: 1591 of 1661 neurons; Hcn4: 1109 of 2392 neurons). Right, the number of Hcn1–4 mRNA puncta expressed in VTA dopamine neurons. F Left, percentage of VTA GABA neurons co-expressing Hcn1–4 (Hcn1: 428 of 619 neurons; Hcn2: 628 of 736 neurons; Hcn3: 509 of 545 neurons; Hcn4: 514 of 634 neurons. Right, the number of Hcn1–4 mRNA puncta expressed in VTA GABA neurons. (n = 8 to 14 imaged sections from 4 rats).
Fig. 2
Fig. 2. Ih currents were not significantly different between VTA dopamine and GABA neurons and were sensitive to cAMP stimulation.
A Left: Voltage protocol for recording Ih current. Right: Representative Ih traces recorded from dopamine (DA) neurons and GABA neurons in the VTA. B There was no significant difference in Ih between dopamine and GABA neurons at all corresponding hyperpolarization potentials (two-way RM ANOVA, cell-type, F1,29 = 0.02, p = 0.894; holding potential, F7,203 = 37.7, p < 0.001; cell-type ⨯ holding potential interaction, F7,203 = 0.6, p = 0.770; DA neuron, n = 18 cells; GABA neuron, 13 cells; n = 4 rats). C Ih amplitude was calculated by subtracting the instantaneous current from the steady-state current achieved during the voltage step at −130 mV, and no significant difference was detected (t-test, t29 = 0.5, p = 0.640, n = 13–18 cells). D There was no significant difference in membrane capacitance (Cm) between dopamine and GABA neurons (t-test, t29 = 0.4, p = 0.728, n = 13–18). E Ih current density (=Ih amplitude at −130 mV/Cm) was not significantly different between dopamine neurons and GABA neurons (t-test, t29 = 0.5, p = 0.655, n = 13–18). F Ih activation curves in dopamine neurons and GABA neurons were generated by the tail current protocol. Tail current amplitudes were fitted with a Boltzmann function. G There was no significant difference in the midpoint activation voltage (V1/2) between dopamine and GABA neurons (t-test, t29 = 1.0, p = 0.322). H, I Increasing cAMP (cAMP ↑ ) via bath perfusion of forskolin (20 µM) and rolipram (1 µM) led to a significant rightward shift in the Ih activation curve of and a significant depolarizing shift in the V1/2 of VTA dopamine neurons (paired t-test t6 = 6.4, p < 0.001, n = 7 from 3 rats). J, K Increasing cAMP led to a significant depolarizing shift in the Ih activation curve and a depolarizing shift in the V1/2 of VTA GABA neurons (paired t-test, t7 = 3.9, p = 0.006, n = 8 from 3 rats). ns, not significant, p > 0.05, **p < 0.01, ***p < 0.001.
Fig. 3
Fig. 3. Bath application of cocaine induced a hyperpolarizing shift of the V1/2 of Ih currents in VTA dopamine neurons through activation of the D2-autoreceptor.
A, B Bath perfusion of cocaine (10 μM) induced a significant leftward shift in the Ih activation curve and a hyperpolarizing shift of the V1/2 of VTA dopamine neurons (paired t-test, t6 = 6.3, p < 0.001, n = 7 from 3 rats). C, D The shifts of cocaine on the Ih activation curve and the V1/2 were blocked by D2 receptor antagonist sulpiride (1 μM) (paired t-test, t5 = 0.5, p = 0.641, n = 6 from 3 rats). E, F Drd2 mRNA was abundantly expressed and completely colocalized with Slc6a3 mRNA but was expressed only in ~10% of GABA neurons (ns, not significant, p > 0.05, ***p < 0.001; n = 2 rats). G Drd1 mRNA was barely detected in both dopamine and GABA neurons in the VTA (n = 2 rats).
Fig. 4
Fig. 4. Cocaine self-administration led to upregulation of Ih in VTA dopamine neurons.
A Timeline of jugular vein catheterization, cocaine self-administration and electrophysiology. B Representative Ih currents recorded from VTA dopamine neurons after 10 days of yoked saline (YS), cocaine self-administration (SA) and yoked cocaine infusions (YC). C Compared with yoked saline infusions, cocaine self-administration and yoked cocaine infusions led to significant increases in Ih currents at corresponding hyperpolarization potentials (two-way RM ANOVA, Cocaine, F2,40 = 8.6, p < 0.001; holding potential, F7,280 = 248.9, p < 0.001; Cocaine ⨯ holding potential interaction, F14,280 = 5.5, p < 0.001; n = 14–15 from 5 rats; yoked saline vs cocaine SA, blue * and #, yoked saline vs yoked cocaine, red * and #; *p < 0.01, #p < 0.001). DF Cocaine self-administration and yoked cocaine infusions led to significant increases in Ih amplitude (D; one-way ANOVA, F2,42 = 6.5, p = 0.004, n = 14-15) and Ih density (F; one-way ANOVA, F2,42 = 5.1, p = 0.010, n = 14–15 cells from 5 rats), but did not significant change the membrane capacitance (Cm) of VTA dopamine neurons (E; one-way ANOVA, F2,42 = 0.5, p = 0.587, n = 14–15 cells). G, H Cocaine self-administration and yoked cocaine infusions led to depolarizing shifts in the Ih activation curve the V1/2 of VTA dopamine neurons (one-way ANOVA, F2,42 = 4.9, p = 0.012, n = 14–15 cells). I Left: A schematic diagram shows the location of the stimulating electrode (S) and recording electrode (R). Representative EPSPs (50 Hz ⨯ 5) showing temporal summation before and after application of ZD7288. Right, Comparison of changes in temporal summation of EPSPs (EPSP5/EPSP1 ratio) in cocaine self-administration, yoked cocaine and yoked saline groups in the absence and presence of ZD7288 (two-way RM ANOVA, Cocaine, F2,24 = 0.2, p = 0.856; ZD7288, F1,24 = 172.0, p < 0.001; Cocaine ⨯ ZD7288 interaction, F1,24 = 18.1, p < 0.001; n = 9 cells from 4 rats). JM Cocaine self-administration did not alter the Ih density (J, K; t-test, t25 = 0.4, p = 0.716) and V1/2 (L, M; t-test, t18 = 0.5, p = 0.597) of GABA neurons in the VTA. For (DI), *p < 0.05, **p < 0.01, ***p < 0.001.
Fig. 5
Fig. 5. Chronically decreasing cAMP with hM4D(Gi) induced an up-regulation of Ih in VTA dopamine neurons.
A Timeline of viral injection, yoked DCZ infusions and electrophysiology. B AAV8-hSyn-DIO-hM4D(Gi)-mCherry [hM4D(Gi)] or AAV8-hSyn-DIO-mCherry (mCherry) was bilaterally microinjected into the VTA of TH-Cre rats. Immunohistochemistry showed that hM4D(Gi) was expressed in the majority of TH+ dopamine neurons (green) but was not expressed in TH- neurons in the VTA of TH-Cre rats (n = 5 rats). C Representative Ih currents recorded from rats that received yoked DCZ infusions expressing mCherry or hM4D(Gi) in VTA dopamine neurons. D Ih amplitude was significantly increased in rats with expressing hM4D(Gi) compared to mCherry at the corresponding hyperpolarization potentials (two-way RM ANOVA, hM4D(Gi), F1,21 = 2.7, p = 0.117; holding potential, F7,147 = 118.2, p < 0.001; hM4D(Gi) ⨯ holding potential interaction, F7,147 = 3.1, p = 0.005; n = 11–12 cells from 4 rats). E Ih current density was significantly increased in hM4D(Gi)-expressing rats compared with mCherry-expressing rats (t-test, t21 = 2.1, p = 0.049, n = 11–12 cells). F, G Yoked DCZ infusions led to a significant depolarizing shift of the V1/2 in hM4D(Gi)-expressing rats compared to mCherry-expressing rats (t-test, t21 = 2.4, p = 0.023, n = 11–12 cells). H Representative temporal summation of evoked EPSPs (50 Hz ⨯ 5) recorded from mCherry and hM4D(Gi)-expressing VTA dopamine neurons in TH-Cre rats that received yoked DCZ infusions. I Compared with mCherry-expressing VTA dopamine neurons, hM4D(Gi)-expressing dopamine neurons exhibited a smaller increase in temporal summation of EPSPs. ZD7288 induced greater increase in temporal summation of EPSPs in hM4D(Gi)-expressing rats (two-way RM ANOVA, hM4D(Gi), F1,11 = 0.004, p = 0.856; ZD7288, F1,11 = 56.1, p < 0.001; hM4D(Gi) ⨯ ZD7288 interaction, F1,11 = 16.4, p = 0.002; n = 6–7 cells from 3 rats). J, K Representative Co-IP reaction was performed using anti-HCN3 (J) or HCN4 (K) antibodies in VTA lysate from rats that expressed mCherry and hM4D(Gi) in VTA dopamine neurons and received yoked DCZ administration. IP, immunoprecipitation; IB, immunoblotting. (HCN3: t-test, t18 = 2.2, p = 0.044, n = 9 and 9. HCN4: t-test, t18 = 2.3, p = 0.034, n = 9 and 9). For the entire figure, *p < 0.05, **p < 0.01, ***p < 0.001.
Fig. 6
Fig. 6. Ivabradine dose-dependently decreased cocaine intake under FR/PR schedules and produced a downward shift of the cocaine dose-response curve.
A Timeline of catheterization, cocaine self-administration and ivabradine treatment. B Intra-VTA infusion of Ivabradine produced a significant downward shift in the number of cocaine infusions on the cocaine dose-response curve (two-way RM ANOVA: Ivabradine, F2,21 = 13.0, p < 0.001; cocaine dose, F6,126 = 22.0, p < 0.001; Ivabradine ⨯ cocaine dose interaction, F6,126 = 2.5, p = 0.005; 25 ng vs 0 ng, red *; 50 ng vs 0 ng, blue *; 25 ng vs 50 ng, red #; n = 8 rats for each group). C Intra-VTA infusion of significantly attenuated the number of cocaine infusions under PR reinforcement conditions (one-way ANOVA, F2,21 = 9.1, p = 0.001, n = 8 rats in each group). D Intra-VTA infusion of significantly attenuated the PR breakpoint (one-way ANOVA, F2,21 = 9.7, p = 0.001, n = 8 rats in each group). E, F Systemic ivabradine administration (0, 3, 10 mg/kg, i.p.) following iv elacridar (5 mg/kg), dose-dependently decreased the mean number of active lever presses (E, one-way ANOVA: F2,23 = 27.3, p < 0.001) and cocaine infusions under an FR2 reinforcement schedule (F, one-way ANOVA: F2,23 = 35.6, p < 0.001) (n = 8 rats in each group). G, H Ivabradine pretreatment produced a significant downward shift in the dose-response curve for cocaine infusions (G, two-way RM ANOVA: ivabradine pretreatment, F2,21 = 16.9, p < 0.001; cocaine dose, F6,126 = 28.0, p < 0.001; ivabradine pretreatment × cocaine dose interaction, F12,126 = 6.3, p < 0.001; 3 vs. 0 mg/kg ivabradine, red *; 10 vs. 0 mg/kg ivabradine, green *; 3 vs. 10 mg/kg ivabradine black #) and decreased total cocaine intake (H, two-way RM ANOVA: ivabradine pretreatment, F2,21 = 5.8, p = 0.010; cocaine dose, F6,126 = 68.7, p < 0.001; ivabradine × cocaine dose interaction, F12,126 = 1.6, p = 0.090; 10 vs. 0 mg/kg ivabradine green *; 3 vs. 10 mg/kg ivabradine red *) on the dose-response curve (n = 8 rats in each group). I, J Ivabradine dose-dependently decreased the number of cocaine infusions (I, one-way ANOVA: F2,23 = 34.2, p < 0.001; n = 8 rats in each group) and breakpoint (J, Brown-Forsythe equal variance: p < 0.05; Kruskal-Wallis one-way ANOVA on ranks: ivabradine, H = 17.6, p < 0.001; n = 8 rats in each group) under a PR reinforcement schedule. *p < 0.05, **p < 0.01, ***p < 0.001; #p < 0.05, ##p < 0.01, ###p < 0.001.

References

    1. Wahl-Schott C, Biel M. HCN channels: structure, cellular regulation and physiological function. Cell Mol Life Sci: CMLS. 2009;66:470–94. - PMC - PubMed
    1. Robinson RB, Siegelbaum SA. Hyperpolarization-activated cation currents: from molecules to physiological function. Annu Rev Physiol. 2003;65:453–80. - PubMed
    1. Wainger BJ, DeGennaro M, Santoro B, Siegelbaum SA, Tibbs GR. Molecular mechanism of cAMP modulation of HCN pacemaker channels. Nature. 2001;411:805–10. - PubMed
    1. Chen S, Wang J, Siegelbaum SA. Properties of hyperpolarization-activated pacemaker current defined by coassembly of HCN1 and HCN2 subunits and basal modulation by cyclic nucleotide. J Gen Physiol. 2001;117:491–504. - PMC - PubMed
    1. Brown HF, DiFrancesco D, Noble SJ. How does adrenaline accelerate the heart? Nature. 1979;280:235–6. - PubMed

MeSH terms

Substances