. 2023 Nov;26(11):1880-1893.
doi: 10.1038/s41593-023-01455-9. Epub 2023 Oct 16.

Spatial transcriptomics reveals the distinct organization of mouse prefrontal cortex and neuronal subtypes regulating chronic pain

Affiliations

Spatial transcriptomics reveals the distinct organization of mouse prefrontal cortex and neuronal subtypes regulating chronic pain

Aritra Bhattacherjee et al. Nat Neurosci. 2023 Nov.

Erratum in

Abstract

The prefrontal cortex (PFC) is a complex brain region that regulates diverse functions ranging from cognition, emotion and executive action to even pain processing. To decode the cellular and circuit organization of such diverse functions, we employed spatially resolved single-cell transcriptome profiling of the adult mouse PFC. Results revealed that PFC has distinct cell-type composition and gene-expression patterns relative to neighboring cortical areas-with neuronal excitability-regulating genes differently expressed. These cellular and molecular features are further segregated within PFC subregions, alluding to the subregion-specificity of several PFC functions. PFC projects to major subcortical targets through combinations of neuronal subtypes, which emerge in a target-intrinsic fashion. Finally, based on these features, we identified distinct cell types and circuits in PFC underlying chronic pain, an escalating healthcare challenge with limited molecular understanding. Collectively, this comprehensive map will facilitate decoding of discrete molecular, cellular and circuit mechanisms underlying specific PFC functions in health and disease.


Conflict of interest statement

J.R.M. is a cofounder of and consultant for Vizgen. The remaining authors declare no competing interests.

Figures
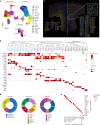
Fig. 1
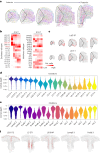
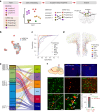
Fig. 1. MERFISH reveals the molecularly diverse cell types and subtypes comprising the PFC and adjoining cortices.
a, UMAP visualization of all cells identified by MERFISH. Cells are color-coded by their identities (number of cells = 487,224). b, Dendrogram showing the hierarchical relationship among all molecularly defined cell subtypes (number of cells = 487,224). The expression of marker genes is shown below. The color represents the normalized expression, and the dot size indicates the percentage of cells expressing each gene. c, Spatial map of all cell subtypes in a represented coronal slice. An enlarged view of a zoom-in region is shown in the top-right inset. d, Pie charts showing the cell proportions of the major cell types (left), excitatory neurons (middle) and inhibitory neurons (right) in PFC. e, Heatmap showing the gene-expression correlation between cell types and subtypes defined by MERFISH and scRNA-seq. scRNA-seq data were downloaded from Allen Brain Atlas, and only cells from PFC were used. Source data
Fig. 2
Fig. 2. Spatial organization of different neuron subtypes in PFC.
a, Coronal MERFISH slices showing the spatial organization of neuron subtypes from anterior to posterior end in PFC and adjacent regions. The dotted lines indicate the PFC region. The color scheme is the same as in Fig. 1c. b, Heatmap showing the proportions of neuron subtypes within PFC from anterior to posterior (A to P) sections in excitatory (left) and inhibitory (right) neurons. c, Spatial organization of L4/5 IT 1 and L5 ET 1 as examples from A to P sections. d,e, Violin plots showing the cortical depth distributions of excitatory neuron subtypes (d) and inhibitory neuron subtypes (e) in PFC (cell number = 121,617). The maximum cortical depth is normalized to 1. f, Spatial location of five representative neuron subtypes (excitatory neuron subtypes: L2/3 IT 2, L5 ET 1, L5/6 NP; and inhibitory neuron subtypes: Lamp5 3 and Pvalb 3) in PFC on a coronal slice. Red dots mark the indicated cell types and gray dots mark the other cells. Source data
Fig. 3
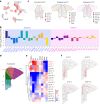
Fig. 3. Distinct neuron subtypes are selectively enriched or depleted in PFC relative to the adjacent cortical regions.
a, UMAP of all MERFISH cells colored by their spatial location whether in or out of PFC (in = 121,617 cells; out = 285,445 cells). b, Barplot showing the log2 of the abundance ratio of subtype neurons in or out of PFC. c, Spatial location of excitatory neuron subtypes enriched (left), depleted (middle) and unbiased (right) distribution in PFC compared with adjacent regions. The dotted line marks PFC in the slice. d, Diagram of anatomical subregions of PFC and adjacent cortical regions. e, The normalized neuron proportion of excitatory subtypes in different anatomical subregions. f, Spatial location of four representative excitatory neuron subtypes on a coronal slice. Red dots represent the indicated subtypes. The dotted lines indicate the anatomical subregions from Allen Brain Atlas CCF v3. Source data
Fig. 4
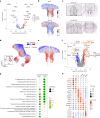
Fig. 4. Genes with expression enriched or depleted in PFC.
a, Volcano plot showing the DEGs that are enriched or depleted in PFC neurons relative to the neurons out of PFC (in = 121,617 cells; out = 285,445 cells). Expression of genes enriched, depleted in PFC, are colored in red and blue dots, respectively (two-sided Wilcoxon test, Bonferroni corrections for multiple comparison; genes with adjusted P < 0.01 and fold change > 1.2 defined significant). b, Spatial gene expression of Nnat (top) and Scn4b (bottom) in all excitatory neurons. The dotted line marks PFC region. c, ISH data from Allen Brain Atlas showing the spatial expression of Nnat and Scn4b in a coronal slice (right) with zoom-in (left). d, UMAP of all MERFISH cells (bottom-left) and excitatory neurons colored by the PFC signature, which is defined as the average expression of top ten enriched genes minus the average expression of top ten depleted genes. e, Aligning the PFC signature onto a representative slice to show the spatial distribution of PFC signature. f, Volcano plot showing the expressions of genes enriched or depleted in PFC after imputing by iSpatial. A total of 20,733 genes are analyzed. Genes analyzed by MERFISH are colored in black, and genes inferred by iSpatial are colored in yellow (two-sided Wilcoxon test, Bonferroni corrections for multiple comparison; genes with adjusted P < 0.01 and fold change > 1.2 defined significant) g, The gene ontology enrichment analysis of genes that are enriched or depleted in PFC (one-sided Fisher’s exact test, Benjamini–Hochberg method for multiple comparison). h, Gene expression enrichment analysis of genes enriched in the different anatomical subregions of PFC and the adjacent cortical regions. Source data
Fig. 5
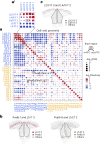
Fig. 5. Cell–cell proximity across all neuronal cell types.
a, Enrichment of cell–cell proximity of different subtypes shown in dot plot (total number of neurons = 32,811). The left half of each dot indicates the cell–cell proximity in PFC and the right half dot indicates that outside the PFC. The color represents log2-transformed observation to expectation of colocalized frequency of the two clusters. The size of dots indicates the significance of the colocalization (a′ shows an enlarged inset highlighting examples of proximities that are different ‘in’ and ‘outside’ of PFC). b, A representative slice showing the cell locations of Pvalb 1 and L5 IT 3 neurons (left), and Pvalb 6 and L5 ET 2 neurons (right). c, A representative slice showing the cell locations of L2/3 IT 3 and L4/5 IT 2 neurons. The dotted lines mark the PFC region. Source data
Fig. 6
Fig. 6. Spatial and molecular organization of PFC projection to the major subcortical targets.
a, Schematics of the strategy for inferring neuronal projection of MERFISH clusters. The MERFISH and scRNA-seq data are integrated into a reduced dimensional space. An SVM is used to predict neuronal projection of the MERFISH neuron subtypes (Methods). b, UMAP visualization of cells derived from MERFISH (9,544 cells) and scRNA-seq (4,294 cells) data after integration. c, The ROC curves show the prediction powers of six projection targets; w/o represents the cells without projection information. d, A coronal slice showing in silico retrograde tracing from six injection sites, labeled by different colors as indicated. e, The inferred projection targets of molecularly defined excitatory neuron subtypes, represented by an alluvial diagram. f, PFC to PAG projection validation. Retrograde mCherry-expressing AAV was injected in PAG—injection scheme cartoon and injection site in PAG are shown (scale bar = 0.5 mm); brain slice of PFC was used for smFISH. mCherry (red) labeled neurons coexpressing the L5 ET 1 marker Pou3f1 (green), arrows in the enlarged image indicate double-labeled neurons. Co-immunostaining for mCherry protein with Pou3f1 RNA-FISH further confirmed extensive colocalization. (scale bars = 20 µm). Bar graph shows the percentage of mCherry positive cells that also express Pou3f1 (mean ± s.e.m., two-tailed t test, n = 4 biologically independent adult male mice, P < 0.001). Majority of mCherry+ neurons are Pou3f1+. Hypo, hypothalamus. Source data
Fig. 7
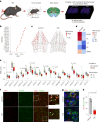
Fig. 7. Chronic pain caused cellular and molecular changes in PFC excitatory neurons.
a, Overview of chronic pain sample preparation. For each MERFISH run, one brain slice from each of the control and pain condition are loaded together to avoid batch effect (n = 3 biologically independent adult male mice per group in sham and SNI, sampled over seven sessions of imaging experiments). b, Transcriptionally perturbed neurons predicted by Augur for each of the excitatory subtypes. AUC shows the area under the ROC curve of the predictions. c, Spatial distribution of cells colored by ARG scores in control and pain conditions. The anatomical subregions of PFC are also shown. d, Heatmap showing ARG score in PFC subregions in pain and control samples (number of neurons in bd, nsham = 17,873, nSNI = 19,392). e, ARG scores of PFC excitatory subtypes in pain and control samples. Paired dots represent the control–pain paired samples, which were imaged together. Color of the paired dots represents the paired mice ID (two-tailed paired t test is used to calculate the P values; n = 3 independent mice per group; the center is the median value, bounds of box indicate the first and third quantile; the minima are defined as the minimum values and the maxima are defined as maximum values within each group). f, smFISH colabeling of cFos and Pou3f1 (L5 ET marker) at high magnification in sham (control) and SNI (chronic pain) conditions. Arrowheads in merged images indicate double positive neurons (scale bars = 20 µm). g, High-resolution images showing localization of cFos and Pou3f1 mRNA molecules within individual neurons in sham and chronic pain (scale bar = 20 µm). h, Barplot showing the percentage of cFos+ cells to Pou3f1+ cells (mean ± s.e.m.; two-tailed Mann–Whitney test; n = 9 biologically independent adult male mice per group; P = 4 × 10−5). Source data
Extended Data Fig. 1
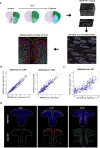
Extended Data Fig. 1. The workflow and quality control for MERFISH profiling.
a, The workflow of MERFISH profiling of mouse PFC, including MERFISH imaging, decoding, segmentation and data analysis. b, Scatterplot showing the spearman correlation of the RNA counts per cell of individual genes measured by MERFISH in two independent experiments. c, Scatterplot of the RNA counts per cell of individual genes measured by MERFISH versus bulk RNA-seq data. The counts are natural logarithms. d, Spatial gene expression of three representative genes detected by MERFISH. In situ hybridization (ISH) data from Allen Brain Atlas are shown at the bottom. Source data
Extended Data Fig. 2
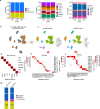
Extended Data Fig. 2. MERFISH and scRNA-seq based clusters are consistent.
a, UMAP showing integration of cells from MERFISH or scRNA-seq data (GSE124952). b,c, UMAP showing the cell clusters defined by scRNA-seq (left) or MERFISH (right). df, Heatmap showing the correspondence between main cell types (d), excitatory (e) and inhibitory (f) subtypes defined by MERFISH and scRNA-seq. g, The cell proportions of the excitatory, inhibitory and non-neuronal cells from scRNA-seq or MERFISH. (Cell numbers for analyses in this figure, MERFISH = 121617, scRNAseq = 24822). Source data
Extended Data Fig. 3
Extended Data Fig. 3. The marker gene expression in the different neuronal subtypes.
a,b, Dot plot presentation for the top three marker genes for each of the excitatory (a) (Cell number = 247098) and inhibitory (b) (Cell number = 51794) neuron subtypes. Source data
Extended Data Fig. 4
Extended Data Fig. 4. Single molecule FISH validates expression of inhibitory neuron markers and their overlap with several subtype-specific markers in PFC.
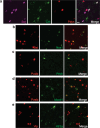
a,b, smFISH for subtype-specific markers of Sst neurons. c,d, smFISH for subtype specific markers of Pvalb. e, Subtype specific marker that distinguishes the two identified Vip clusters. (Stains independently repeated 2 to 3 times). Scale bar for the figure in a = 20µm.
Extended Data Fig. 5
Extended Data Fig. 5. Comparative analysis between our dataset and those of published MERFISH dataset.
a, Proportions of major cells types in ours compared with those in published papers. b, Heatmap showing the gene-expression correlation between cell types and subtypes defined in our study and those in published studies. (Cell numbers = motor cortex 23868; PFC_aging 185216; human_MTG 4321; human_STG 4871). Source data
Extended Data Fig. 6
Extended Data Fig. 6. Spatial distribution of molecularly defined excitatory neuron subtypes along the anterior to posterior axis.
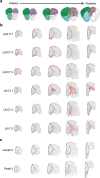
a, Schematics of coronal brain slices aligned to Allen Brain Atlas CCF-v3 from anterior to posterior sections. b, Spatial organization of the indicated representative excitatory neuron subtypes across anterior to posterior sections. c, Spatial organization of the indicated representative inhibitory neuron subtypes across anterior to posterior sections.
Extended Data Fig. 7
Extended Data Fig. 7. Spatial location of all molecularly defined PFC cell types and subtypes.
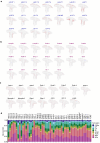
a, Excitatory neuron subtypes; b, inhibitory neuron subtypes; c, non-neuron cell types and subtypes. Red dots represent the indicated cell types and subtypes. d, The proportion of cell numbers from different PFC subregions and adjacent cortical regions of all neuron and non-neuron subtypes. Source data
Extended Data Fig. 8
Extended Data Fig. 8. Specific gene expression signatures of PFC and PFC subregions.
a,b, Spatial expression of representative genes enriched (Cacna1h, Cxcl12, Cdh13) or depleted (Abcd2) in PFC relative to adjacent cortical regions. Inferred expression by iSpatial is shown in b. Only excitatory neurons are shown. Corresponding ISH data from Allen Brain Atlas are shown on the right. Dotted line marks PFC region. c, Ingenuity pathway analysis (IPA) of the genes, identified after imputation, showing enriched or depleted in PFC. The red/blue bars indicate the pathway more active in/out PFC, respectively (p-values were calculated by One-sided Fisher′s Exact Test without adjustments for multiple comparison). d, The inferred spatial gene expression by iSpatial of four representative genes enriched in PFC subregions. A diagram of anatomical subregions in PFC and adjacent regions is shown on the left. Only the excitatory neurons are shown. ISH data from Allen Brain Atlas are shown on the right. Dotted line marks PFC subregion. Source data
Extended Data Fig. 9
Extended Data Fig. 9. Integrated MERFISH and scRNA-seq data to predict neuronal projections.
a, UMAP showing integration of cells from scRNA-seq (left) and MERFISH (right). The colors represent the projection sites in scRNA-seq data and the excitatory subtype in MERFISH data, respectively. b, Spatial location of neurons projecting to six different brain regions. c, Amygdala projection validation: mCherry expressing retrograde AAV was injected in amygdala (injection site shown) (scale = 0.5mm). Brain slice of PFC were stained with DAPI and mCherry to image the labeled neurons. smFISH co-labeling of mCherry with Pou3f1 (L5 ET marker), or Foxp2 (L6 CT marker) reveal partial overlap with both neuron subtypes. (Stains independently repeated 3 times). Arrows in enlarged images indicate dual labeled cells (scale bar = 20µm). d, High resolution images showing smFISH co-labeling of mCherry with Foxp2 and Pou3f1 within individual neurons (scale bar = 20µm).
Extended Data Fig. 10
Extended Data Fig. 10. Pain model: Behavior, MERFISH and smFISH measurements.
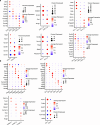
a, Von Frey testing reveals chronic mechanical allodynia induced by SNI surgery during the 6 weeks testing period (n = 6 biologically independent adult male mice per group, sham and SNI, measured weekly for 6 weeks). b, UMAP visualization of cells from control and pain samples. Left panel: all cells from both groups combined; Right panel: separate view of the control and pain. c, Heatmap showing the gene expression correlation of the cell types between control and pain. d, The numbers of differentially expressed genes in the indicated neuron subtypes when compared pain and control samples. The numbers of up-regrated and down-regulated genes are colored in red and blue, respectively. e, Comparison of ARG scores between the two hemispheres of PFC in each mouse (two-tailed paired t-test is used to calculate the p-value; n = 3 biologically independent mice per group; the center is the median value, bounds of box indicate the first and third quantile; the minima are defined as the minimum values and the maxima are defined as maximum values within each group. Cell numbers, sham = 17873, SNI = 19392). f, Global overview of PFC in half coronal section with Fos smFISH (red) in Sham (Control) and chronic pain conditions (scale bar = 100µm). g, Npas4 and h, Arc expression is reduced across PFC in chronic pain relative to control and is significantly lower in Pou3f1+ neurons. (mean ± SEM; Mann-Whitney test; n = 8 biologically independent adult male mice per group of sham and SNI; Npas4, p = 0.0002; Arc, p = 0.004). (scale bar in g = 20µm, for g and h). Source data

References

    1. Miller, E. K. & Cohen, J. D. An integrative theory of prefrontal cortex function. Annu. Rev. Neurosci.24, 167–202 (2001). - PubMed
    1. Lui, J. H. et al. Differential encoding in prefrontal cortex projection neuron classes across cognitive tasks. Cell184, 489–506 (2021). - PMC - PubMed
    1. Gamo, N. J. & Arnsten, A. F. Molecular modulation of prefrontal cortex: rational development of treatments for psychiatric disorders. Behav. Neurosci.125, 282–296 (2011). - PMC - PubMed
    1. Chini, M. & Hanganu-Opatz, I. L. Prefrontal cortex development in health and disease: lessons from rodents and humans. Trends Neurosci.44, 227–240 (2021). - PubMed
    1. Tan, L. L. & Kuner, R. Neocortical circuits in pain and pain relief. Nat. Rev. Neurosci.22, 458–471 (2021). - PubMed