. 2023 Oct 16;15(1):83.
doi: 10.1186/s13073-023-01241-z.

Single-cell RNA sequencing distinctly characterizes the wide heterogeneity in pediatric mixed phenotype acute leukemia

Affiliations

Single-cell RNA sequencing distinctly characterizes the wide heterogeneity in pediatric mixed phenotype acute leukemia

Hope L Mumme et al. Genome Med. .

Abstract

Background: Mixed phenotype acute leukemia (MPAL), a rare subgroup of leukemia characterized by blast cells with myeloid and lymphoid lineage features, is difficult to diagnose and treat. A better characterization of MPAL is essential to understand the subtype heterogeneity and how it compares with acute myeloid leukemia (AML) and acute lymphoblastic leukemia (ALL). Therefore, we performed single-cell RNA sequencing (scRNAseq) on pediatric MPAL bone marrow (BM) samples to develop a granular map of the MPAL blasts and microenvironment landscape.

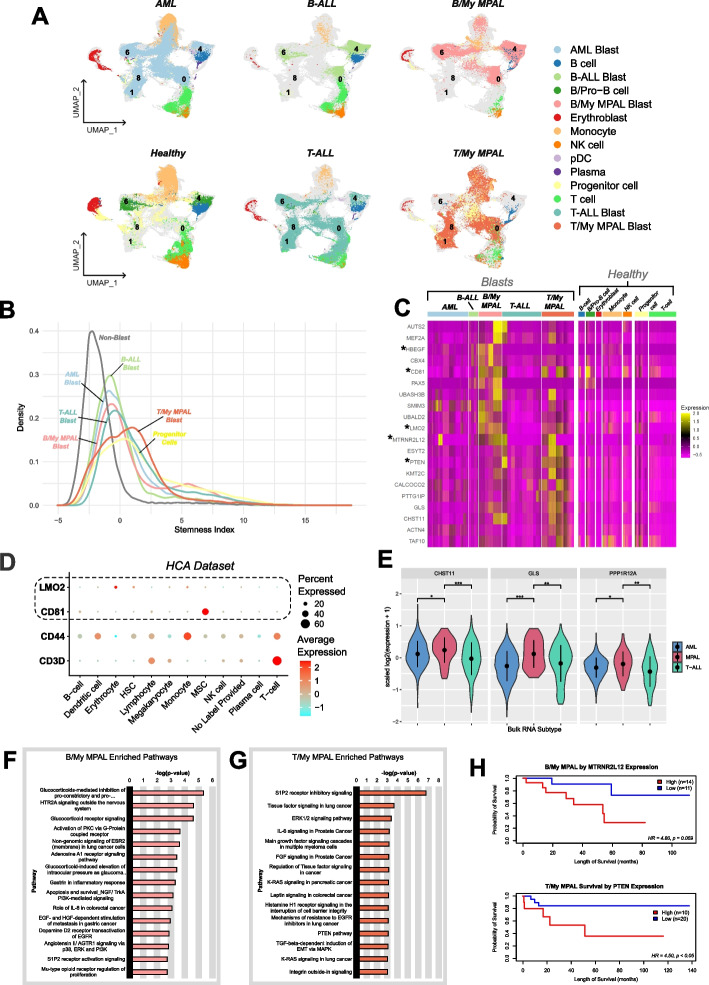
Methods: We analyzed over 40,000 cells from nine pediatric MPAL BM samples to generate a single-cell transcriptomic landscape of B/myeloid (B/My) and T/myeloid (T/My) MPAL. Cells were clustered using unsupervised single-cell methods, and malignant blast and immune clusters were annotated. Differential expression analysis was performed to identify B/My and T/My MPAL blast-specific signatures by comparing transcriptome profiles of MPAL with normal BM, AML, and ALL. Gene set enrichment analysis (GSEA) was performed, and significantly enriched pathways were compared in MPAL subtypes.

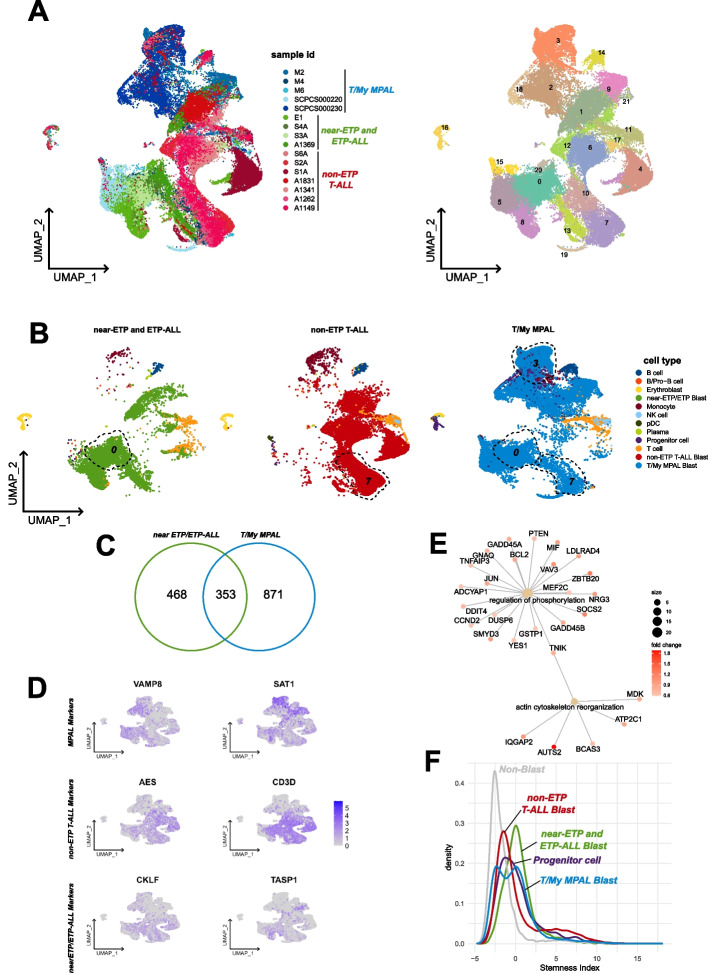
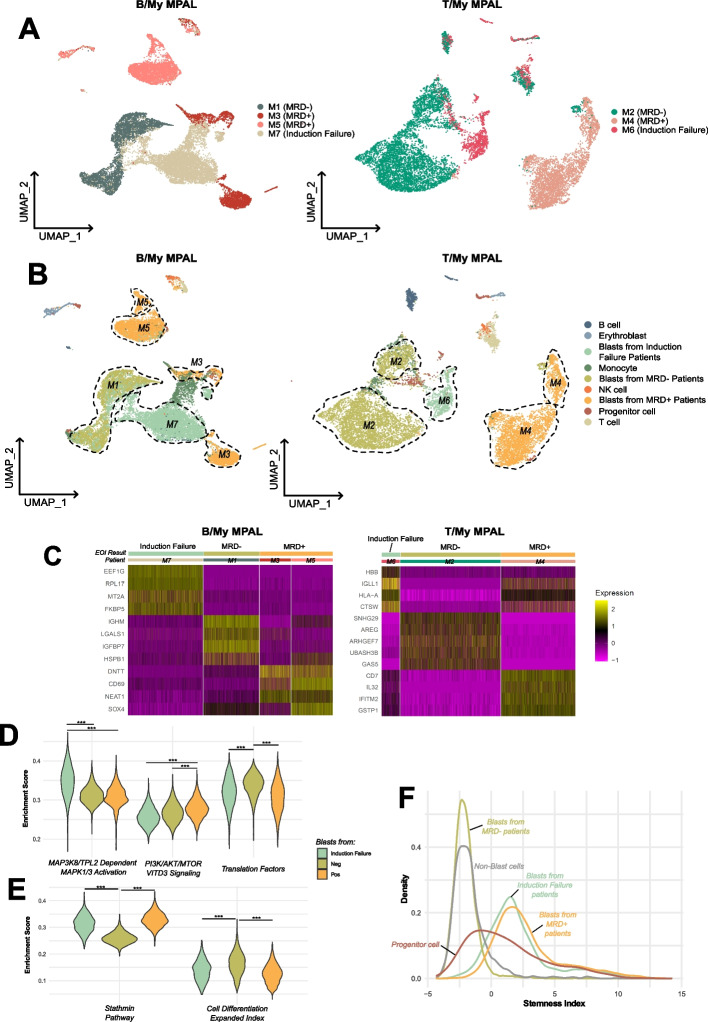
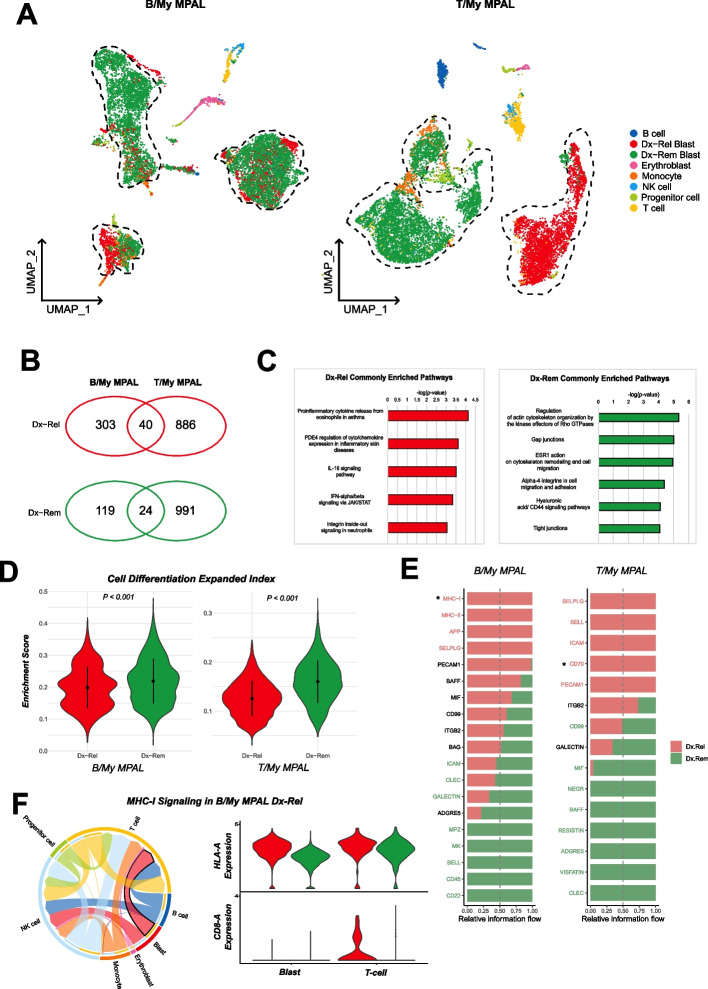
Results: B/My and T/My MPAL blasts displayed distinct blast signatures. Transcriptomic analysis revealed that B/My MPAL profile overlaps with B-ALL and AML samples. Similarly, T/My MPAL exhibited overlap with T-ALL and AML samples. Genes overexpressed in both MPAL subtypes' blast cells compared to AML, ALL, and healthy BM included MAP2K2 and CD81. Subtype-specific genes included HBEGF for B/My and PTEN for T/My. These marker sets segregated bulk RNA-seq AML, ALL, and MPAL samples based on expression profiles. Analysis comparing T/My MPAL to ETP, near-ETP, and non-ETP T-ALL, showed that T/My MPAL had greater overlap with ETP-ALL cases. Comparisons among MPAL subtypes between adult and pediatric samples showed analogous transcriptomic landscapes of corresponding subtypes. Transcriptomic differences were observed in the MPAL samples based on response to induction chemotherapy, including selective upregulation of the IL-16 pathway in relapsed samples.

Conclusions: We have for the first time described the single-cell transcriptomic landscape of pediatric MPAL and demonstrated that B/My and T/My MPAL have distinct scRNAseq profiles from each other, AML, and ALL. Differences in transcriptomic profiles were seen based on response to therapy, but larger studies will be needed to validate these findings.

Keywords: Mixed phenotype acute leukemia; Single-cell RNA sequencing; Tumor microenvironment.


Conflict of interest statement

MB serves on the board of Canomiks Inc. as chief scientific advisor and has equity in it. DKG and DD hold equity in Meryx Inc. SSB serves as CEO of Anxomics LLC and has equity in it. The remaining authors declare no other competing interests.

Figures

Fig. 1
Fig. 1
Comparative analysis of mixed phenotype acute leukemia (MPAL) samples single-cell landscape with healthy bone marrow (BM). A UMAP showing the profile of MPAL and healthy samples (n = 67,024 cells), colored based on the individual sample. B Dot plot showing expression of canonical cell markers used to annotate clusters on the X-axis and final cell type labels on the Y-axis. C Split UMAP based on clinical groups (i.e., B/My MPAL, T/My MPAL, Healthy) to visualize cellular clusters associated with specific clinical groups. Dotted lassos highlight the locations of the immune cell populations. D UMAP highlighting the heterogenous blast populations from selected patients. The cell types from M2 (T/My MPAL) and M3 (B/My MPAL) are highlighted on the UMAP. The major blast populations are shown (lassoed) for each sample: M2-My and M2-T, and M3-My and M3-B. E Table and bar plot with cell type distributions, disease subtype, MRD status after treatment, and clinical outcomes. F Heatmap showing top 20 overexpressed genes in B/My MPAL and T/My MPAL blast cells. DEGs were identified by comparing the profile of B/My or T/My MPAL blast cells and healthy immune cells based on fold change and adjusted P-values (i.e., average log2FC > 0.25 and adjusted p-value < 0.05). The top 20 genes were selected based on the highest fold change. G Gene ontology enrichment results for the overexpressed genes (average log2FC > 0.25 and adjusted p-value < 0.05) in MPAL blasts compared to progenitor cells in healthy BM samples. The gene ontology analysis was performed using clusterProfiler package from R/Bioconductor using Biological Process GO categories. The Biological Process with Benjamini–Hochberg p-value < 0.05 is considered significant. The X-axis represents the GeneRatio, which indicates the fraction of MPAL significantly overexpressed genes that can be found in biological gene sets (specifically, GO categories). The size of each dot corresponds to the count of input genes that are present in a particular GO biological category. The color of the dot reflects the adjusted p-value obtained from the enrichment analysis. Specifically, pink and blue colors are used to represent the most and least significantly enriched GO terms associated with MPAL significantly overexpressed genes, respectively. H Macrophage migration inhibitory factor (MIF) signaling in T/My and B/My MPAL cell types. Signaling was inferred using cellular communication analysis, showing the estimated interactions between cell types in MPAL samples via the ligand (MIF) and receptors (CD74, CXCR4, CD44) expression
Fig. 2
Fig. 2
Comparative analysis of mixed phenotype acute leukemia with other acute leukemias. A Split UMAP of leukemic and canonical cell types (n = 156,489 cells), separated based on leukemia type/subtype (i.e., AML, B-ALL, T-ALL, B/My MPAL, and T/My MPAL) and healthy samples. B Density plot showing stemness index distribution of the different blast cells from different acute leukemias including B/My MPAL and T/My MPAL, progenitor cells, and normal immune cells. The stemness index was calculated as the first principal component value of each cell after performing principal component analysis with the expression of the genes in a stem cell signature (Additional file 1: Table S3). C Heatmap with the top overexpressed markers for mixed phenotype acute leukemia (MPAL) and subtypes (i.e., B/My MPAL and T/My MPAL). The heatmap also shows the expression of MPAL marker genes in other acute leukemias (i.e., AML, B-ALL, T-ALL), (BM) and healthy immune cells. These markers were filtered to only include genes with low expression in healthy bone marrow cells. Overexpressed genes were identified for MPAL subtypes by comparing the profile of MPAL blast cells versus blast cells from other acute pediatric leukemias (i.e., AML, B-ALL, T-ALL) and healthy BM samples. The MPAL subtype significantly overexpressed genes (average log2FC > 0.25, adjusted p-value < 0.05, and pct. expressed > 50%) were further refined by selecting genes with low expression in healthy BM cells from HCA (avg. expression < 0.5). Finally, the top genes for the heatmap were chosen based on their highest average log2FC values. D Dot plots showing the expression of two canonical immune cell markers (CD79A and CD3D) and two MPAL blast cell markers (CD81 and LMO2), to show that these MPAL blast cells markers have low expression in various normal BM cell types and healthy hematopoietic stem cells. The size of the dots refers to the percentage of cells in each cell type cluster expressing the gene and the color represents averaged scaled gene expression level; cyan: low, red: high. X-axis is the cell type, and Y-axis is the genes. The expression of MPAL markers is marked with lasso. E Expression of MPAL blast markers in AML, T-ALL, and MPAL bulk RNA-seq data. The Y-axis shows the scaled values of the log2 of the normalized expression plus one, and the X-axis shows different subtypes for the bulk RNA-seq samples. Wilcoxon rank tests were performed to test the difference in expression between MPAL and AML, and MPAL and T-ALL for the three genes shown (*** for p-value < 0.001, ** for p-value < 0.01, and * for p-value < 0.05). F The top significantly enriched pathways of the filtered B/My MPAL blast cell marker genes. Each bar represents a significantly enriched pathway as determined using the P value (shown on the primary X-axis). The bar plot is sorted by the negative log of the hypergeometric distribution-based p-values of the results. The analysis for canonical pathways was performed using the MetaCore platform from Clarivate Inc. G The top significantly enriched pathways of the filtered T/My MPAL blast cells marker genes. H Kaplan–Meier curves-based survival association analysis of B/My MPAL marker gene, MTRNR2L12 in B/My MPAL TARGET samples (top) and T/My MPAL marker, PTEN in T/My MPAL TARGET samples (bottom). Survival association analysis was performed using the Cox Proportional Hazards Regression Model, with MTRNR2L12 expression having a hazard ratio of 4.80 (p = 0.059) and PTEN expression having a hazard ratio of 4.50 (p = 0.04), high expression of both genes indicated an association with poor survival
Fig. 3
Fig. 3
Mapping the single-cell landscape of early T-cell precursor acute lymphoblastic leukemia (ETP-ALL). A UMAP clusters of 50,907 cells colored based samples and different ALL (left) including T/myeloid mixed phenotype acute leukemia (T/My MPAL), near-ETP/ETP-ALL, and non-ETP T-ALL. The right side is the UMAP colored by clusters obtained based on K-mean clustering using the Seurat package. B Cell type annotations for the three T-Lineage subtypes shown on UMAPs. Clusters with the overlap of cells and transcriptome profiles among different T-ALL subtypes have been lassoed and labeled. C Venn diagram analysis to visualize commonly overexpressed genes (average log2FC > 0.25, adjusted p-value < 0.05) in T/My MPAL compared to non-ETP T-ALL blast cells, and near-ETP/ETP-ALL compared to non-ETP T-ALL blast cells. D Feature map of selected T/My MPAL, non-ETP T-ALL, and near-ETP/ETP-ALL blast cells overexpressed genes. Low and high expressions are shown with gray and purple colors respectively. E Gene network plot for enriched GO categories associated with overexpressed near-ETP/ETP-ALL genes. The network nodes have been colored based on fold change in near-ETP/ETP-ALL, and the size of the central dots represents the size of the selected GO category. F Density plot showing stemness index distribution of blast cells T/My MPAL, near-ETP/ETP-ALL, non-ETP T-ALL, and non-blast immune cells. The stemness index was calculated as the first principal component value of each cell after performing principal component analysis with the expression of the genes in a stem cell gene set as the features (Additional file 1: Table S3)
Fig. 4
Fig. 4
Comparative analysis of pediatric and adult mixed phenotype acute leukemia single-cell landscape. A Split UMAP plots of B/My MPAL and T/My MPAL colored based on the respective patient samples. The adult MPAL samples are represented in shades of blue and green, while the pediatric are depicted in shades of red and pink. B Comparative visualization of malignant blasts and normal microenvironment cell types in the adult, pediatric, and healthy samples. C Heatmap of top genes overexpressed in adult vs. pediatric MPAL blast cells. Genes were identified by performing differential expression analysis selecting genes with average log2FC > 0.25 and adjusted p-value < 0.05. The top genes for the heatmap were selected based on average log2FC. Relative gene expression is shown in pseudo color, where purple represents downregulation, and yellow represents upregulation. D Density plot showing the distribution of stemness index of different adult and pediatric MPAL subtypes and normal cells. Density plot showing stemness index distribution of the different cell types found in T/My MPAL samples. The stemness index was calculated as the first principal component value of each cell after performing principal component analysis with the expression of the genes in a stem cell gene set as the features (Additional file 1: Table S3). E Selected gene sets with significantly higher enrichment (p-value < 0.001) in adult T/My MPAL blast cells. F Gene sets with higher enrichment (p-value < 0.001) in pediatric versus adult T/My MPAL blast cells. The enrichment score was calculated using a single-sample gene set enrichment approach using Hallmark/Biocarta gene sets from the MSigDb H and C2 collections and the significance of differential enrichment was determined using the Wilcoxon rank-sum test
Fig. 5
Fig. 5
Comparison of the single-cell landscape of diagnosis MPAL samples based on induction outcomes. A UMAP plot of B/My (n = 17,258 cells) and T/My (n = 11,031 cells) MPAL patient cells colored by patient IDs, with the end of induction outcome (MRD + , MRD − , induction failure) information shown in the legend. B UMAP plots of B/My and T/My MPAL patient cells colored based on cell type including malignant blast (Blast cells from MRD + , MRD − , and induction failure patients) and normal cells (B-cells, T-cells, NK cells, Progenitor cells, monocytes, erythroblasts). C Heatmap showing top overexpressed genes in B/My MPAL and T/My MPAL blast cells from patients with different induction outcomes (induction failure, MRD + , and MRD −). The markers for the end of induction outcome group blasts were identified by comparing the target group’s blast cells with the other groups’ blast cells and filtered based on fold change, multiple test corrected p-value, and % expression (average log2FC > 0.25, adjusted p value < 0.05, pct. > 0.7). D Violin plots showing gene set enrichment values for different Biocarta and Reactome gene sets in B/My MPAL induction outcome blast groups calculated using single-sample gene set enrichment analysis. The significance between groups was calculated with Wilcoxon rank tests, with p-value < 0.001 represented with “***”. E Violin plots showing gene set with significantly different enrichments in T/My MPAL induction outcome groups. The significance between groups was calculated using Wilcoxon rank tests, with p-value < 0.001 represented with “***.” F Density plot showing stemness index distribution of the different cell types found in T/My MPAL samples. The stemness index was calculated as the first principal component value of each cell after performing principal component analysis with the expression of the genes in a stem cell gene set as the features (Additional file 1: Table S3). Populations of interest are shown in bolder lines and labeled
Fig. 6
Fig. 6
Exploratory analysis on T/My and B/My MPAL samples with relapse depicted differences in transcriptome profiles in comparison to samples with remission. A UMAP of Dx B/My MPAL cells (n = 10,591) annotated based on future clinical outcomes: relapse (Dx-Rel) or remission (Dx-Rem). The normal cells were annotated based on canonical markers (Fig. 1b). The B/My MPAL cells depict some overlapping Dx-Rem and Dx-Rel single-cell profiles on the unsupervised analysis. UMAP of Dx T/My MPAL cells (n = 11,031 cells) showing unique profile for Dx-Rel and Dx-Rem blasts with no overlap. B Venn diagram showing genes that are associated with MPAL remission or relapse in B/My and T/My MPAL. These genes were identified by comparing each subtype’s Dx-Rel and Dx-Rem blast cells profile and selecting significantly differentially expressed genes based on average log2FC > 0.25, and adjusted p-value < 0.05). The analysis identified 40 and 24 genes that are commonly upregulated in relapse and remission respectively at diagnosis. C Gene sets that are significantly associated with relapse (left) and remission (right) in MPAL at diagnosis. D Gene set enrichment analysis on the Dx-Rel and Dx-Rem blast cells in each MPAL subtype. The cell differentiation expanded index gene set depicted differential enrichment (Wilcoxon ranked test p-value < 0.05) between Dx-Rel and Dx-Rem blasts in both MPAL subtypes. E Cellular communication analysis based on ligand and receptor expression was performed to identify differences between remission and relapse outcomes at diagnosis. The pathways with significantly different information flow between remission and relapse (at Dx) B/My and T/My MPAL samples have been plotted as bar graphs. The information flow represents the sum of the communication probabilities of all cell types for the particular signaling pathway, and pathway names colored in pink and green representing enrichment for the Dx-Rel and Dx-Rem outcomes. F A chord diagrams for MHC-I signaling in Dx-Rel B/My MPAL cells. The left diagram shows the signaling between different cell types, from senders to receivers. The right diagram highlights the expression of ligand-receptor pairs estimated to interact between blasts and T-cells (green color represents Dx-Rem and red color represents Dx-Rel)

References

    1. Alexander TB, Orgel E. Mixed phenotype acute leukemia: current approaches to diagnosis and treatment. Curr Oncol Rep. 2021;23(2):22. doi: 10.1007/s11912-020-01010-w. - DOI - PubMed
    1. Maruffi M, Sposto R, Oberley MJ, Kysh L, Orgel E. Therapy for children and adults with mixed phenotype acute leukemia: a systematic review and meta-analysis. Leukemia. 2018;32(7):1515–1528. doi: 10.1038/s41375-018-0058-4. - DOI - PMC - PubMed
    1. Raikar SS, Park SI, Leong T, Jaye DL, Keller FG, Horan JT, et al. Isolated myeloperoxidase expression in pediatric B/myeloid mixed phenotype acute leukemia is linked with better survival. Blood. 2018;131(5):573–577. doi: 10.1182/blood-2017-09-807602. - DOI - PubMed
    1. Hrusak O, de Haas V, Stancikova J, Vakrmanova B, Janotova I, Mejstrikova E, et al. International cooperative study identifies treatment strategy in childhood ambiguous lineage leukemia. Blood. 2018;132(3):264–276. doi: 10.1182/blood-2017-12-821363. - DOI - PubMed
    1. Khoury JD, Solary E, Abla O, Akkari Y, Alaggio R, Apperley JF, et al. The 5th edition of the World Health Organization Classification of haematolymphoid tumours: myeloid and histiocytic/dendritic neoplasms. Leukemia. 2022;36(7):1703–19. - PMC - PubMed

Publication types

MeSH terms