

CCR4-NOT differentially controls host versus virus poly(a)-tail length and regulates HCMV infection
- PMID: 37846490
- PMCID: PMC10702830
- DOI: 10.15252/embr.202256327
CCR4-NOT differentially controls host versus virus poly(a)-tail length and regulates HCMV infection
Abstract
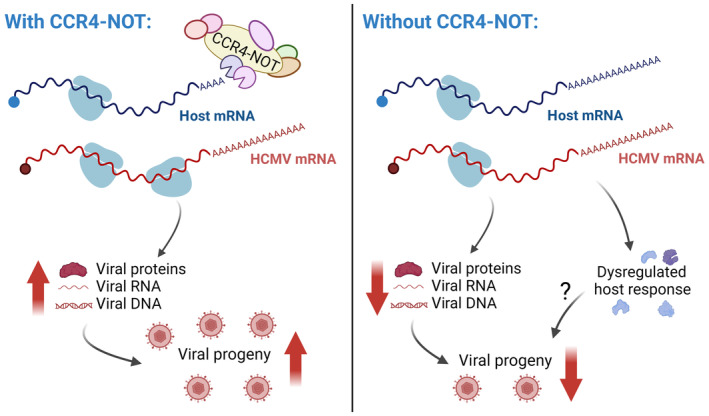
Unlike most RNA and DNA viruses that broadly stimulate mRNA decay and interfere with host gene expression, human cytomegalovirus (HCMV) extensively remodels the host translatome without producing an mRNA decay enzyme. By performing a targeted loss-of-function screen in primary human fibroblasts, we here identify the host CCR4-NOT deadenylase complex members CNOT1 and CNOT3 as unexpected pro-viral host factors that selectively regulate HCMV reproduction. We find that the scaffold subunit CNOT1 is specifically required for late viral gene expression and genome-wide host responses in CCR4-NOT-disrupted cells. By profiling poly(A)-tail lengths of individual HCMV and host mRNAs using nanopore direct RNA sequencing, we reveal poly(A)-tails of viral messages to be markedly longer than those of cellular mRNAs and significantly less sensitive to CCR4-NOT disruption. Our data establish that mRNA deadenylation by host CCR4-NOT is critical for productive HCMV replication and define a new mechanism whereby herpesvirus infection subverts cellular mRNA metabolism to remodel the gene expression landscape of the infected cell. Moreover, we expose an unanticipated host factor with potential to become a therapeutic anti-HCMV target.
Keywords: CCR4-NOT; HCMV; RNA decay; deadenylation; virus:host interaction.
© 2023 The Authors. Published under the terms of the CC BY 4.0 license.
Conflict of interest statement
The authors declare that they have no conflict of interest.
Figures
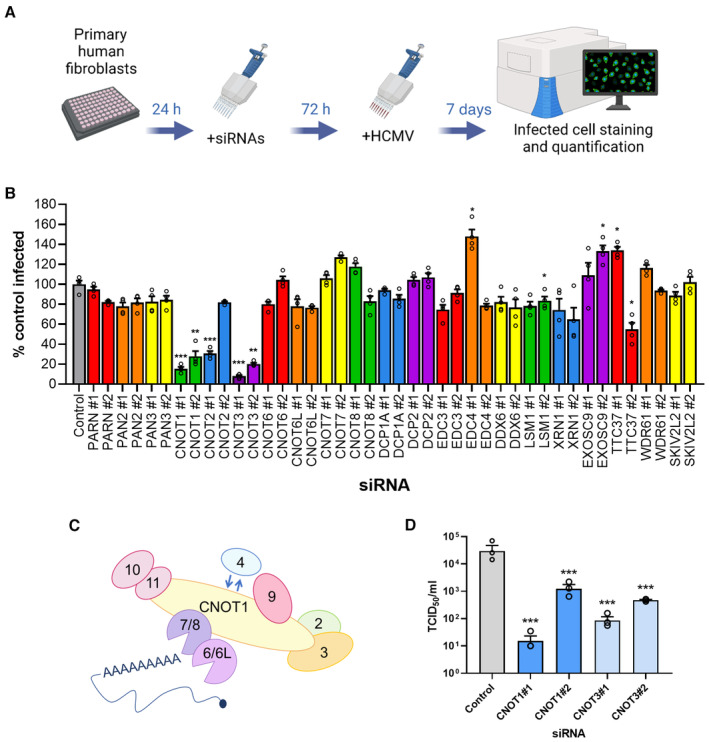
Experimental set up for siRNA screen. Normal human dermal fibroblasts (NHDFs) were transfected at 20 nM with two independent siRNAs targeting each of 20 genes in 96‐well plates. Cells were subsequently infected with HCMV (AD169) at low MOI (0.05) and cells fixed 7 days post infection. Cells were identified by DAPI nuclear staining, and HCMV‐positive cells were identified by immunostaining for immediate early proteins and quantified in each entire well using high content imaging (Thermofisher CellInsight CX7 LZR).
Screen results showing mean % infected cells (±SEM) of four biological experiments with technical duplicates, normalized to control siRNA treated cells. Statistical significance was established by ANOVA test with Dunnett multiple comparison correction compared with control siRNA, (*) P < 0.033, (**) P < 0.002, (***) P < 0.001, no asterisk: not significant.
Schematic of human CCR4‐NOT complex.
The impact of CNOT1 and CNOT3 depletion on released infectious viral titer was determined by replicating experimental conditions in (B) in 12‐well plates and establishing TCID50 from culture supernatants on NHDF cells, plotted as the mean ± SEM (n = 3 biological replicates). Statistical significance established by ANOVA test with Dunnett multiple comparison correction compared with control siRNA, (***) P < 0.001.
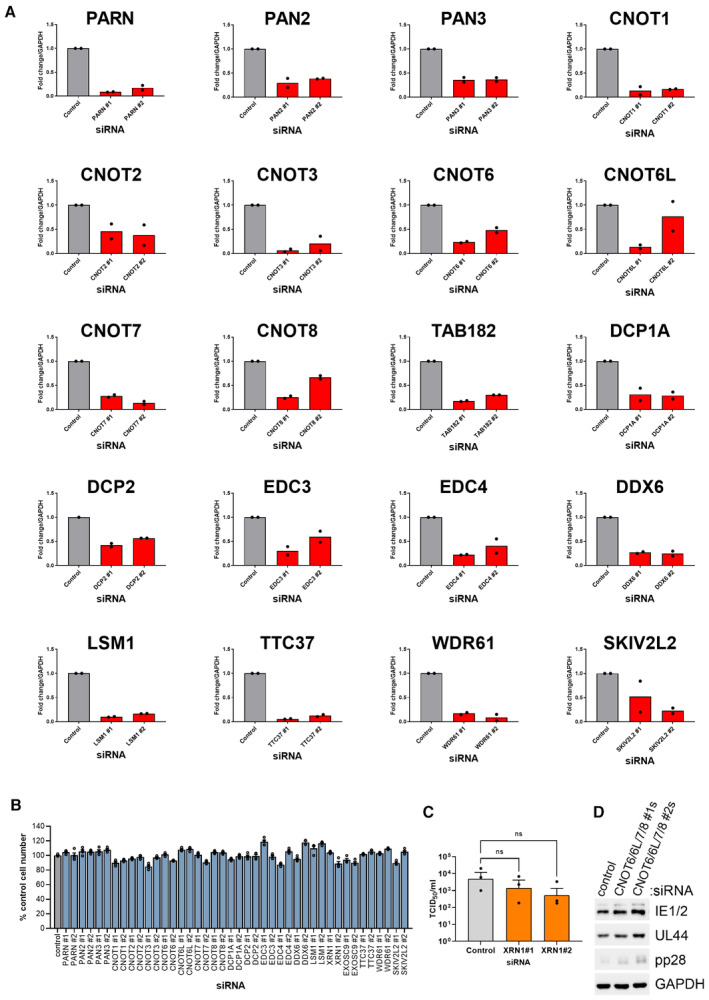
Target depletion for each siRNA was assessed by qRT‐PCR. NHDF cells were transfected with 20 nM of either the nonsilencing control or the targeting siRNA as indicated and RNA isolated for analysis at 72 h post‐transfection. n = 2 biological replicates.
Cell viability following transfection with each mini‐screen siRNA was assessed by quantifying cell number by DAPI nuclear staining and high content imaging at 72 h post‐transfection. Each experiment was conducted 3 times with internal duplicates, normalized to control siRNA‐treated cells and plotted as the mean ± SEM.
The impact of Xrn1 depletion on released infectious viral titer was determined by replicating experimental conditions in (Fig 1B) in 12‐well plates and establishing TCID50 from culture supernatants on NHDF cells, plotted as the mean ± SEM (n = 3 biological replicates). Statistical significance established by ANOVA test with Dunnett multiple comparison correction compared with control siRNA (ns) P > 0.033.
NHDFs were transfected with siRNAs (#1 or #2) targeting each CCR4‐NOT nuclease at 20 nM each or control siRNA at 80 nM. Cells were subsequently infected with HCMV (AD169) at low MOI (0.05). Protein lysates were collected at 7 DPI at immunoblotted for viral proteins and a loading control (GAPDH) as indicated.
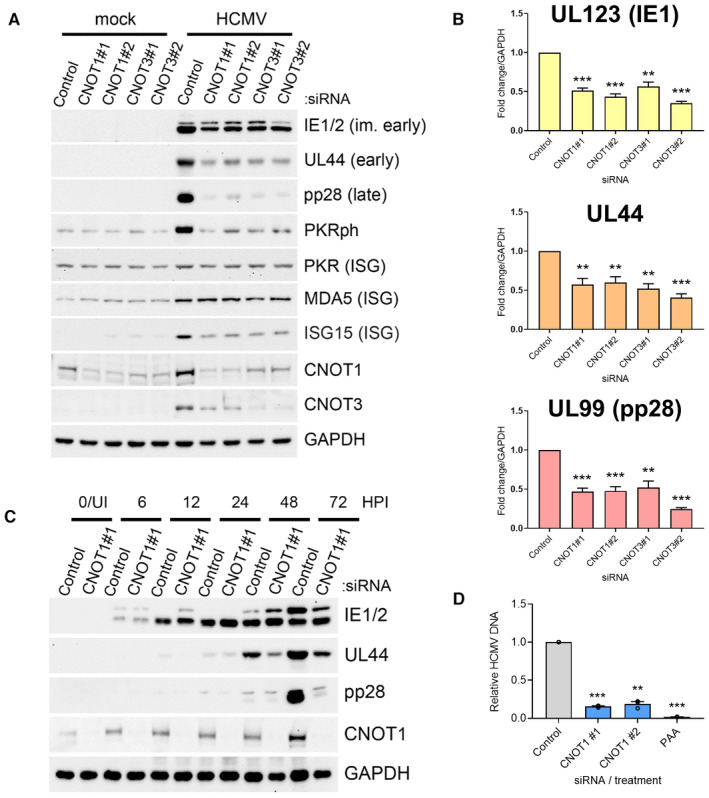
Immunoblot analysis of lysates from NHDF cells transfected with the indicated siRNAs and infected with HCMV AD169 at MOI = 3, collected at 72 HPI. Lysates were probed for representative viral proteins from each temporal expression class, select ISGs (MDA5, ISG15, PKR) and activated T446‐phosphorylated PKR (PKRph) and GAPDH.
RT‐qPCR analysis for viral mRNAs from RNA isolated from cells treated and infected as in (A). Protein names, where different from gene names, indicated in brackets. Mean ± SEM (n = 6 biological replicates) is plotted with statistical significance established by ANOVA test with Dunnett multiple comparison correction compared with control siRNA; (**) P < 0.002, (***) P < 0.001.
Immunoblot analysis of lysates from NHDF cells transfected with control or CNOT1 siRNAs and infected with HCMV AD169 at MOI = 3 collected at the indicated times post infection. Lysates were probed for representative viral proteins indicated, CNOT1 to confirm knockdown and a cellular loading control (GAPDH).
NHDFs transfected with control or CNOT1‐specific siRNAs were infected with HCMV AD169 at MOI = 3, as in (A). At 72 hpi, total DNA was collected and HCMV DNA abundance was quantified by qPCR. Untransfected cells were treated in parallel with viral DNA polymerase inhibitor PAA after virus inoculation as a control. Mean ± SEM (n = 3 biological replicates) is plotted with statistical significance established by ANOVA test with Dunnett multiple comparison correction compared with control siRNA; (**) P < 0.002, (***) P < 0.001.
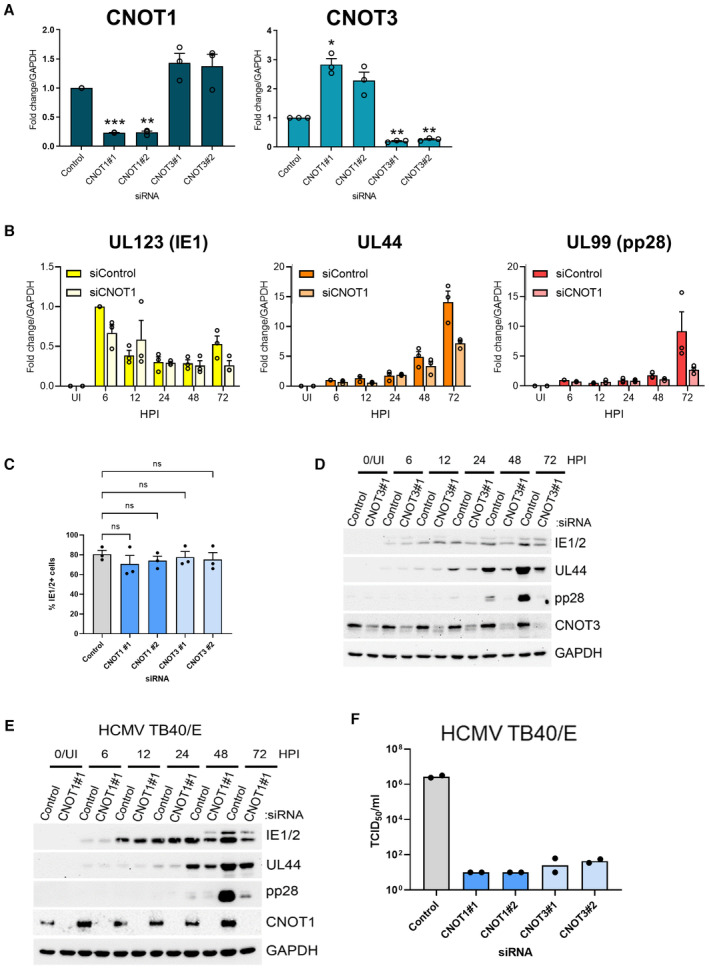
RT‐qPCR analysis for CNOT1 and CNOT3 mRNAs from RNA isolated from uninfected cells treated as in Fig 2A. Mean fold changes relative to GAPDH ± SEM (n = 3 biological replicates) are plotted with statistical significance established by ANOVA test with Dunnett multiple comparison correction compared control siRNA treated samples; (*) P < 0.033, (**) P < 0.002, (***) P < 0.001, no asterisk: not significant.
RT‐qPCR analysis for viral mRNAs from RNA isolated from cells siRNA‐transfected and infected with HCMV AD169 as in Fig 2C. Protein names, where different from gene names, indicated in brackets. Mean fold changes relative to GAPDH ± SEM (n = 3 biological replicates) are plotted, normalized to siControl 6 HPI samples.
Cells stained positively for IE1/2 expression by immunofluorescence were scored at 6HPI following infection (MOI: 3) of control and CNOT1/3 siRNA‐transfected NHDFs. Mean % IE1/2 positive cells are plotted ± SEM (n = 3 biological replicates). No significant (ns) differences between control and knockdown cells were identified by ANOVA test with Dunnett multiple comparison correction.
Immunoblot analysis of lysates from NHDF cells transfected with control or CNOT3 siRNA (#1) and infected with HCMV AD169 at MOI = 3 and analyzed as in Fig 2C.
Immunoblot analysis of lysates from NHDF cells transfected with control or CNOT1 siRNA (#1) and infected with HCMV TB40/E at MOI = 3 and analyzed as in Fig 2C.
Titer of infectious released virus was determined by TCID50 on supernatants of cells transfected with the indicated siRNAs and infected with HCMV clinical strain TB40/E at MOI = 0.05 and incubated for 7 days. Mean TCID50/ml of two biological experiments shown.
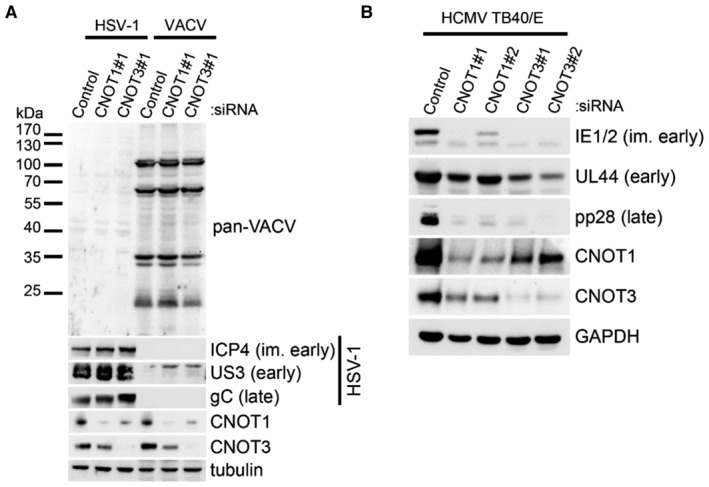
Immunoblot analysis of lysates from NHDF cells transfected with the indicated siRNAs and infected with vaccinia virus (VACV) or Herpes Simplex Virus 1 (HSV‐1) at MOI = 0.005. Following multicycle infection, lysates were collected at 72 HPI and probed for representative HSV‐1 proteins from each temporal expression class (ICP4, US3, gC), for vaccinia proteins using a pan‐vaccinia antibody, and for tubulin as a loading control.
Immunoblot analysis of lysates from NHDF cells transfected with the indicated siRNAs and infected with HCMV clinical strain TB40/E at MOI = 3, collected at 72 HPI. Lysates were probed for representative viral proteins from each temporal expression class and GAPDH.
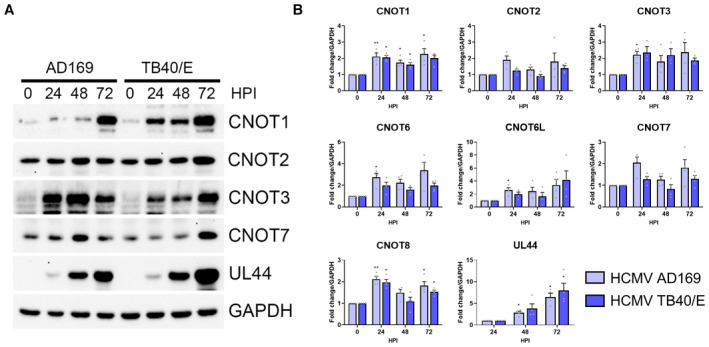
Immunoblot analysis of lysates from NHDF cells infected with HCMV lab strain AD169 or clinical strain TB40/E at MOI = 3, collected at the indicated hours post infection. Lysates were probed for CCR4‐NOT components, viral protein UL44, and GAPDH.
RT‐qPCR analysis for mRNAs encoding CCR4‐NOT components from RNA isolated from cells infected as in (A). Mean fold changes relative to GAPDH ± SEM (n = 4 biological replicates) are plotted with statistical significance established by ANOVA test with Dunnett multiple comparison correction compared with 0HPI (or 24HPI for UL44); (*) P < 0.033, (**) P < 0.002, no asterisk: not significant.
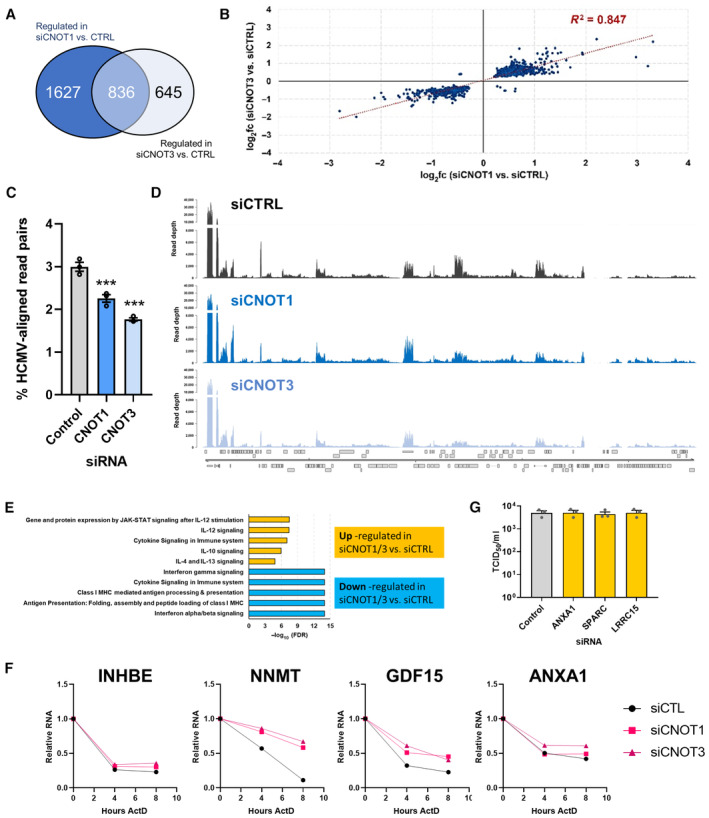
Venn diagram showing the number of significantly (Padj < 0.05) differentially regulated genes in the comparisons between control siRNA‐ and either siCNOT1‐ or siCNOT3‐treated cells.
Scatter plot depicting the log2 fold change vs. control for the 836 intersecting genes in the siCNOT1 and siCNOT3 datasets.
Proportions of sequencing reads aligning to the HCMV strain AD169 reference genome (FJ527563.1) in samples treated with either nonsilencing control, CNOT1 or CNOT3 siRNAs plotted as mean ± SD from three biological replicates. (***) P < 0.001 by unpaired two‐tailed t‐test.
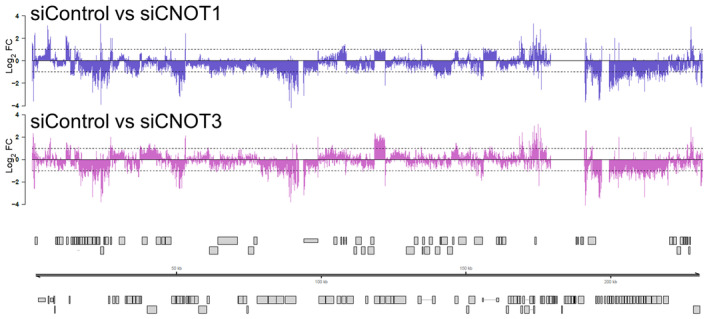
RNA‐Seq coverage plots across the HCMV AD169 genome for nonsilencing control siRNA (siCTRL), siCNOT1, and siCNOT3 datasets. Each plot shows a representative sample of the three biological replicates with depth of coverage plotted on the y‐axis and genome position on the x‐axis. Canonical HCMV ORFs are shown as gray boxes.
Pathway analysis of the 836 intersecting genes using the Reactome Pathway Browser (Jassal et al, 2020). Upregulated (n = 489) and downregulated (n = 347) were processed separately.
mRNA decay of DEGs was monitored over 8 h actinomycin D treatment in control, CNOT1 (#1) and CNOT3 (#1) siRNA‐treated cells, normalized to GAPDH. Representative experiments of three biological replicates are shown.
The effect of DEG‐depletion by siRNA on released infectious viral titer was determined by TCID50 from culture supernatants following 7d infection with AD169 at low MOI (0.05) of knockdown cells, plotted as the mean ± SEM (n = 3 biological replicates). No significant differences between control and DEG knockdowns were found by ANOVA test with Dunnett multiple comparison correction.
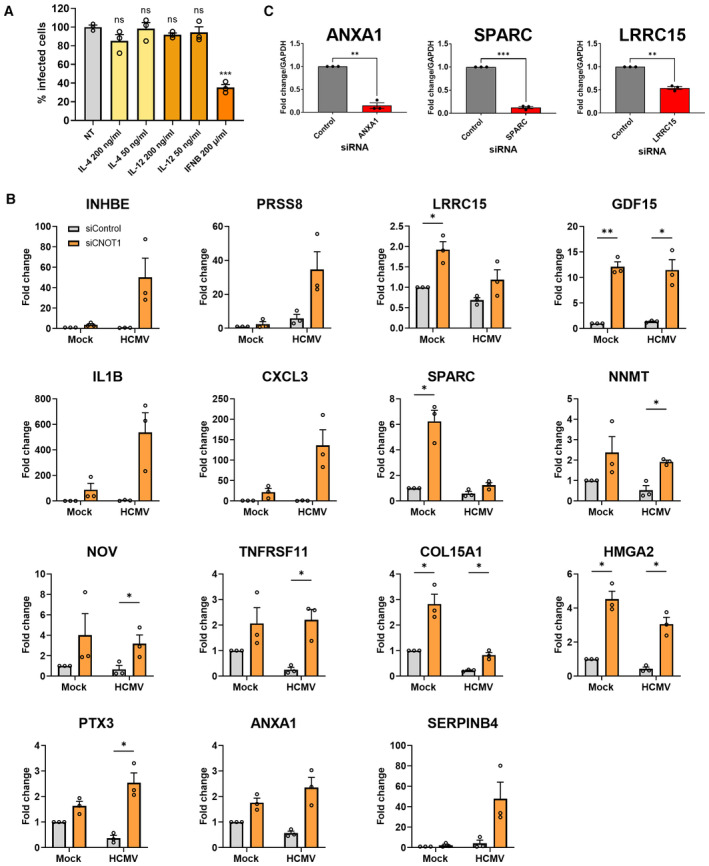
NHDFs were pretreated with indicated cytokines for 24 h and subsequently infected with HCMV (AD169) at low MOI (0.05). At 7 DPI‐infected cells were identified as in Fig 1A using high content imaging. Mean % infected cells ± SEM, normalized to nontreated (NT) cells (n = 3 biological replicates) is plotted. Statistical significance established by ANOVA test with Dunnett multiple comparison correction compared control siRNA‐treated samples; (ns) P > 0.033, (***) P < 0.001.
Select differentially regulated transcripts were validated by RT‐qPCR analysis from control or CNOT1 siRNA‐transfected cells that were mock infected or infected with HCMV AD169 at MOI = 3 and collected at 72 HPI. Mean ± SEM (n = 3 biological replicates) fold change relative to GAPDH is plotted.
siRNAs against host genes differentially expressed by CNOT1/3 knockdown were validated by RT‐qPCR 3 days post‐transfection of NHDFs.
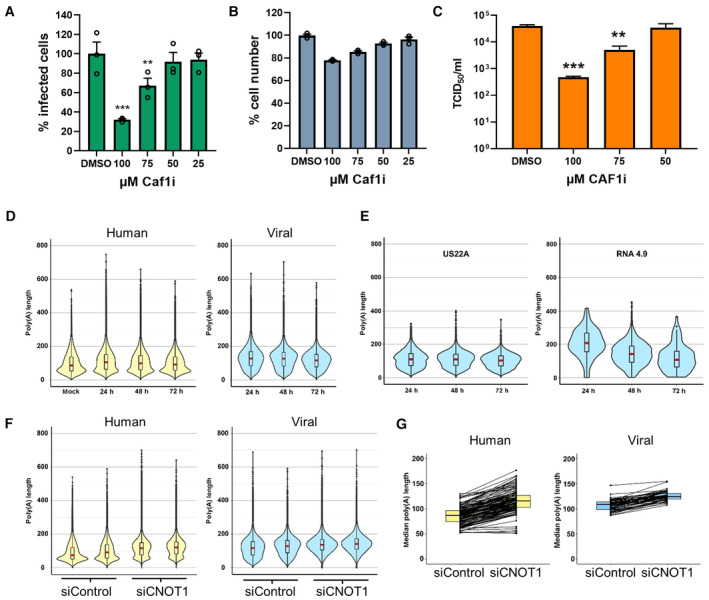
NHDFs infected with HCMV (AD169) at low MOI (0.05) for 1 h and subsequently incubated for 7 days in the presence of Caf1 inhibitor (Caf1i) or vehicle control (DMSO) equivalent to the highest treatment concentration. Infected cells were identified as in Fig 1A using high content imaging. Mean % infected cells ± SEM, normalized to DMSO‐treated cells (n = 3 biological replicates), is plotted. Statistical significance was established by ANOVA test with Dunnett multiple comparison correction compared with DMSO sample, (**) P < 0.02, (***) P < 0.001, no asterisk: not significant.
NHDF cell viability following 7 days Caf1i treatment was assessed by quantifying cell number by DAPI nuclear staining and high content imaging. Mean cell number (± SEM) normalized to DMSO‐treated cells (n = 3 biological replicates) is shown.
Infectious viral titers from culture supernatants following Caf1i treatment were determined by TCID50, plotted as the mean ± SEM (n = 6 biological replicates). Statistical significance was established by ANOVA test with Dunnett multiple comparison correction compared with DMSO sample, (**) P < 0.02, (***) P < 0.001, no asterisk: not significant.
Poly(A) tail length distributions on host (left, yellow) and viral (right, blue) RNAs from nanopore direct RNA sequencing of mock infected and HCMV infected (24, 48, 72 HPI) NHDFs using Nanopolish.
Poly(A) tail length distributions of individual HCMV transcripts.
Poly(A) tail length distributions for host and viral RNAs obtained from HCMV‐infected NHDFs (TB40/E MOI = 3, 72 HPI) treated prior to infection with either a non‐silencing control siRNA or CNOT1 targeting siRNA (#1). Results from two independent experiments are shown adjacently.
Median poly(A) tail lengths of each host and viral mRNA in (F).
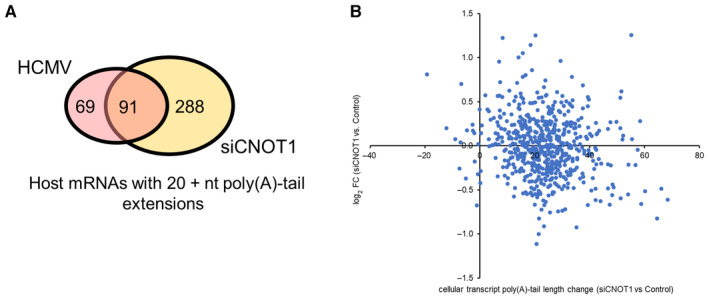
Venn diagram showing overlap of host genes detected with > 20 reads for which ≥ 20 nt poly(A) tail length additions were found at any time point post‐infection (pink) compared to uninfected samples, and in siCNOT1 compared to siControl samples (yellow; average of two biological replicates).
Expression changes of cellular genes upon CNOT1‐depletion (Fig 5) are plotted against poly(A)‐tail length changes upon CNOT1‐depletion detected by DRS (mean of two biological replicates, Fig 6F).
References
-
- Boland A, Chen Y, Raisch T, Jonas S, Kuzuoğlu‐Öztürk D, Wohlbold L, Weichenrieder O, Izaurralde E (2013) Structure and assembly of the NOT module of the human CCR4‐NOT complex. Nat Struct Mol Biol 20: 1289–1297 - PubMed
Publication types
MeSH terms
Substances
Grants and funding
LinkOut - more resources
Full Text Sources
Molecular Biology Databases
