. 2023 Nov 10;133(11):927-943.
doi: 10.1161/CIRCRESAHA.123.323321. Epub 2023 Oct 17.

Nrg1 Regulates Cardiomyocyte Migration and Cell Cycle in Ventricular Development

Affiliations

Nrg1 Regulates Cardiomyocyte Migration and Cell Cycle in Ventricular Development

Joaquim Grego-Bessa et al. Circ Res. .

Abstract

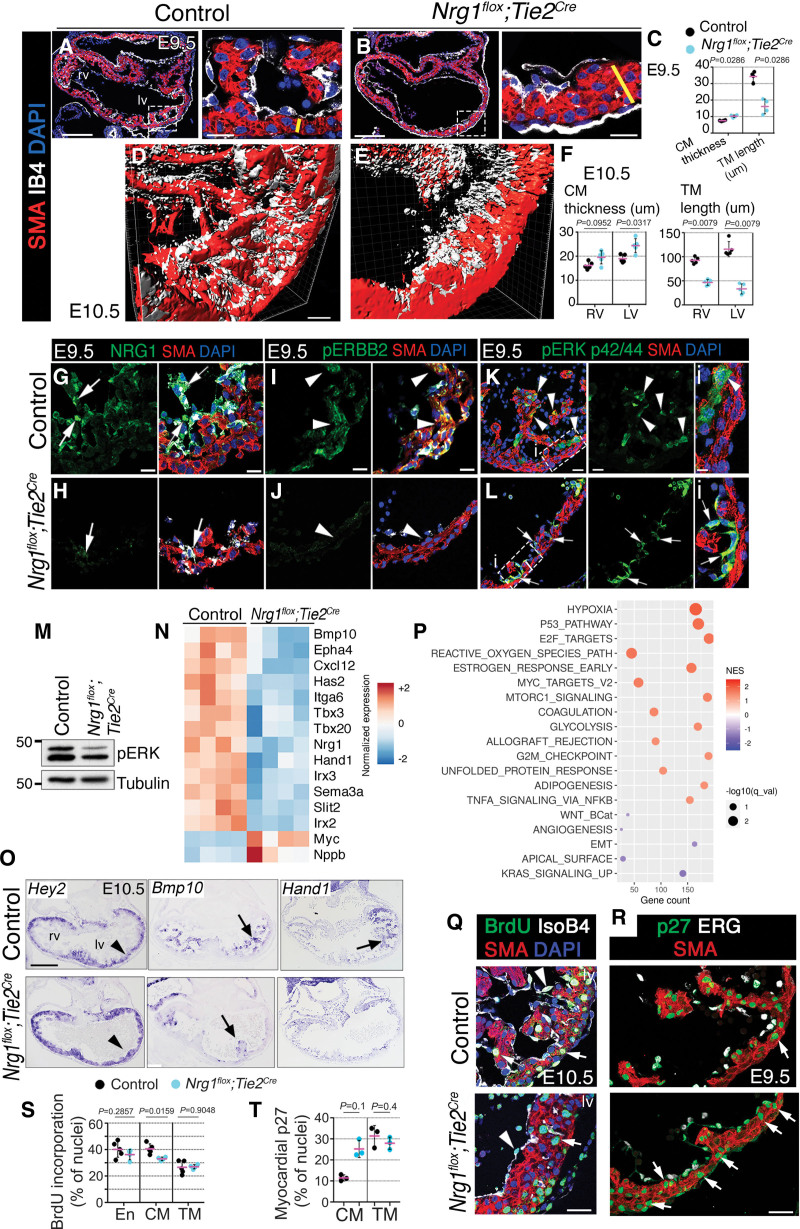
Background: Cardiac ventricles provide the contractile force of the beating heart throughout life. How the primitive endocardium-layered myocardial projections called trabeculae form and mature into the adult ventricles is of great interest for biology and regenerative medicine. Trabeculation is dependent on the signaling protein Nrg1 (neuregulin-1). However, the mechanism of action of Nrg1 and its role in ventricular wall maturation are poorly understood.

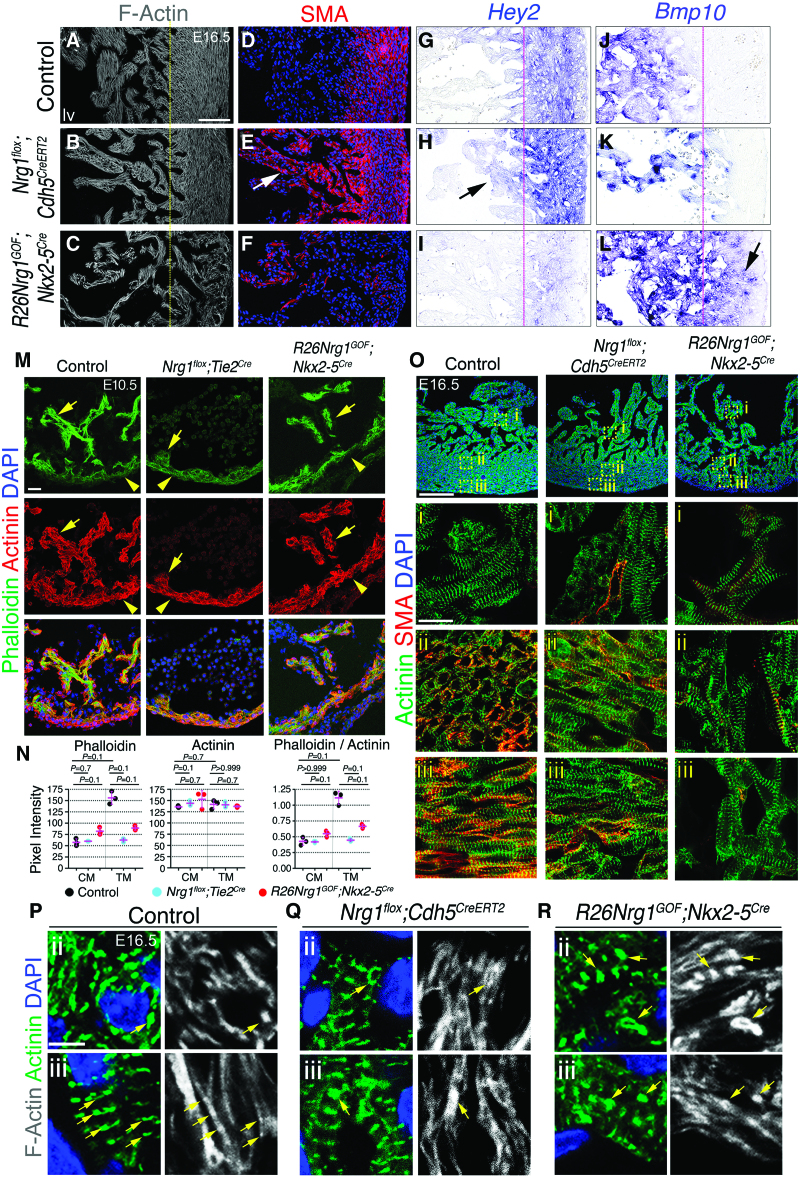
Methods: We investigated the functions and downstream mechanisms of Nrg1 signaling during ventricular chamber development using confocal imaging, transcriptomics, and biochemical approaches in mice with cardiac-specific inactivation or overexpression of Nrg1.

Results: Analysis of cardiac-specific Nrg1 mutant mice showed that the transcriptional program underlying cardiomyocyte-oriented cell division and trabeculae formation depends on endocardial Nrg1 to myocardial ErbB2 (erb-b2 receptor tyrosine kinase 2) signaling and phospho-Erk (phosphorylated extracellular signal-regulated kinase; pErk) activation. Early endothelial loss of Nrg1 and reduced pErk activation diminished cardiomyocyte Pard3 and Crumbs2 (Crumbs Cell Polarity Complex Component 2) protein and altered cytoskeletal gene expression and organization. These alterations are associated with abnormal gene expression related to mitotic spindle organization and a shift in cardiomyocyte division orientation. Nrg1 is crucial for trabecular growth and ventricular wall thickening by regulating an epithelial-to-mesenchymal transition-like process in cardiomyocytes involving migration, adhesion, cytoskeletal actin turnover, and timely progression through the cell cycle G2/M phase. Ectopic cardiac Nrg1 overexpression and high pErk signaling caused S-phase arrest, sustained high epithelial-to-mesenchymal transition-like gene expression, and prolonged trabeculation, blocking compact myocardium maturation. Myocardial trabecular patterning alterations resulting from above- or below-normal Nrg1-dependent pErk activation were concomitant with sarcomere actin cytoskeleton disorganization. The Nrg1 loss- and gain-of-function transcriptomes were enriched for Yap1 (yes-associated protein-1) gene signatures, identifying Yap1 as a potential downstream effector. Furthermore, biochemical and imaging data reveal that Nrg1 influences pErk activation and Yap1 nuclear-cytoplasmic distribution during trabeculation.

Conclusions: These data establish the Nrg1-ErbB2/ErbB4-Erk axis as a crucial regulator of cardiomyocyte cell cycle progression and migration during ventricular development.

Keywords: actin cytoskeleton; actins; cell cycle; endocardium; myocardium; sarcomeres.


Conflict of interest statement

Disclosures None.

Figures

Figure 1.
Figure 1.
Nrg1 (neuregulin-1)-ErbB2 (erb-b2 receptor tyrosine kinase 2)- phospho-Erk (phosphorylated extracellular signal-regulated kinase; pErk) signaling requirement for trabeculation initiation and expansion. Immunofluorescence (IF) against SMA (smooth muscle actin; red) and IB4 (isolectin B4; white) in sections from E9.5 control (A) and Nrg1flox;Tie2Cre hearts (B). Yellow lines mark compact myocardium (CM) thickness. DAPI counterstained (blue). C, Quantification of CM thickness and trabecular myocardium (TM) length in E9.5 control and Nrg1flox;Tie2Cre left ventricles (n=4 embryos per genotype, ≥3 sections per embryo). D and E, Three-dimensional reconstruction of SMA-stained E10.5 control and Nrg1flox;Tie2Cre left ventricles. F, Quantifications of CM thickness and TM length (n=7 embryos per genotype, ≥3 sections per embryo). G through L, IF for Nrg1, pErbB2, and pErk in E9.5 control (G, I, and K) and Nrg1flox;Tie2Cre embryos (H, J, and L). SMA, red; IB4, white. DAPI counterstained. Arrows mark endocardium; arrowheads mark myocardium. M, Western blot of pErk in E9.5 ventricles (pool of n=3 per genotype). N, Heatmap of differentially expressed genes (DEGs) in E9.5 control vs Nrg1flox;Tie2Cre hearts. The color code represents normalized gene expression from −2 to +2. O, Hey2, Bmp10, and Hand1 in situ hybridization (ISH) in E9.5 control and Nrg1flox;Tie2Cre embryos. Arrows, TM; arrowheads, CM. P, Gene set enrichment analysis (GSEA) for E15.5 Nrg1flox;Tie2Cre vs control against Hallmark gene sets. The bubble plot represents enrichment data for a selection of 19 Hallmark gene sets at false discovery rates (FDRs) of q<0.1 and q<0.5, for gene sets with positive or negative enrichment score, respectively. Scale bar indicates normalized enrichment score (NES) from −2 to +2. Gene count is the number of genes at the intersection between the complete collection of genes used as input for the analysis and the complete list of genes included in the gene set, according to the corresponding database. Q, Bromodeoxyuridine (BrdU) IF in E10.5 control and Nrg1flox;Tie2Cre embryos. Arrows, myocardium; arrowheads, endocardium. R, p27 IF in E9.5 control and Nrg1flox;Tie2Cre embryos. Arrows, myocardium. S, Quantification of BrdU incorporation in E10.5 control (n=5, ≥3 sections per embryo) and Nrg1flox;Tie2Cre embryos (n=4, ≥3 sections per embryo). T, Quantification of p27 IF in E9.5 control and Nrg1flox;Tie2Cre embryos (n=3 embryos per genotype). P values obtained by the Mann-Whitney U test. Scale bars, 200 µm (low magnification in A, B, and O), 50 µm (D and E), 20 µm (high magnification in A, B, and G through L, Q, and R), and 10 µm (high magnification in Gi and Hi). En indicates endocardium; LV, left ventricle, and RV, right ventricle.
Figure 2.
Figure 2.
Nrg1 (neuregulin-1) requirement for polarity gene expression and cytoskeletal organization during trabeculation. A, Panther enrichment analyses of 1219 differentially expressed genes (DEGs) in Nrg1flox;Tie2Cre vs control comparison identified establishment or maintenance of cell polarity (Gene Ontology [GO]: 0007163) as enriched (P=0.0064). Heatmap shows relative expression of DEGs associated with this GO term. B, Whole-mount phalloidin staining Z-stack projections of apical (0–4 µm) and basolateral (5–9 µm) regions of outer compact myocardium (CM) in E8.5 control and Nrg1flox;Tie2Cre heart sections. C, Pixel intensity quantification along a 10-pixel-wide trace (white lines in B). Red lines indicate similar background intensities in control and Nrg1flox;Tie2Cre heart sections. Green asterisks indicate values above gray intensity of 100 (green lines). D, Whole-mount immunofluorescence (IF) for Pard3 (Par-3 Family Cell Polarity Regulator). E, Pixel intensity quantification along a 10-pixel-wide trace (white lines between arrowheads). Red lines indicate similar background intensities in control and Nrg1flox;Tie2Cre heart sections. Green asterisks represent values above gray intensity of 30 (green lines). F, Pard3 IF in transverse sections of E8.5 control and Nrg1flox;Tie2Cre embryos (green). Arrowheads in insets mark the apical domain of the CM. DAPI counterstained (blue). G, Heatmap of DEGs for components and mitotic spindle regulators. Color code represents normalized gene expression from −1.5 to +1.5. H, Schematic of mitotic spindle orientation analysis relative to the cardiac lumen: parallel (0°–20°), oblique (20°–70°), or perpendicular (70°–90°). I through N, Representative IF images of mitotic cells stained for survivin (green) and SMA (smooth muscle actin; red) in control and Nrg1flox;Tie2Cre heart sections at E8.5. DAPI counterstained. A general view of E8.5 hearts is shown in the top (I, insets i and ii). White lines in i and ii and K through N indicate the reference plane of the cardiac lumen. Yellow lines indicate mitotic spindle orientation. J, OCD quantification in E8.5 control (n=3 embryos; n=26 mitotic figures) and Nrg1flox;Tie2Cre hearts (n=3 embryos; n=30 mitotic figures). P values obtained by Fisher exact test. P<0.05. Scale bars, 20 µm (B, D, and F), 15 µm (D), and 10 µm (I–N).
Figure 3.
Figure 3.
Nrg1 (neuregulin-1) role in trabecular growth and inner ventricular wall formation. A and B, Itga6 (integrin α6) and Tnnt2 (troponin T2) immunofluorescence (IF; A) and phalloidin (F-actin; B) staining in E16.5 control and Nrg1flox;Cdh5CreERT2 heart sections. Dotted lines mark the compact myocardium (CM)–trabecular myocardium (TM) separation. C, Quantification of CM and TM thickness (n=4 embryos per genotype and ≥3 sections per embryo). D, Gja5 ISH in E16.5 control and Nrg1flox;Cdh5CreERT2 embryos. Arrows mark TM. E, Heatmap of representative differentially expressed genes (DEGs) in E15.5 control vs Nrg1flox;Cdh5CreERT2 hearts. The color code represents normalized gene expression from −1.5 to +1.5. F, Gene set enrichment analysis (GSEA) for E15.5 Nrg1flox;Cdh5CreERT2 vs control against Hallmark gene sets. The bubble plot represents enrichment data for a selection of 14 Hallmark gene sets with false discovery rate (FDR) q<0.25. Scale bar indicates normalized enrichment score (NES) from −2 to +2. Gene count is the number of genes at the intersection between the complete collection of genes used as input for the analysis and the complete list of genes included in the gene set, according to the corresponding database. G, Left, Phospho-histone 3 (pHH3) IF on E16.5 control and Nrg1flox;Cdh5CreERT2 heart sections (n=3 per genotype). G, Right, Boxed regions magnified. H, Quantification of %pHH3+ cardiomyocytes (n=3 per genotype and ≥3 sections per embryo). I, IB4 (isolectin B4) and DAPI staining in E16.5 control and R26Nrg1GOF;Nkx2-5Cre transverse heart sections. Double-headed arrows indicate myocardium thickness. Dotted lines demark the CM-TM separation. J and K, WGA (wheat germ agglutinin)-FITC staining on transverse sections of CM and TM in E16.5 control and R26Nrg1GOF;Nkx2-5Cre hearts. Quantification of CM and TM thickness (L) and cell roundness (M) in E16.5 control and R26Nrg1GOF;Nkx2-5Cre heart sections (n=3 embryos per genotype and ≥3 sections per embryo). N, Heatmap of DEG in E15.5 R26Nrg1GOF;Nkx2-5Cre vs control hearts. The color code represents NES from −1.5 to +1.5. O, Gja5 ISH in E16.5 control and R26Nrg1GOF;Nkx2-5Cre hearts. P, GSEA for E15.5 R26Nrg1GOF;Nkx2-5Cre vs control against Hallmark gene sets. The bubble plot represents enrichment data for a selection of 14 Hallmark gene sets with FDR q<0.05. Scale bar indicates NES from −3 to +3. Gene count is the number of genes at the intersection between the complete collection of genes used as input for the analysis and the complete list of genes included in the gene set, according to the corresponding database. Q, Left, Bromodeoxyuridine (BrdU)-positive IF on E16.5 control and R26Nrg1GOF;Nkx2-5Cre hearts (n=3 per genotype). Q, Right, Boxed regions magnified. R, Quantification of %BrdU incorporation in CM and TM in control and R26Nrg1GOF;Nkx2-5Cre hearts (n=3 per genotype and ≥3 sections per embryo). P values obtained by the Mann-Whitney U test. Scale bars, 100 µm in A, D, and O; 50 µm in B; 200 µm in G; 50 µm in G, inset; 20 µm in I through K; 200 µm in Q; and 50 µm in insets. lv, left ventricle
Figure 4.
Figure 4.
Cytoskeletal dynamics mediate ventricular patterning. A through F, Phalloidin (filamentous-actin [F-actin]) staining and SMA (smooth muscle actin) immunofluorescence (IF) in E16.5 left ventricular sections from control (A and D), Nrg1flox;Cdh5CreERT2 (B and E), and R26Nrg1GOF;Nkx2-5Cre hearts (C and F). Yellow lines mark the position of the trabecular myocardium (TM)–compact myocardium (CM) morphological border. The border shifts in Nrg1flox;Cdh5CreERT2 and R26Nrg1GOF;Nkx2-5Cre hearts. The arrow marks strong SMA immunostaining in TM relative to CM in Nrg1flox;Cdh5Cre hearts (E). Note also reduced SMA expression in R26Nrg1GOF;Nkx2-5Cre CM (F). G through L, Hey2 and Bmp10 ISH in E16.5 left ventricular sections from control (G and J), Nrg1flox;Cdh5CreERT2 (H and K), and R26Nrg1GOF;Nkx2-5Cre hearts (I and L). Pink lines mark the position of the TM-CM morphological border. The border shifts in Nrg1flox;Cdh5CreERT2 and R26Nrg1GOF;Nkx2-5Cre hearts. Arrows mark ectopic Hey2 and Bmp10 expression in Nrg1flox;Cdh5CreERT2 and R26Nrg1GOF;Nkx2-5Cre hearts. Note also reduced Hey2 expression in CM of R26Nrg1GOF;Nkx2-5Cre hearts. M, F-actin (phalloidin) and α-actinin staining in E10.5 control, Nrg1flox;Tie2Cre, and R26Nrg1GOF;Nkx2-5Cre hearts. Yellow arrows, TM; arrowheads, CM. N, Quantification of phalloidin and α-actinin staining and phalloidin/α-actinin ratios in heart sections from E10.5 control, Nrg1flox;Cdh5CreERT2, and R26Nrg1GOF;Nkx2-5Cre embryos (n=3 embryos per genotype and 4 measurements per embryo). P values were obtained by the Mann-Whitney U test. O, α-Actinin and α-SMA immunodetection in E16.5 control, Nrg1flox;Cdh5CreERT2, and R26Nrg1GOF;Nkx2-5Cre hearts. i, ii, and iii show high-magnification views of TM, inner CM, and outer CM, respectively. P through R, Detail of F-actin and α-actinin double IF at E16.5 in inner CM (ii) and outer CM (iii). Yellow arrows mark Z bands and highlight aberrant Z-band structures in Nrg1flox;Cdh5CreERT2 and R26Nrg1GOF;Nkx2-5Cre hearts. Scale bars, 100 µm in A through I, and O; 20 µm in M; 10 µm in Oi through Oiii; and 5 µm in P through R.
Figure 5.
Figure 5.
Nrg1 (neuregulin-1)-mediated phospho-Erk (extracellular signal-regulated kinase; pErk) and phosphorylated Yap1 (yes1-associated transcriptional regulator; pYap1) regulation in chamber development. A through C, pErk immunofluorescence (IF) in E9.5 (A and B) and E11.5 embryos (C and D). Arrowheads indicate labeled cardiomyocytes in trabecular myocardium (TM) and compact myocardium (CM). E and F, Gene set enrichment analysis (GSEA) for E15.5 Nrg1flox;Cdh5CreERT2 vs control (E) and R26Nrg1GOF;Nkx2-5Cre vs control (F), against gene sets of ERBB2OE vs control and Lin9KO vs control, or direct YAP1 target genes. Bubble plots showing enrichment data at false discovery rate (FDR) q<0.25, with color scale indicating NES from −3 to +3. G, pYAP S274 IF in E9.5 control and (H) Nrg1flox;Tie2Cre heart sections. Arrows mark cytoplasmic signal, and arrowheads mark nuclear signal. I, Western blot analysis and quantification of pYAP S274 and pMOB1-Thr35 in E9.5 control and Nrg1flox;Tie2Cre ventricles (pool of n=3 per genotype), pYAP S274, pERK 42/44, and pMOB1-Thr35 in E16.5 control and Nrg1flox;Cdh5CreERT2 (J), and control and R26Nrg1GOF;Nkx2-5Cre ventricles (K). n=1 embryo per genotype; n=2 to 3 replicas (J and K). P values were obtained by the Mann-Whitney U test. α-Tubulin was used as gel-loading control and for normalization in quantifications. Scale bars: 100, 20, and 10 μm in A and B (low- to high-magnification view); 100, 30, and 10 µm in C and D; 50 um in G and H; 10 um in i and ii. L, Proposed Nrg1 function in ventricular chamber development and maturation. E8.5 to E10.5: wild type, Nrg1 released from the endocardium (green) activates phosphorylated ErbB2 (erb-b2 receptor tyrosine kinase 2; pErbB2) and pErk in TM (blue), promoting nuclear pYap S274 (pYap S274act). Signaling involves actin cytoskeleton activation, apical-basal (A-B) polarity loss, epithelial-mesenchymal transition (EMT)–like phenotype, OCD, directional migration, and patterning (CM vs TM). Nrg1 loss of function (LOF; E8.5–E10.5): disrupted Nrg1 signaling affects OCD, causing CM thickening and underdeveloped trabeculae, associated with A-B polarity marker depletion, disorganized actin cytoskeleton, low pErk, and pYap S274 inactivation (pYap S274inact). E10.5 to E16.5: wild-type trabeculae elongate via directional migration from outer CM (beige) to inner CM (blue). Nrg1 is crucial for ventricular conduction system (VCS) specification (brown) but not compaction. Nrg1 LOF (E10.5–E16.5) results in Nrg1 depletion, low pErk, and TM expressing CM genes, leading to rudimentary mispatterned trabeculae, reduced inner myocardial wall growth, and hypomitogenic cell cycle arrest. Nrg1 gain of function (GOF; E10.5–E16.5), cardiac Nrg1 overexpression, high pErk, trabeculation of CM, and impaired compaction. Hypermitogenic signaling causes cell cycle arrest and senescence onset. Both Nrg1 LOF and GOF disrupt ventricular chamber maturation and cardiac developmental progress.

References

    1. Jimenez-Amilburu V, Rasouli SJ, Staudt DW, Nakajima H, Chiba A, Mochizuki N, Stainier DY. In vivo visualization of cardiomyocyte apicobasal polarity reveals epithelial to mesenchymal-like transition during cardiac trabeculation. Cell Rep. 2016;17:2687–2699. doi: 10.1016/j.celrep.2016.11.023 - PubMed
    1. Li J, Miao L, Shieh D, Spiotto E, Li J, Zhou B, Paul A, Schwartz RJ, Firulli AB, Singer HA, et al. Single-cell lineage tracing reveals that oriented cell division contributes to trabecular morphogenesis and regional specification. Cell Rep. 2016;15:158–170. doi: 10.1016/j.celrep.2016.03.012 - PMC - PubMed
    1. Sedmera D, Pexieder T, Vuillemin M, Thompson RP, Anderson RH. Developmental patterning of the myocardium. Anat Rec. 2000;258:319–337. doi: 10.1002/(SICI)1097-0185(20000401)258:4<319::AID-AR1>3.0.CO;2-O - PubMed
    1. Wu B, Zhang Z, Lui W, Chen X, Wang Y, Chamberlain AA, Moreno-Rodriguez RA, Markwald RR, O’Rourke BP, Sharp DJ, et al. Endocardial cells form the coronary arteries by angiogenesis through myocardial-endocardial VEGF signaling. Cell. 2012;151:1083–1096. doi: 10.1016/j.cell.2012.10.023 - PMC - PubMed
    1. Meyer D, Birchmeier C. Multiple essential functions of neuregulin in development. Nature. 1995;378:386–390. doi: 10.1038/378386a0 - PubMed

Publication types