. 2023 Dec;601(23):5341-5366.
doi: 10.1113/JP284999. Epub 2023 Oct 17.

Ih current stabilizes excitability in rodent DRG neurons and reverses hyperexcitability in a nociceptive neuron model of inherited neuropathic pain

Affiliations

Ih current stabilizes excitability in rodent DRG neurons and reverses hyperexcitability in a nociceptive neuron model of inherited neuropathic pain

Dmytro V Vasylyev et al. J Physiol. 2023 Dec.

Abstract

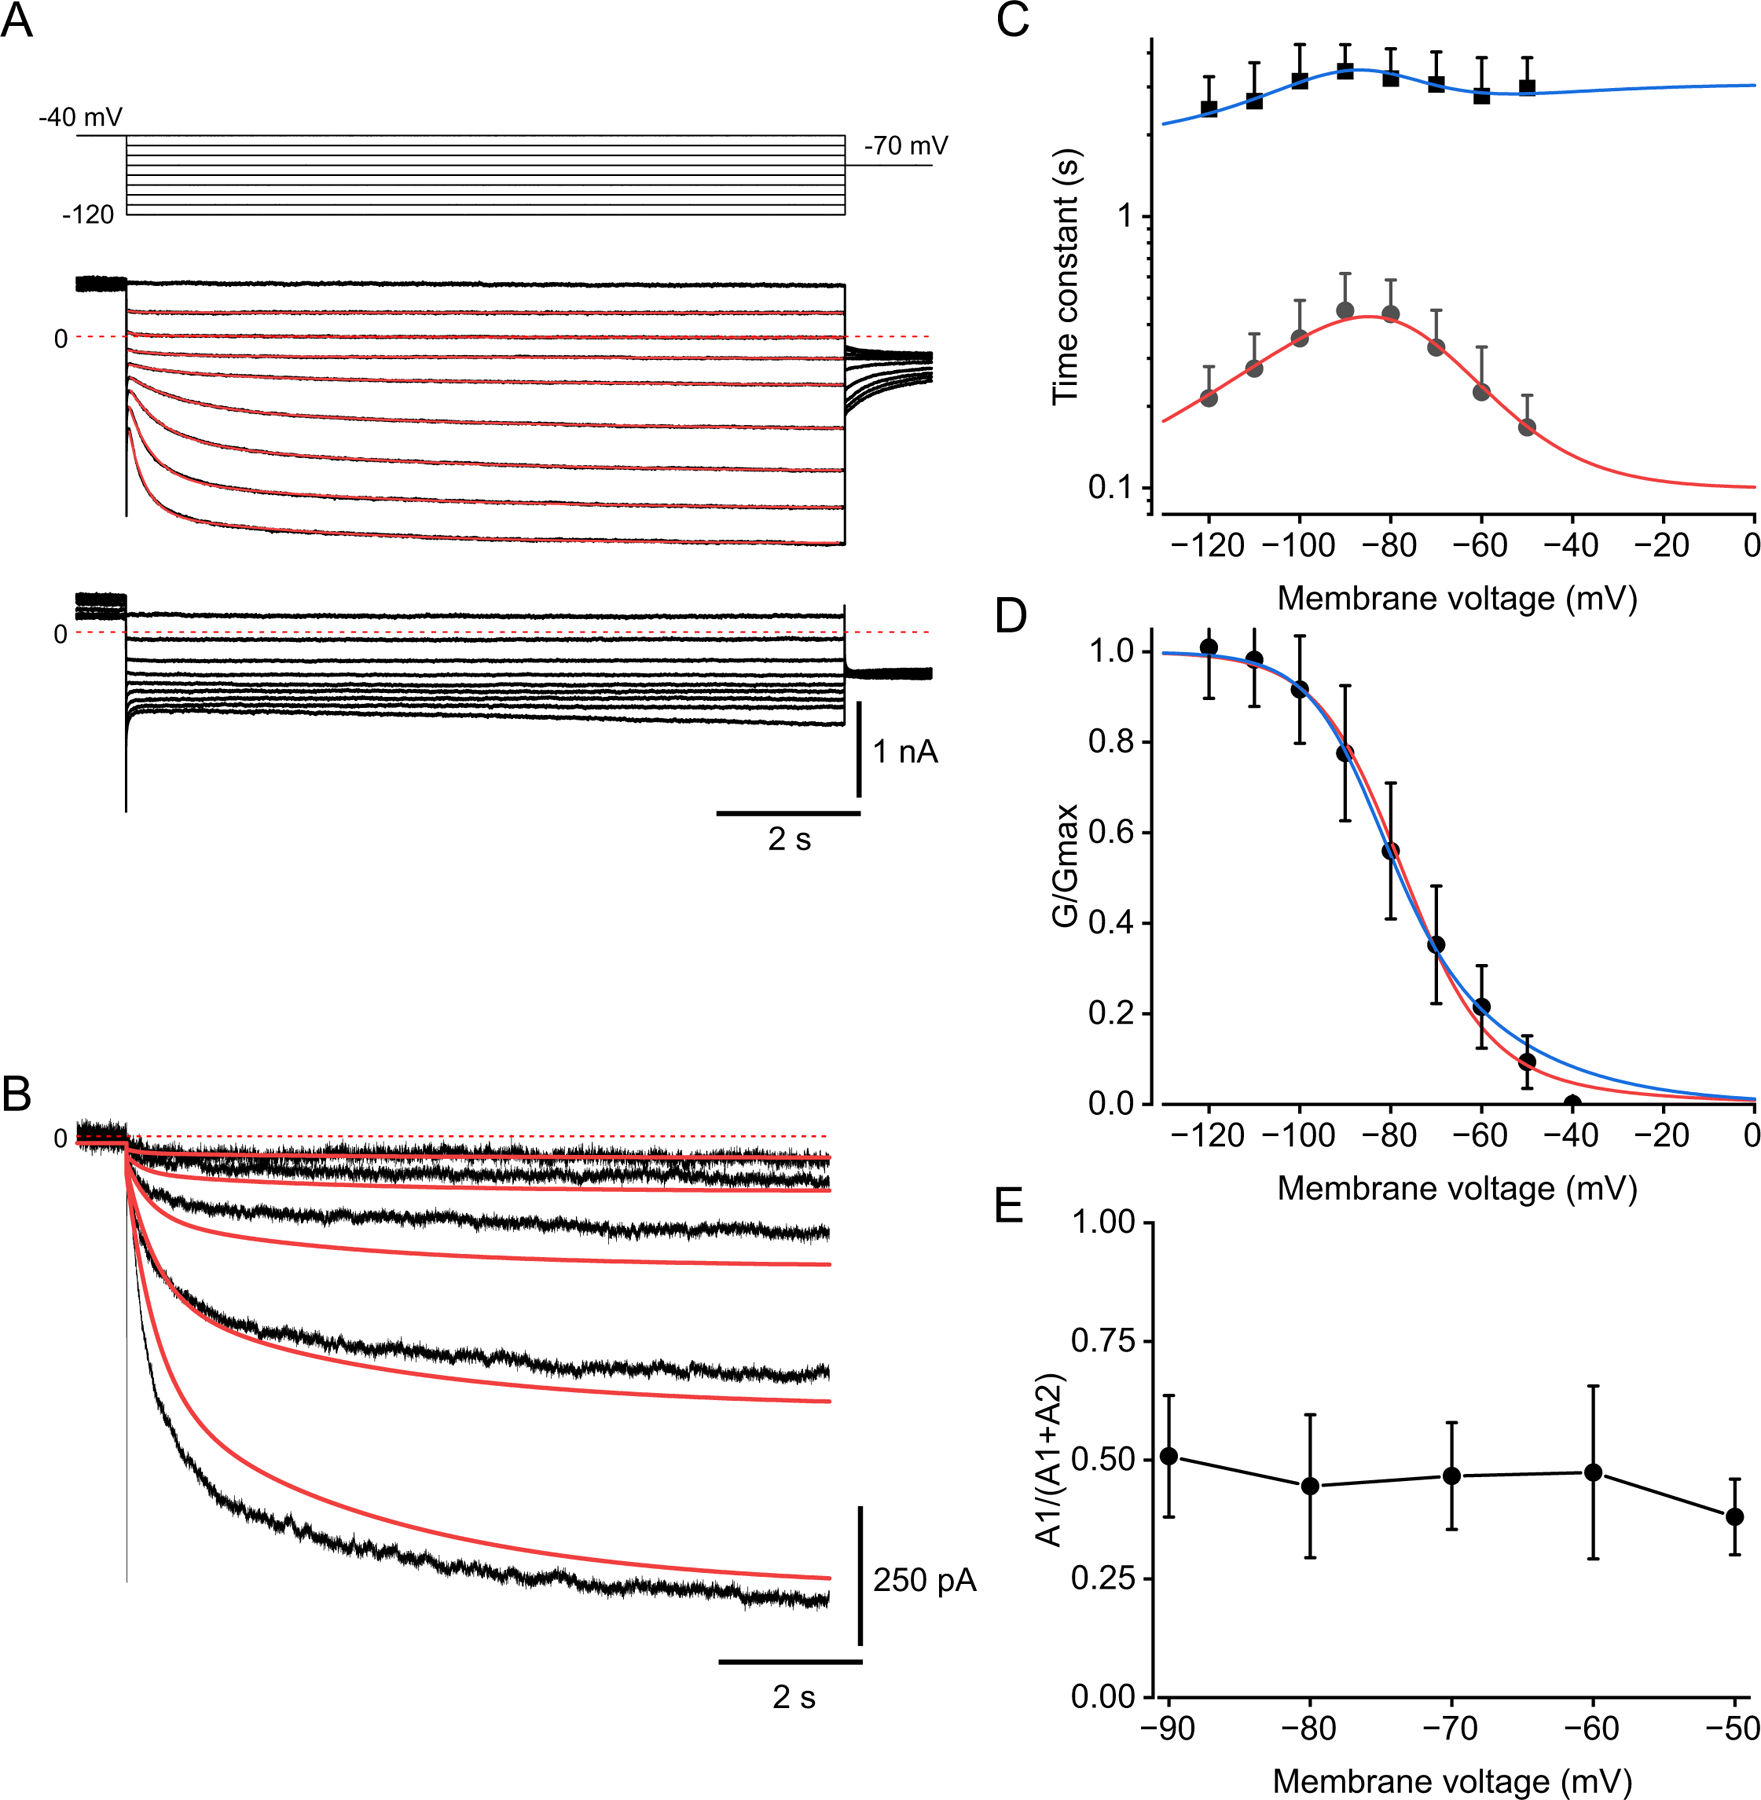
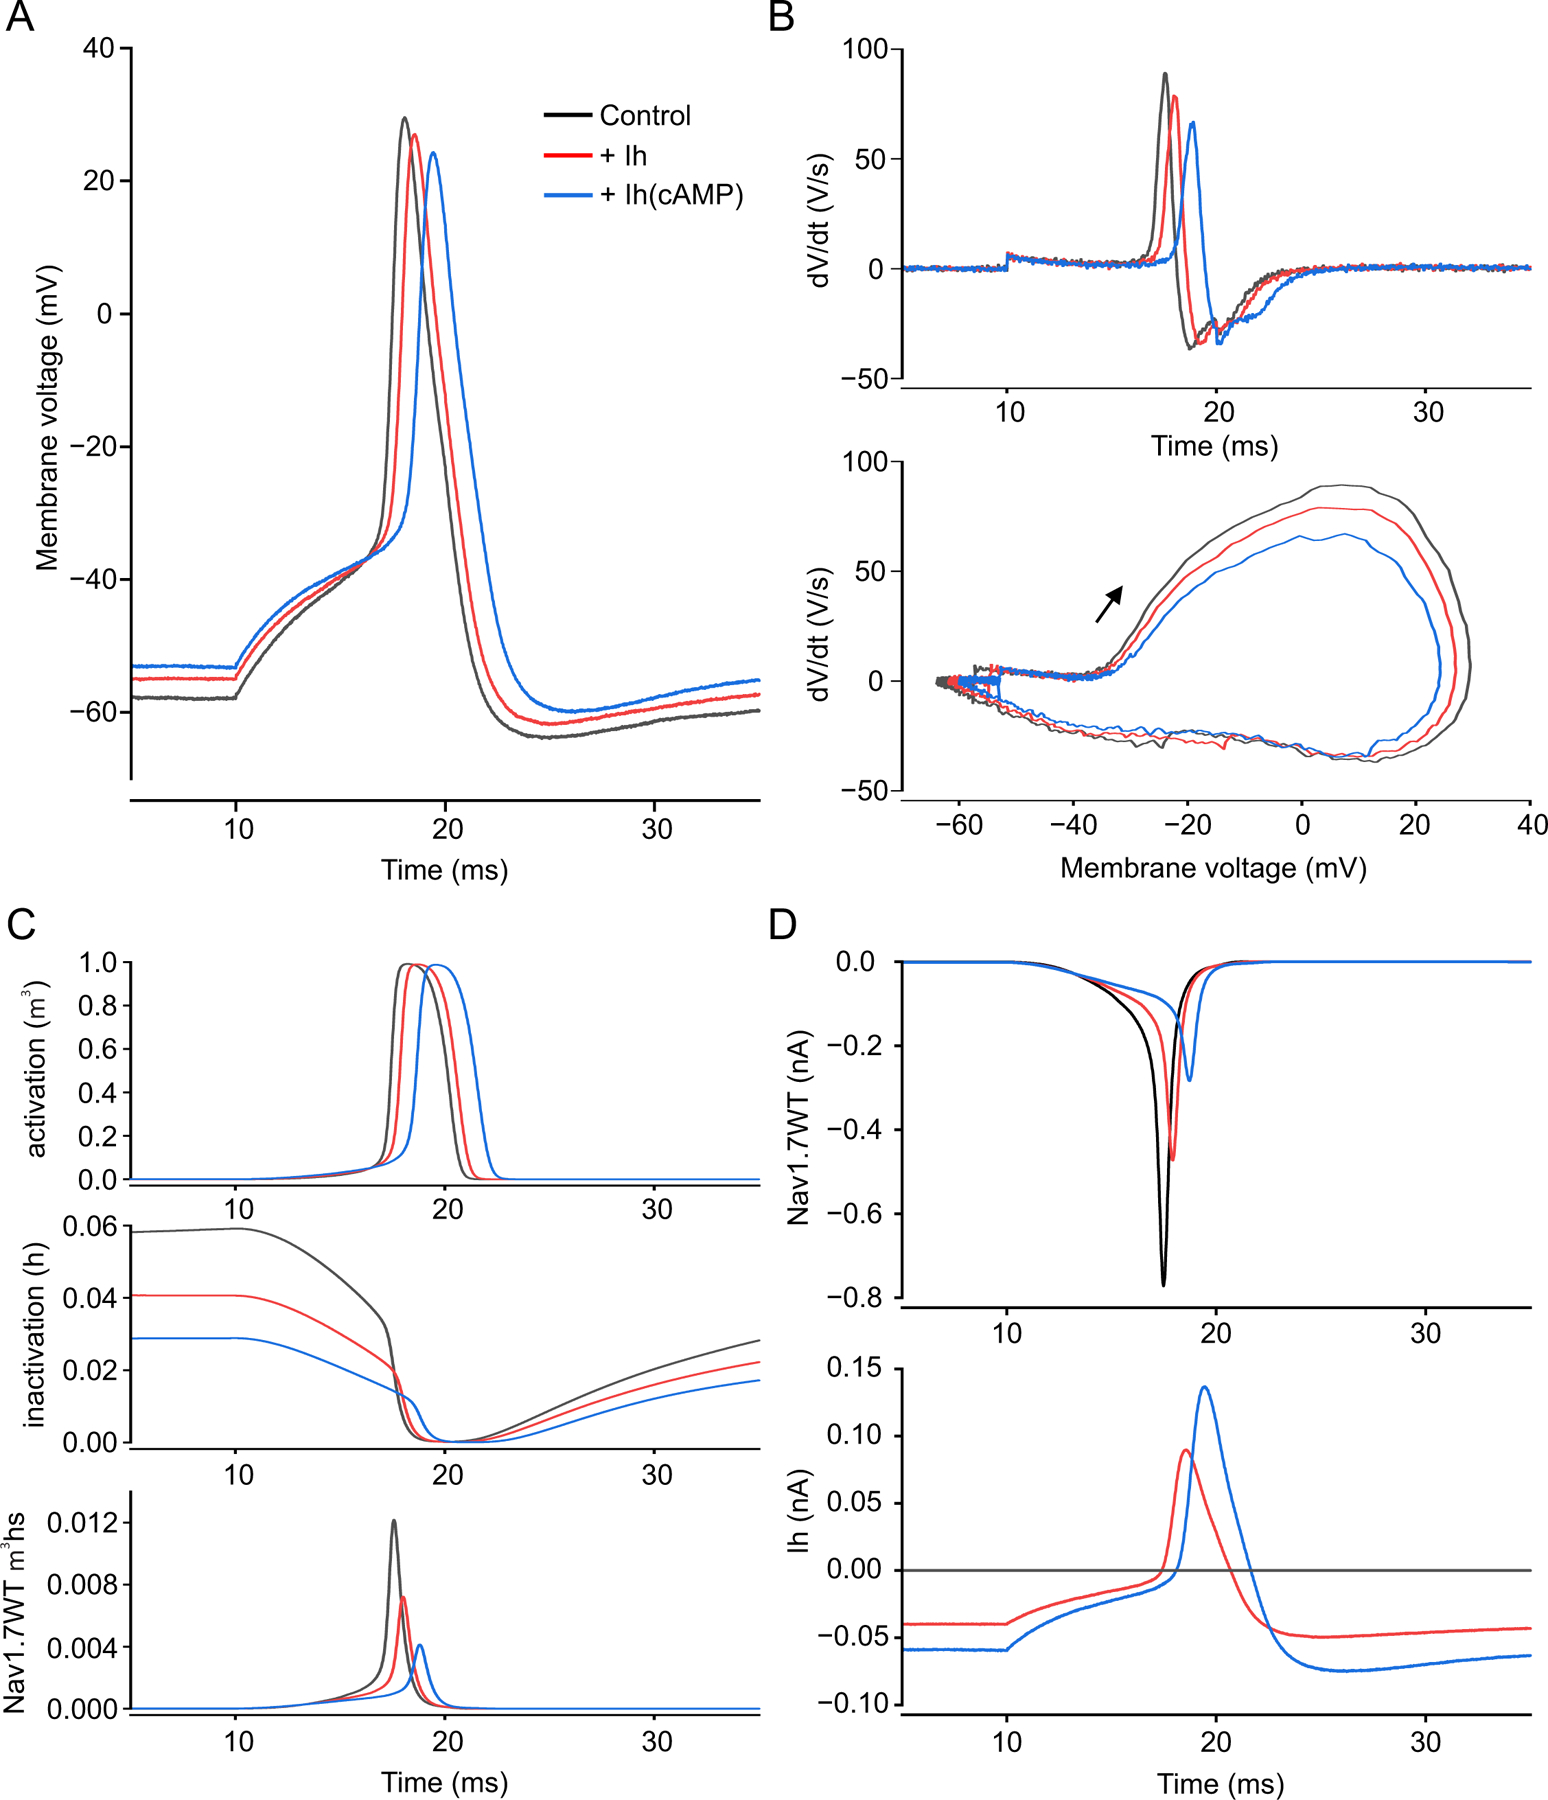
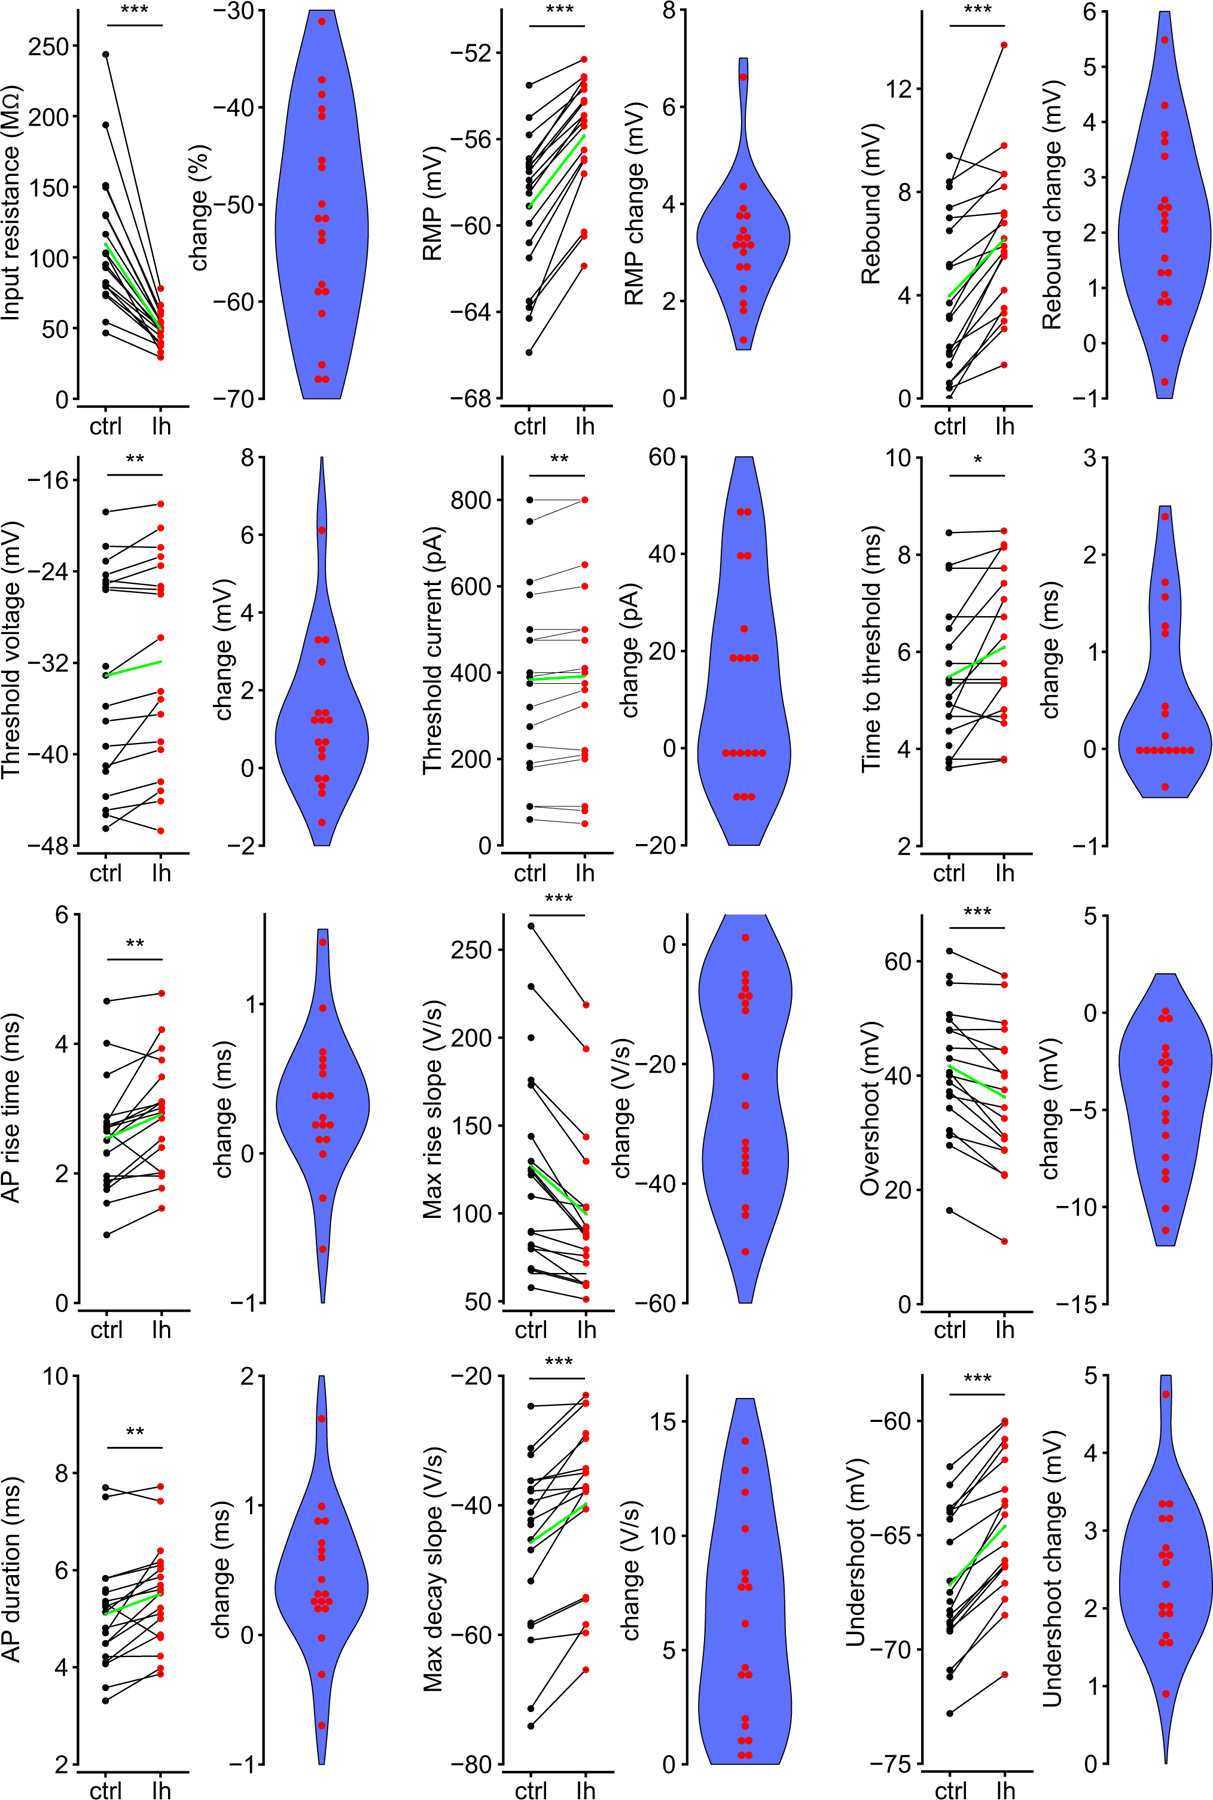
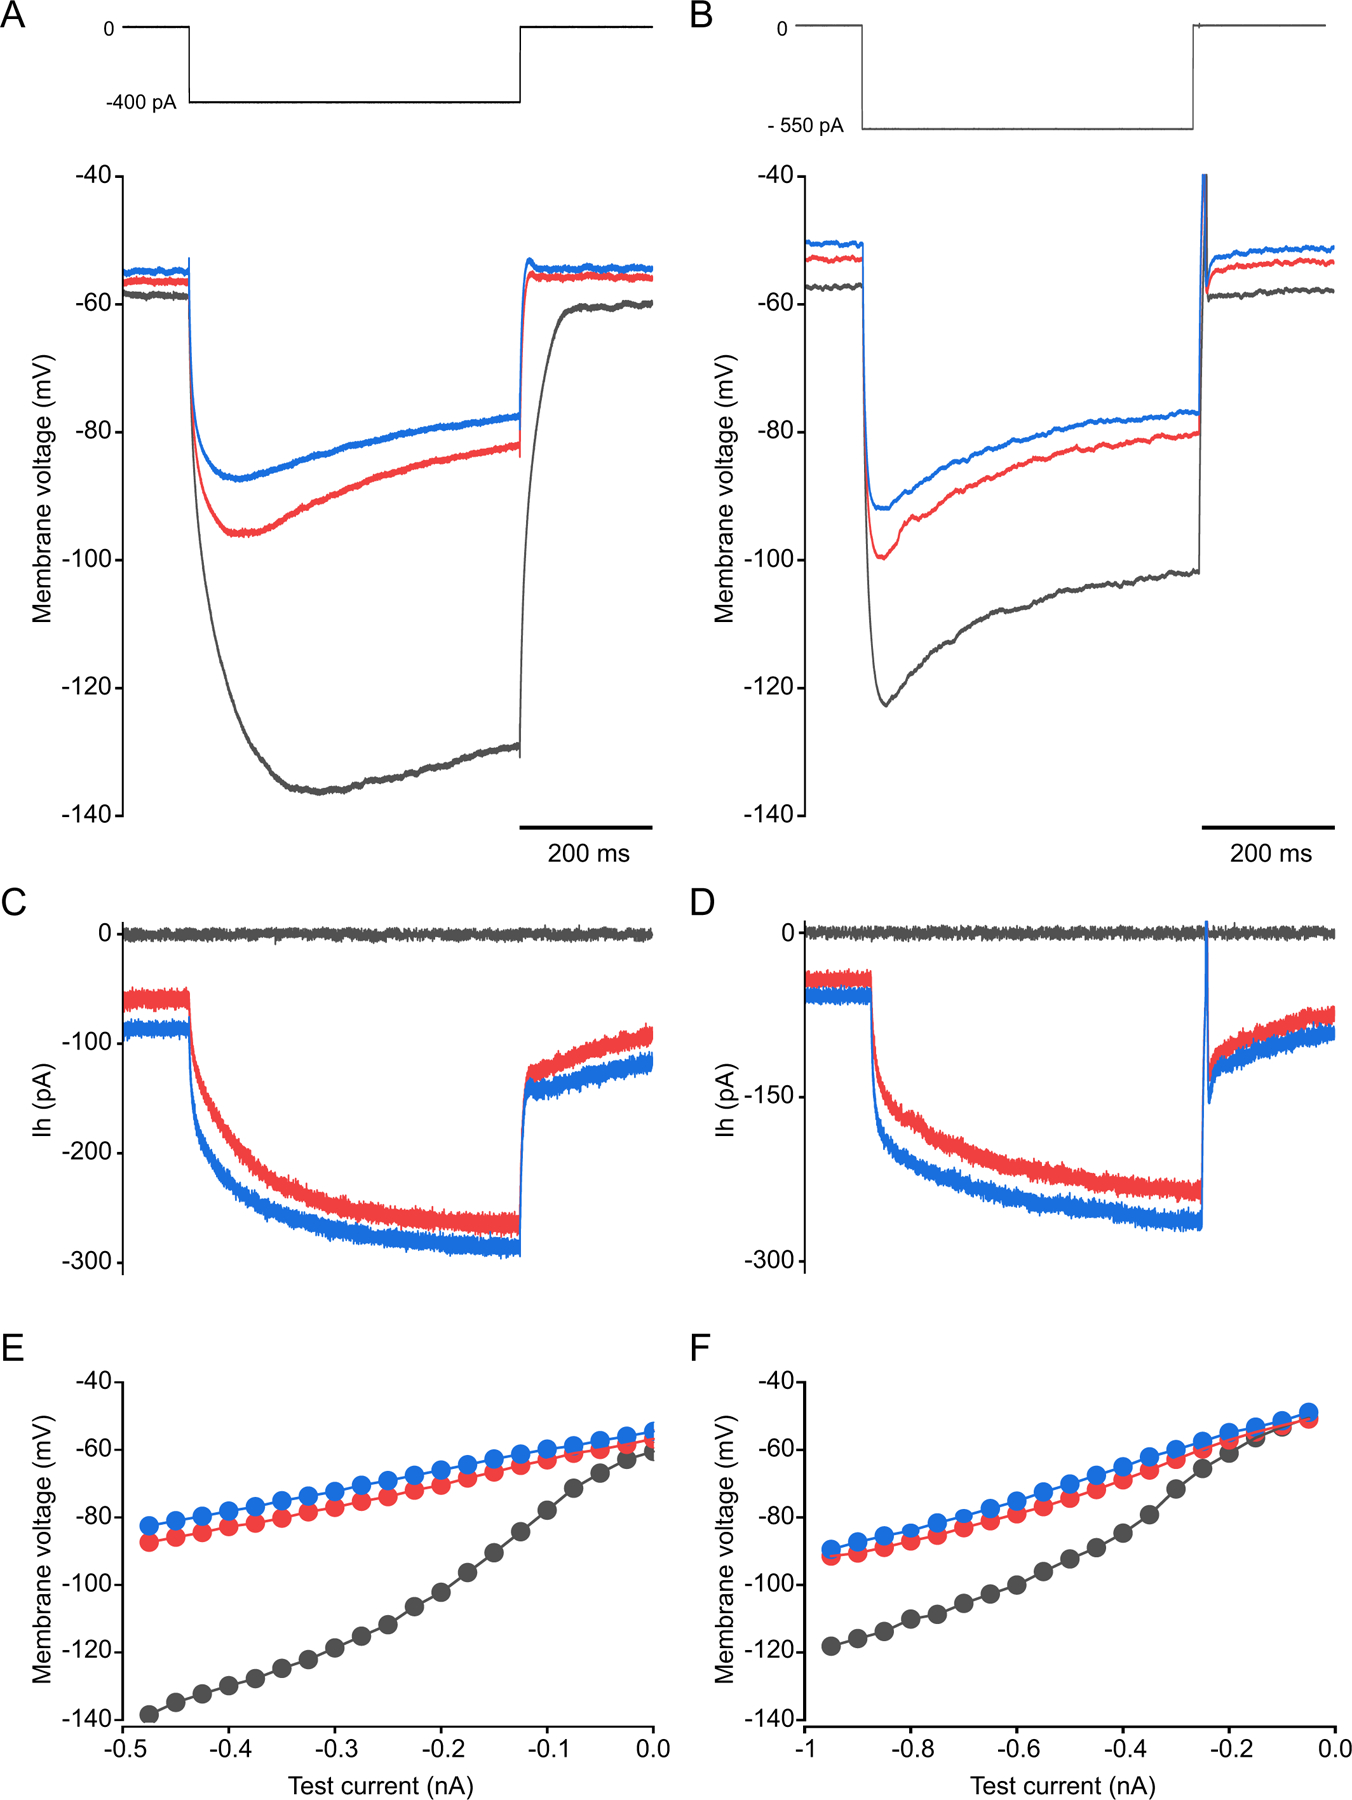
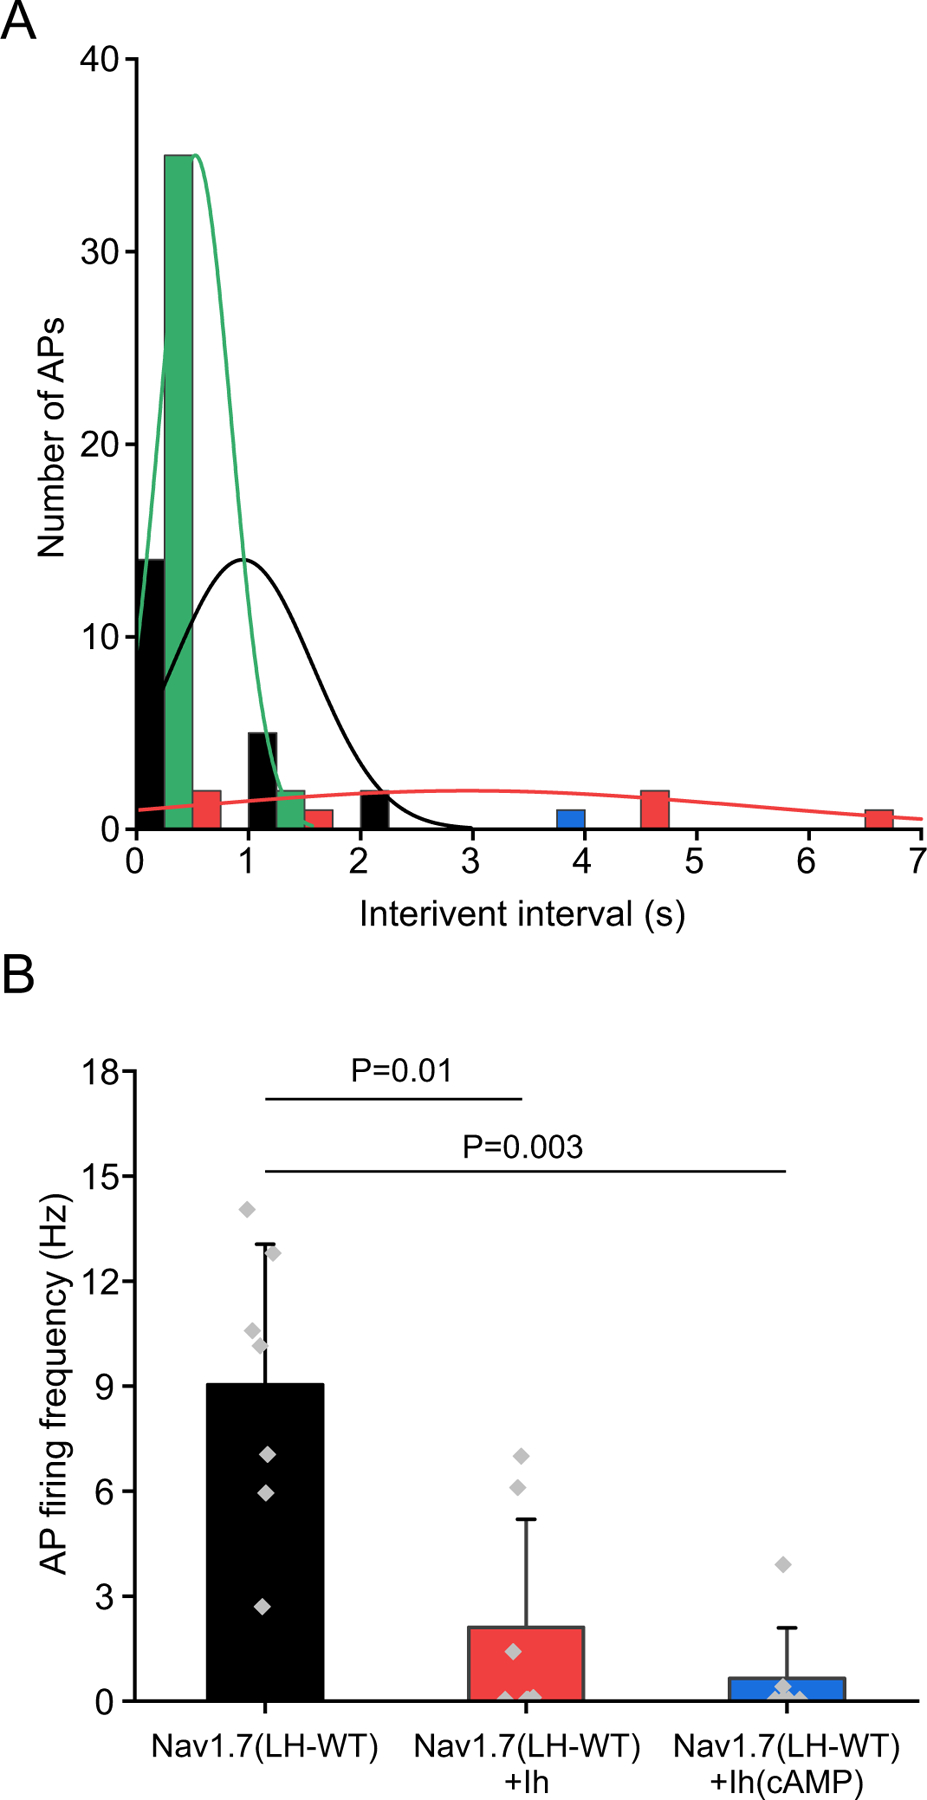
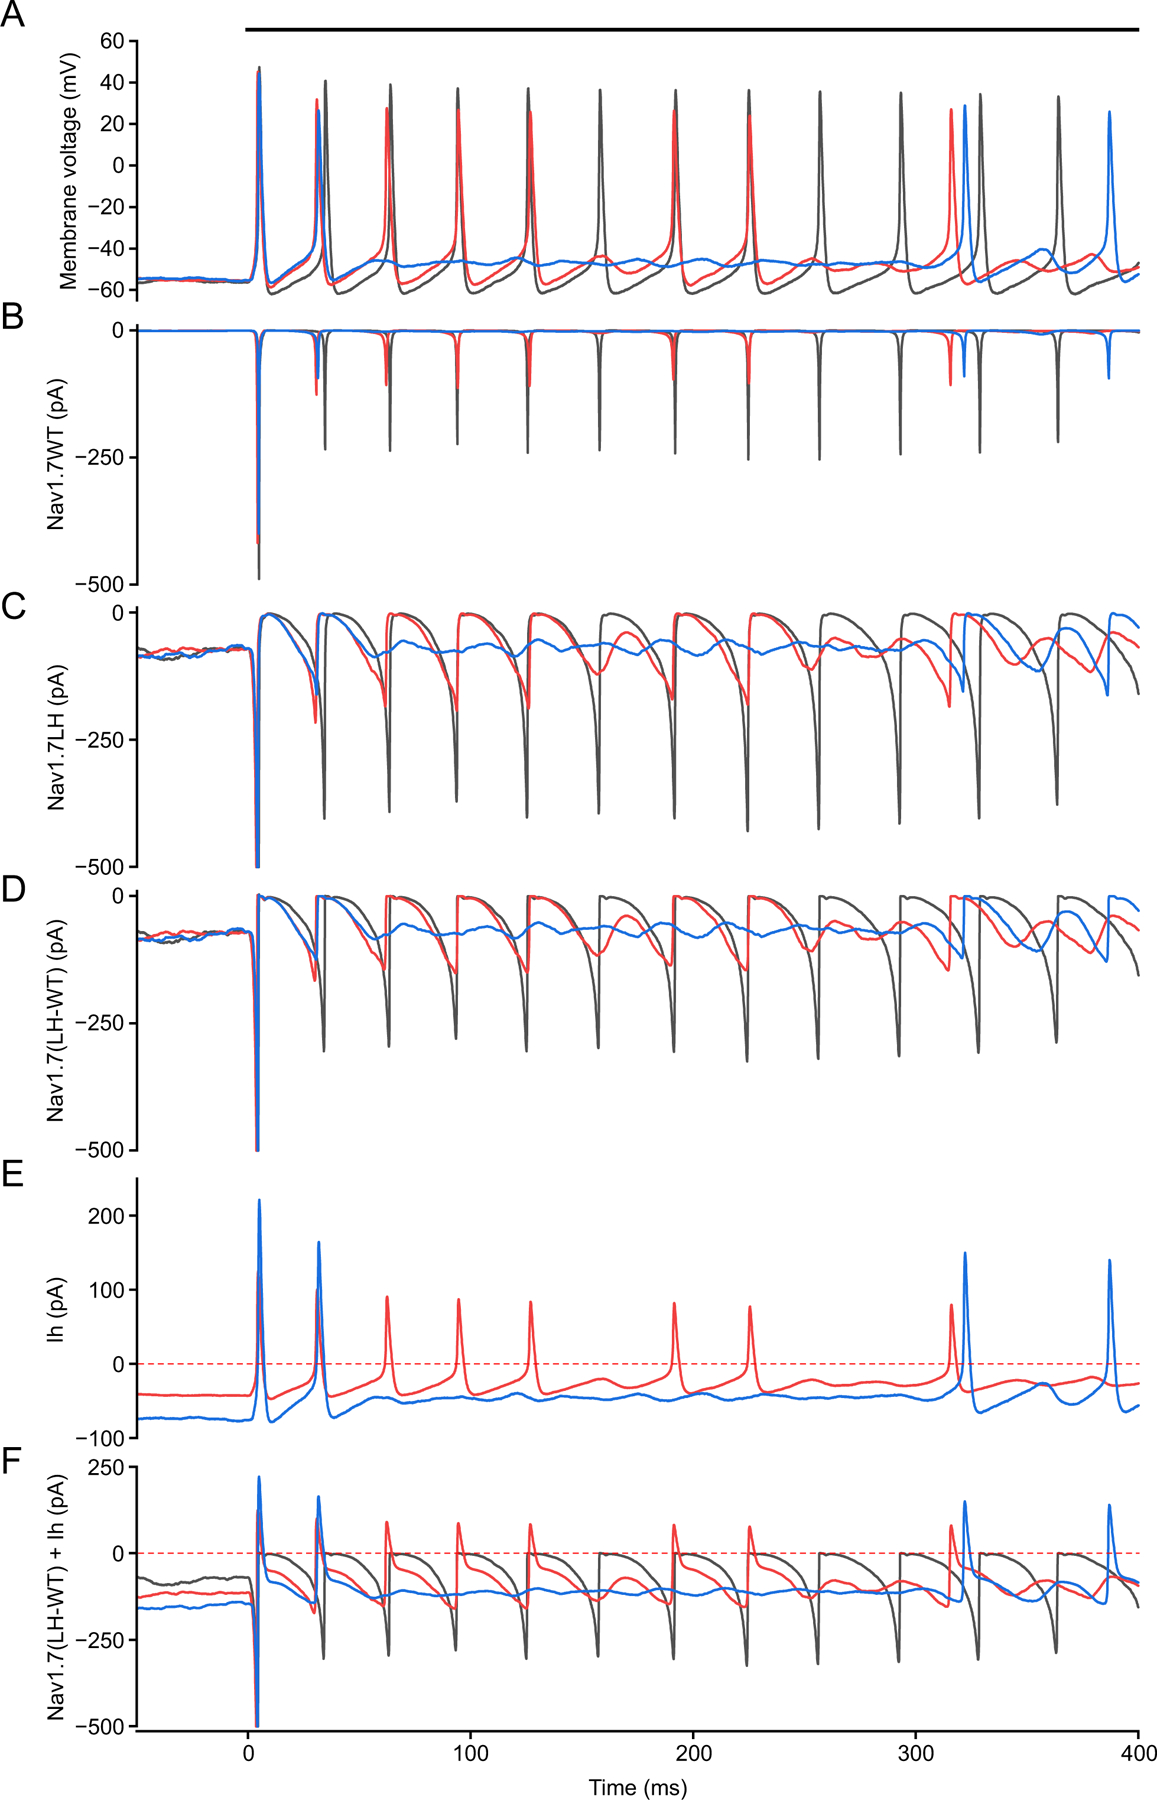
We show here that hyperpolarization-activated current (Ih ) unexpectedly acts to inhibit the activity of dorsal root ganglion (DRG) neurons expressing WT Nav1.7, the largest inward current and primary driver of DRG neuronal firing, and hyperexcitable DRG neurons expressing a gain-of-function Nav1.7 mutation that causes inherited erythromelalgia (IEM), a human genetic model of neuropathic pain. In this study we created a kinetic model of Ih and used it, in combination with dynamic-clamp, to study Ih function in DRG neurons. We show, for the first time, that Ih increases rheobase and reduces the firing probability in small DRG neurons, and demonstrate that the amplitude of subthreshold oscillations is reduced by Ih . Our results show that Ih , due to slow gating, is not deactivated during action potentials (APs) and has a striking damping action, which reverses from depolarizing to hyperpolarizing, close to the threshold for AP generation. Moreover, we show that Ih reverses the hyperexcitability of DRG neurons expressing a gain-of-function Nav1.7 mutation that causes IEM. In the aggregate, our results show that Ih unexpectedly has strikingly different effects in DRG neurons as compared to previously- and well-studied cardiac cells. Within DRG neurons where Nav1.7 is present, Ih reduces depolarizing sodium current inflow due to enhancement of Nav1.7 channel fast inactivation and creates additional damping action by reversal of Ih direction from depolarizing to hyperpolarizing close to the threshold for AP generation. These actions of Ih limit the firing of DRG neurons expressing WT Nav1.7 and reverse the hyperexcitability of DRG neurons expressing a gain-of-function Nav1.7 mutation that causes IEM. KEY POINTS: Hyperpolarization-activated cyclic nucleotide-gated (HCN) channels, the molecular determinants of hyperpolarization-activated current (Ih ) have been characterized as a 'pain pacemaker', and thus considered to be a potential molecular target for pain therapeutics. Dorsal root ganglion (DRG) neurons express Nav1.7, a channel that is not present in central neurons or cardiac tissue. Gain-of-function mutations (GOF) of Nav1.7 identified in inherited erythromelalgia (IEM), a human genetic model of neuropathic pain, produce DRG neuron hyperexcitability, which in turn produces severe pain. We found that Ih increases rheobase and reduces firing probability in small DRG neurons expressing WT Nav1.7, and demonstrate that the amplitude of subthreshold oscillations is reduced by Ih . We also demonstrate that Ih reverses the hyperexcitability of DRG neurons expressing a GOF Nav1.7 mutation (L858H) that causes IEM. Our results show that, in contrast to cardiac cells and CNS neurons, Ih acts to stabilize DRG neuron excitability and prevents excessive firing.

Keywords: HCN channels; Hodgkin-Huxley equations; Nav1.7; channelopathy; dynamic-clamp; inherited erythromelalgia; neuropathic pain.


Conflict of interest statement

Competing interests

None of the authors has a conflict of interest

Figures

Figure 1.
Figure 1.. Development and validation of Ih kinetic model in small diameter rat DRG neuron.
(a) Shown are representative recordings of inward currents (in black) in response to a 10-seconds long hyperpolarizing voltage steps ranged between −40 mV and −120 mV, applied in −10 mV increments from −40 mV holding potential, and followed by a voltage step to −70 mV to record tail currents; voltage protocol is shown on top. Recordings were made in control bath solution (upper panel) and in the presence of 100 µM ZD7288 (lower panel). Current traces recorded in control solution were fitted with a double-exponential function, the resulting fitting curves (red lines) shown overplayed on inward current traces. (b) Voltage- and time-dependent component of ZD7288-sensitive current (black) at −50, −60, −70, −80 and −90 mV test voltages (stimulation protocol is the same as above); to isolate time-dependent current from the instantaneous current, traces in control and in the presence of ZD-7288 were baseline-adjusted before subtraction. The red lines overlaid on current traces are Ih Hodgkin-Huxley models at the respective test voltages. (c) Time constants of the double-exponential fit of Ih traces plotted at the respective membrane voltages shown overplayed with the curves of fast (red) and slow (blue) time constants of the Ih Hodgkin-Huxley model. (d) Ih G/Gmax plotted at the respective membrane voltages overplayed with curves of m variables at steady-state of Hodgkin-Huxley kinetic model for fast (red) and slow (blue) components of Ih. (e) Amplitude of the fast component of Ih activation contributed half of the total Ih amplitude at a physiological range of membrane voltages for Ih activation. Shown is a ratio of fast-exponential amplitude to the sum of amplitudes of slow and fast components of the double-exponential fit of Ih (mean ± SD, n = 12).
Figure 2.
Figure 2.. Dynamically introduced Ih depolarizes neuronal RMP, reduces AP overshoot and AP maximal rise slope, and delays AP onset in response to a 10 ms depolarizing current pulse.
(a) Recordings of an AP in response to a 210 pA 10-ms long current injection in control (black trace) and after addition of Ih (red trace) or Ih(cAMP) (blue trace). Here and thereafter, Ih addition was done at Gmax = 5.6 nS for each slow and fast Ih components. Note changes in neuronal RMP, reduction of AP overshoot and prolongation of the delay to AP onset in response to dynamically applied Ih conductance. Threshold current in control was 180 pA, while the rheobase in +Ih and +Ih(cAMP) were both 200 pA. (b, upper panel) Shown are time plots of rates of voltage changes obtained from the respective membrane voltages plotted in (a). (b, lower panel) Rates of voltage changes from (b, upper panel) plotted as a function of membrane voltages. Evolutions of membrane voltages are denoted by arrow. Note a significant reduction of the rate of voltage change on AP rising phase and depolarization of threshold voltage in response to dynamically introduced Ih. (c) Traces of Nav1.7 WT activation m3 (upper panel), inactivation h (middle) and open probability m3hs (lower panel) calculated from the respective voltage traces shown in (a). (d) Nav1.7 WT (upper panel) and Ih (lower panel) currents calculated based on Hodgkin-Huxley equations, the currents were in response to the respective voltages shown in (a) (control, black traces; +Ih, red trace or +Ih(cAMP), blue trace).
Figure 3.
Figure 3.. Effect of DI Ih on small DRG neuron RMP, input resistance, rebound excitation and AP parameters.
Input resistance, RMP, rebound excitation and action potential parameters in small DRG neurons before and after DI Ih; the respective deltas are shown in violin plots. Means are indicated by green lines.
Figure 4.
Figure 4.. Dynamic addition of Ih results in reduction of membrane input resistance and in enhancement of rebound excitation.
(a-b) representative recordings of membrane voltage response to prolong hyperpolarizing currents injections (stimulation protocol is shown on upper inserts) from two neurons with slow (a) and fast (b) kinetics of membrane potential accommodation in control (black traces), +Ih (red traces) and +Ih (cAMP) (blue traces). Note a significant acceleration of the membrane repolarization and the appearance of a rebound excitation on membrane repolarization immediately after stimulation current step in the presence of DI Ih. A detailed analysis of the changes in membrane input resistance and rebound excitation is described in Fig.3; Table 1. (c-d) Shown are recordings of DI Ih performed in parallel with recordings of the respective membrane voltages shown in (a-b). (e-f) Shown are voltage-current plots of membrane voltages in response to a 0.5-s long hyperpolarizing current injections; measurements were taken at the end of hyperpolarizing current steps in control (black) and after DI Ih (red and blue).
Figure 5.
Figure 5.. Dynamic-clamp removal of Ih hyperpolarizes neuronal RMP, lowers AP rheobase, increases AP overshoot and AP maximal rise slope.
(a) Recordings of an AP in response to a 220 pA 10-ms long stimulus in control (black trace) and after Ih subtraction (0.25Gmax, green trace) or Ih addition (Gmax, red trace), where Gmax = 5.6 nS for each slow and fast Ih component. Threshold current was 190 pA in control, while 170 pA in -Ih and 210 pA in +Ih. (b, upper panel) Voltage derivatives calculated from the data in (a). (b, lower panel) Rates of voltage changes from (b, upper panel) plotted as a function of membrane voltages. Evolution of membrane voltage is denoted by arrow. Note a significant enhancement of the rate of voltage changes on both AP rising and falling phases and hyperpolarization of threshold voltage in response to Ih subtraction, while DI addition of Ih has an opposite effect. (c) Traces of Nav1.7 WT activation m3 (upper panel), inactivation h (middle) and open probability m3hs (lower panel) calculated from the respective voltage traces shown in (a). (d) Nav1.7 WT (upper panel) and Ih (lower panel) currents calculated based on Hodgkin-Huxley equations in response to the respective voltages shown in (a) (control, black traces; -Ih, green trace; +Ih, red trace).
Figure 6.
Figure 6.. DI addition of Ih reduces neuronal AP firing probability in response to repetitive stimuli.
Representative recordings of small DRG neuron AP firing in response to twenty 10-ms long depolarizing current steps applied at 10 Hz at sub-threshold 250 pA (a), threshold 275 pA pA (b) and supra-threshold 300–375 pA (c-e) stimuli applied in 25 pA increments in control (black traces, left panel), +Ih (red traces, middle panel) and +Ih (cAMP) (blue traces, right panel).
Figure 7.
Figure 7.. Ih activation reduces neuronal AP firing probability in response to repetitive stimuli.
Representative recordings of small DRG neuron AP firing in response to twenty 10-ms long 350 pA depolarizing current steps applied at 10 Hz in control (a), +Ih (b) and +Ih (cAMP) (c); threshold current was 275 pA. (d) Average number of APs fired by a population of small DRG neurons (n=13) in response to repetitive stimuli. AP firing probabilities were plotted at the respective stimulus amplitudes in control (black) and after DI +Ih (red) or +Ih (cAMP) (blue). Data are means ± SE, n = 13.
Figure 8.
Figure 8.. DI Ih alleviates spontaneous AP firing of small DRG neurons in IEM Nav1.7 L858H model of neuronal hyperexcitability.
Representative recordings from small diameter DRG neuron showing induction of spontaneous AP firing upon DI 252 nS Nav1.7WT/LH substitution (indicated by solid line on top) in control (a), during DI 0.25Gmax Ih subtraction (b), DI addition of Ih at Gmax (c) or Ih(cAMP) at Gmax, where Gmax = 5.6 nS for each slow and fast Ih component (d), and again in control (e). Voltage traces are shown on the left, while the respective traces of DI total currents are on the right panels.
Figure 9.
Figure 9.. Ih increases inter-spike intervals and reduces AP firing frequency in DI EM model of DRG neuron hyperexcitability.
(a) Histograms of inter-spike intervals from data represented in Fig.8 in control (black), during DI Ih subtraction (green), DI addition of Ih (red) or Ih(cAMP) (blue). Data were fitted by normal distribution functions and the resulting curves (coded by respective colors) are shown overplayed on the histograms. (b) Average neuronal firing frequencies (grey symbols) and their means due to DI 504 nS Nav1.7 WT/L858H substitution in control (black bar) and in the presence of DI Ih (red bar) or Ih(cAMP) (blue bar). Data are means ± SD, n = 7.
Figure 10.
Figure 10.. Ih-induced enhancement of Nav1.7 activation is negated by the respective augmentation of Nav1.7 inactivation in the DI IEM model of neuronal hyperexcitability.
(a) Representative recordings of small DRG neuron AP firing in response to 504 nS Nav1.7 WT/LH substitution in control (black trace), in the presence of DI Ih (red trace) or DI Ih(cAMP) (blue trace). (b-d) Time courses of Nav1.7 WT (b) and Nav1.7 L858H (c) Hodgkin-Huxley activation variables m3 and Nav1.7 inactivation variables h (d) calculated from the respective membrane voltage traces shown in (a). (e-f) Nav1.7 WT (e) and Nav1.7L858H (f) open probabilities m3hs calculated from (b-d). Color codes in (a-f) are as following: control (black traces), in the presence of DI Ih (red traces) or DI Ih(cAMP) (blue traces).
Figure 11.
Figure 11.. DI Ih results in reduction of Nav1.7 peak current amplitude and creates an outward current at the membrane voltages close to the threshold voltage.
(a) Recordings of AP firing in DI IEM model of small DRG neuron hyperexcitability in control (black trace), in the presence of DI Ih (red trace) or DI Ih(cAMP) (blue trace), same data as in Fig.10a. Inward sodium currents calculated from the respective voltage traces presented in (a) for Nav1.7 WT (b) and Nav1.7 L858H (c). (d) Shown are traces obtained by point-by-point subtractions of Nav1.7WT traces in (b) from the respective Nav1.7 L858H traces in (c), the results represent dynamic-clamp currents due to 504 nS Nav1.7 WT/L858H substitution. (e) Traces of DI Ih (red trace) or Ih(cAMP) (blue trace) during AP firing shown in (a). Note the outward (hyperpolarizing) current flow at voltages in the vicinity of AP threshold voltage. (f) Traces of total DI current calculated from the respective membrane voltage traces shown in (a): Nav1.7 WT/LH (black trace), Nav1.7 WT/LH + Ih (red trace) and Nav1.7 WT/LH + Ih (cAMP) (blue trace).
Figure 12.
Figure 12.. I-V evolution plots of Nav1.7WT, Nav1.7LH, Nav1.7(LH-WT), Ih and the net currents calculated during AP firing in Nav1.7L858H model.
(a) Membrane voltage derivative (rate of change) plotted at the respective membrane voltages. (b-f) I-V evolution plots of Nav1.7 WT (b), Nav1.7 L858H (c), Nav1.7 L858H-WT (d), Ih (red) and Ih(cAMP) (blue) (e) and the net (f) dynamic-clamp currents; the data obtained from the same recordings as presented in Fig.11. Shown are traces in control (black) and in the presence of DI Ih (red trace) or DI Ih(cAMP) (blue trace). Directions of evolution are denoted by arrows.
Figure 13.
Figure 13.. Ih decreases amplitude of subthreshold membrane potential oscillations in Nav1.7WT/L858H model of neuronal hyperexcitability.
Representative recordings of small DRG neuron membrane potential obtained in control (a), in the presence of Ih (b), in the presence of Ih(cAMP) (c) and again in control (d). Thick solid line on top denotes time interval when dynamic-clamp models were introduced. (e) Power spectrum of membrane potential oscillations recorded at the baseline when dynamic-clamp models were off (magenta trace) and during DI 252 nS Nav1.7 WT/L858H model in the absence (black trace) and presence of Ih (red trace) or Ih(cAMP) (blue trace). (f) Violin plots of peak-to-peak amplitudes of subthreshold membrane potential oscillations in DI Nav1.7 WT/L858H model of neuronal hyperexcitability. The average amplitudes calculated for 20 seconds period were (means ± SD): 4.1 ± 1.9 mV (n = 325), 2.7 ± 1.1 mV (n = 375) and 2.4 ± 1 mV (n = 341) in control (grey) and in the presence of DI Ih (red) or Ih(cAMP) (blue), respectively. Statistical significance of the difference between two means was calculated by One-Way ANOVA.

Similar articles

Cited by

References

    1. Acosta C, McMullan S, Djouhri L, Gao L, Watkins R, Berry C, Dempsey K & Lawson SN. (2012). HCN1 and HCN2 in Rat DRG neurons: levels in nociceptors and non-nociceptors, NT3-dependence and influence of CFA-induced skin inflammation on HCN2 and NT3 expression. PLoS One 7, e50442. - PMC - PubMed
    1. Alles SRA & Smith PA. (2021). Peripheral Voltage-Gated Cation Channels in Neuropathic Pain and Their Potential as Therapeutic Targets. Front Pain Res (Lausanne) 2, 750583. - PMC - PubMed
    1. Amir R, Liu CN, Kocsis JD & Devor M. (2002). Oscillatory mechanism in primary sensory neurones. Brain 125, 421–435. - PubMed
    1. Amir R, Michaelis M & Devor M. (1999). Membrane potential oscillations in dorsal root ganglion neurons: role in normal electrogenesis and neuropathic pain. J Neurosci 19, 8589–8596. - PMC - PubMed
    1. Bader CR & Bertrand D. (1984). Effect of changes in intra- and extracellular sodium on the inward (anomalous) rectification in salamander photoreceptors. J Physiol 347, 611–631. - PMC - PubMed

Publication types

Substances

LinkOut - more resources