. 2023 Dec 15;133(24):e171237.
doi: 10.1172/JCI171237.

Profilin1 is required for prevention of mitotic catastrophe in murine and human glomerular diseases

Affiliations

Profilin1 is required for prevention of mitotic catastrophe in murine and human glomerular diseases

Xuefei Tian et al. J Clin Invest. .

Abstract

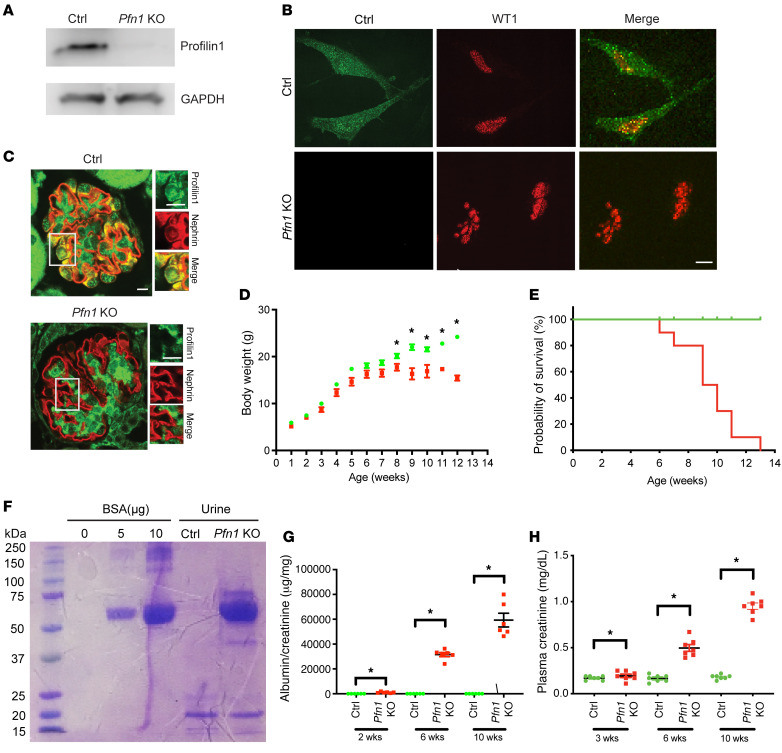
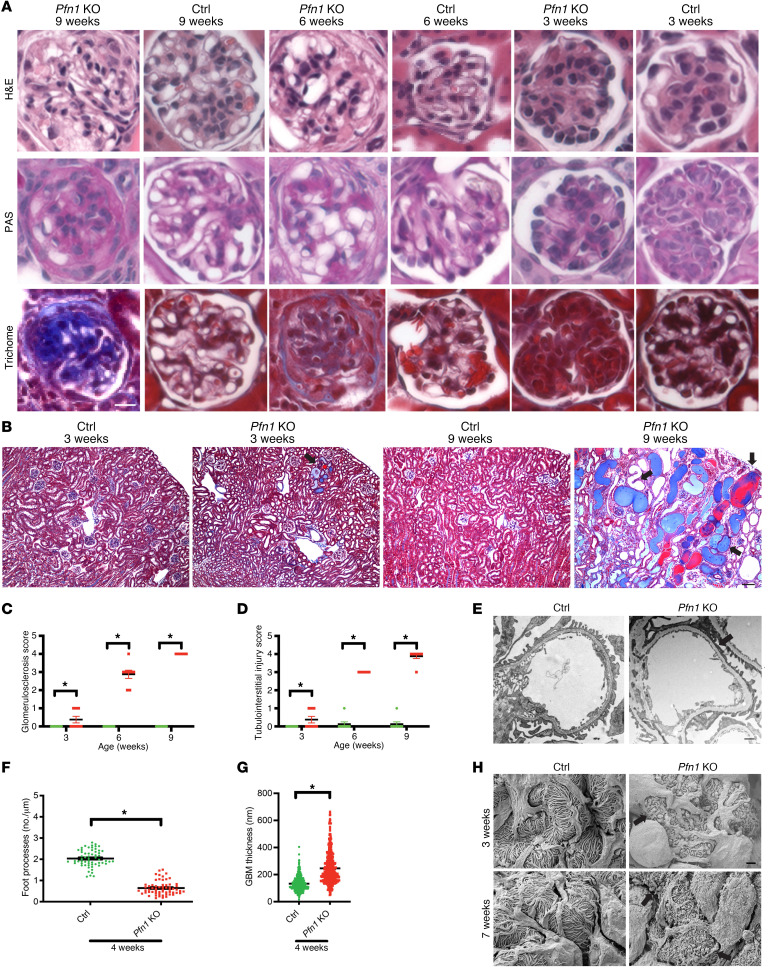
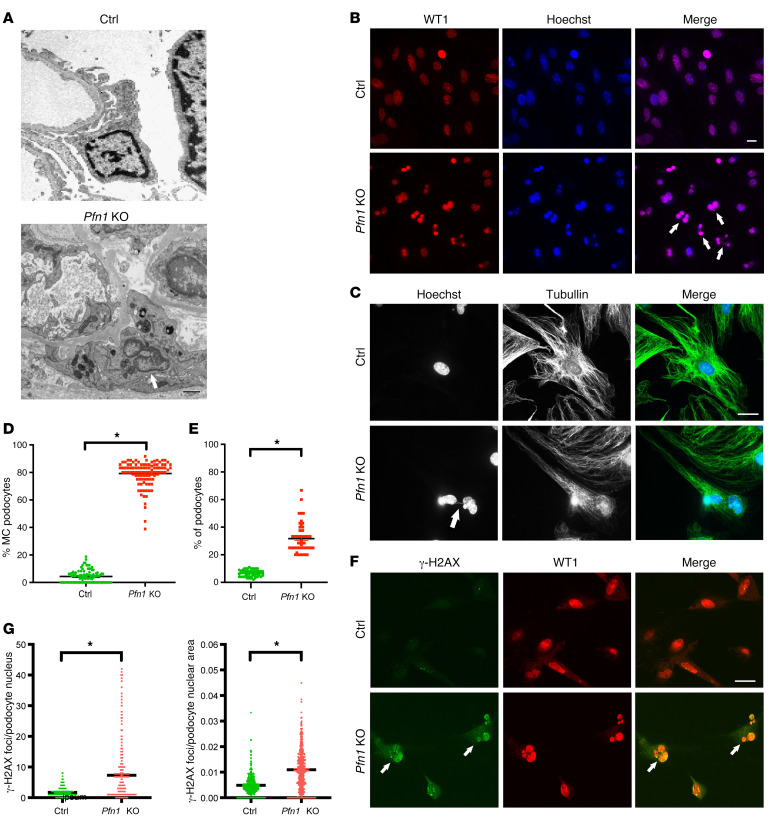
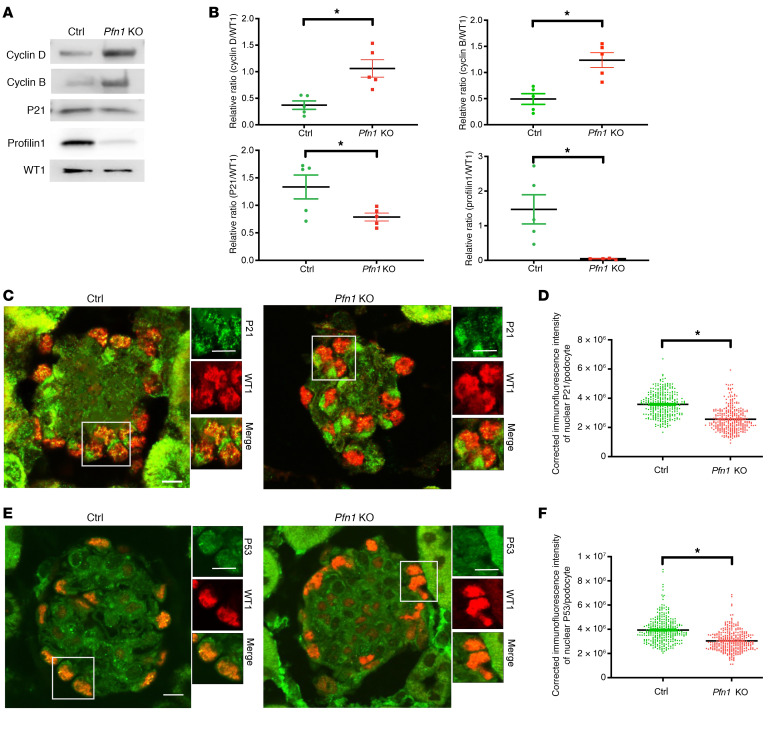
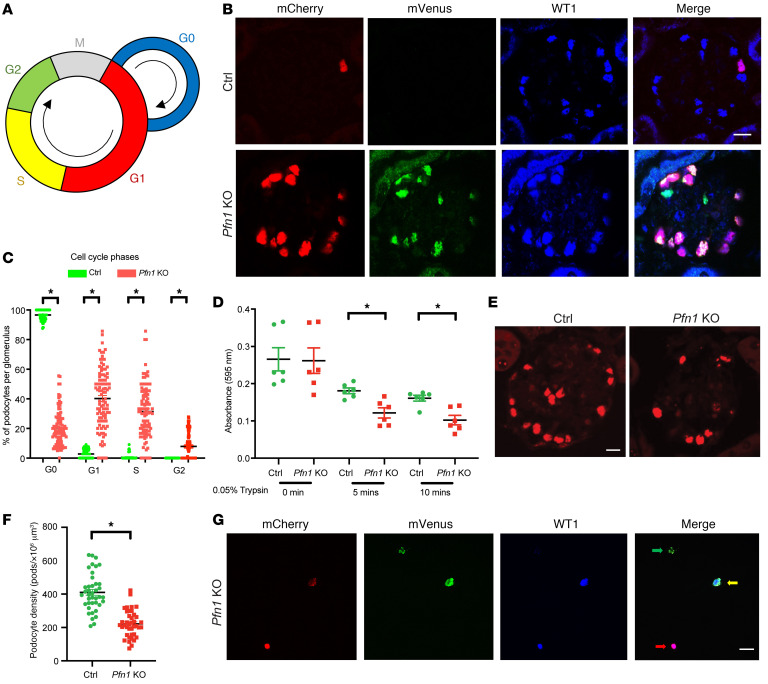
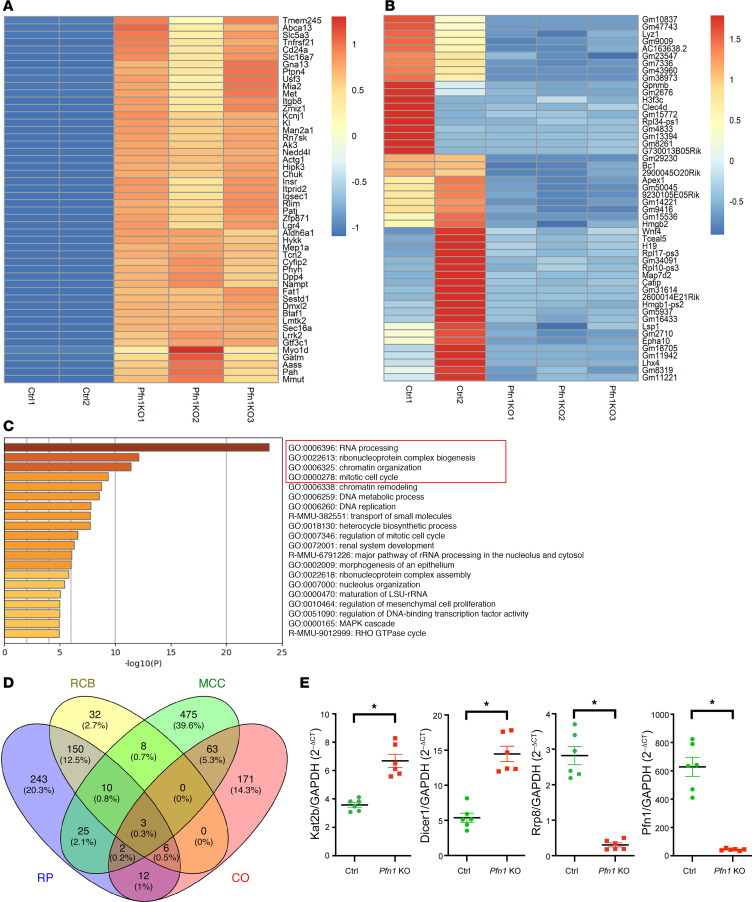
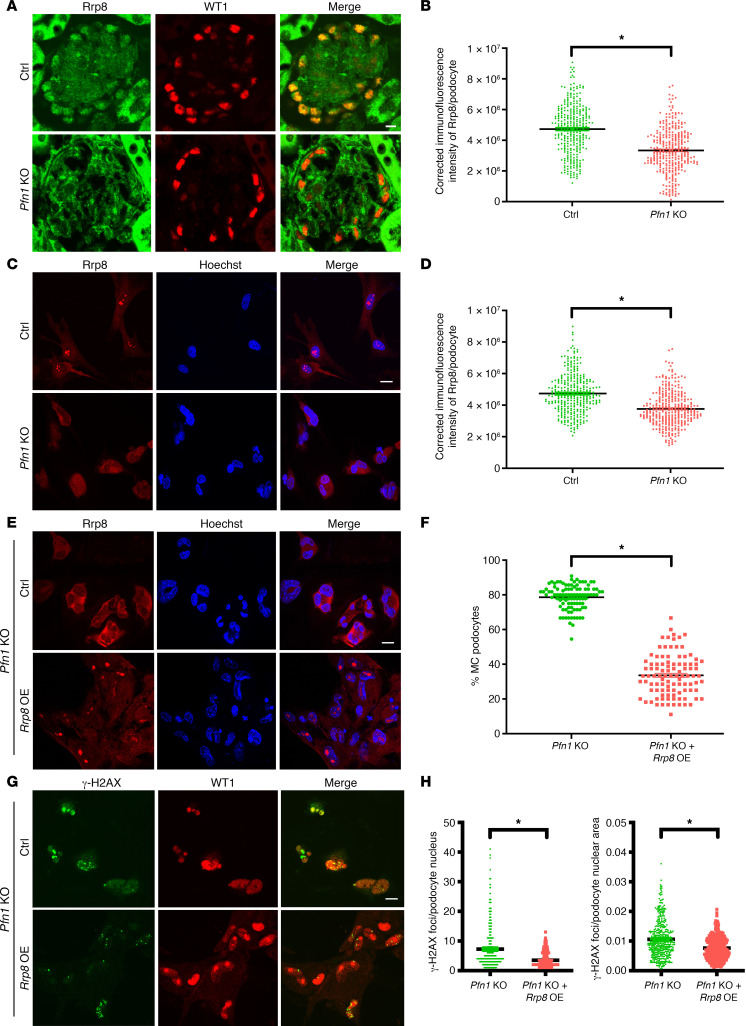
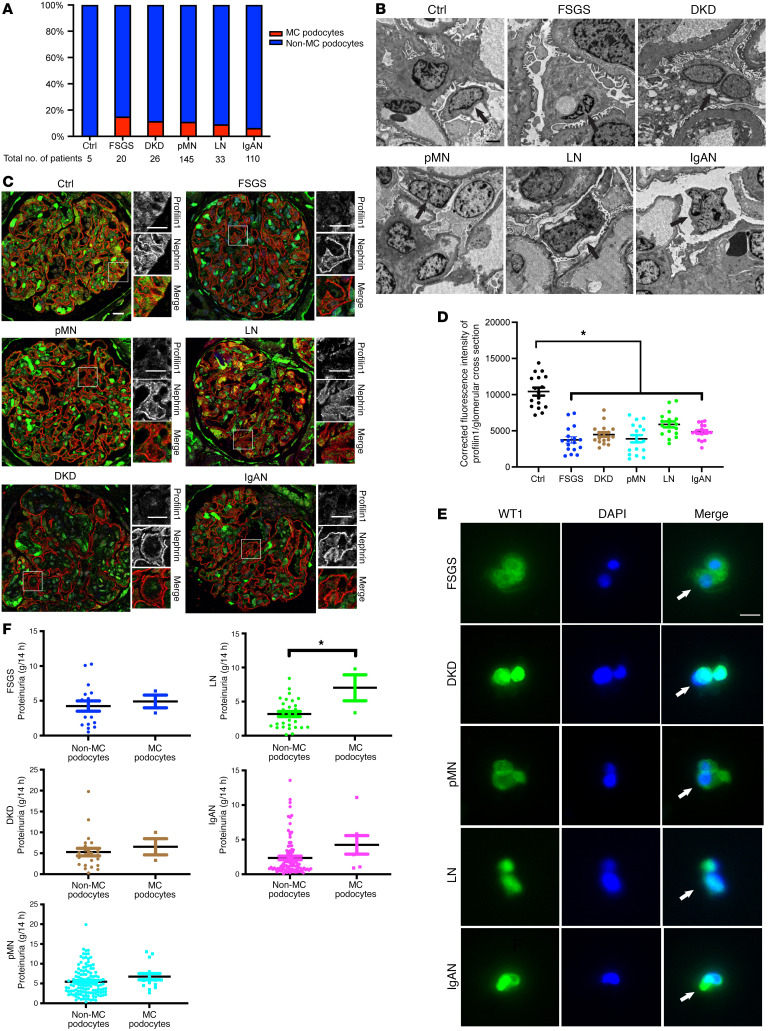
The progression of proteinuric kidney diseases is associated with podocyte loss, but the mechanisms underlying this process remain unclear. Podocytes reenter the cell cycle to repair double-stranded DNA breaks. However, unsuccessful repair can result in podocytes crossing the G1/S checkpoint and undergoing abortive cytokinesis. In this study, we identified Pfn1 as indispensable in maintaining glomerular integrity - its tissue-specific loss in mouse podocytes resulted in severe proteinuria and kidney failure. Our results suggest that this phenotype is due to podocyte mitotic catastrophe (MC), characterized histologically and ultrastructurally by abundant multinucleated cells, irregular nuclei, and mitotic spindles. Podocyte cell cycle reentry was identified using FUCCI2aR mice, and we observed altered expression of cell-cycle associated proteins, such as p21, p53, cyclin B1, and cyclin D1. Podocyte-specific translating ribosome affinity purification and RNA-Seq revealed the downregulation of ribosomal RNA-processing 8 (Rrp8). Overexpression of Rrp8 in Pfn1-KO podocytes partially rescued the phenotype in vitro. Clinical and ultrastructural tomographic analysis of patients with diverse proteinuric kidney diseases further validated the presence of MC podocytes and reduction in podocyte PFN1 expression within kidney tissues. These results suggest that profilin1 is essential in regulating the podocyte cell cycle and its disruption leads to MC and subsequent podocyte loss.

Keywords: Cell Biology; Cell cycle; Nephrology.


Figures

Figure 1
Figure 1. Generation of podocyte-specific Pfn1-KO mice results in severe proteinuria and kidney failure.
(A) Representative immunoblot images of profilin1 expression in primary podocytes freshly isolated from littermate control (Ctrl) and Pfn1-KO mice (age P7). (B) Representative immunofluorescence images of profilin1 (green) and WT1 (red) in control and Pfn1-KO primary podocytes. Scale bar: 10 μm. (C) Representative immunofluorescence images of profilin1 (green) and nephrin (red) on kidney sections of control and Pfn1-KO mice (age 3 weeks). Scale bars: 10 μm. (D) Pfn1-KO mice (red) failed to gain body weight by 8 weeks of age compared with control mice (green). n = 9 mice. *P < 0.05 vs. control. (E) The survival curve of Pfn1-KO mice (red) demonstrates approximately 90% death by 12 weeks of age. n = 8 mice. (F) SDS-PAGE (Coomassie blue staining) of standard BSA and of urine samples from Pfn1-KO mice at 4 weeks of age demonstrates albuminuria. Equal volumes of standard BSA and urine (4 μL) were loaded in each lane. (G) Quantification of urine albumin normalized to creatinine at 2, 6, and 10 weeks of age. n = 6 mice. *P < 0.05 vs. control. (H) Elevated plasma creatinine in Pfn1-KO mice at 3, 6, and 10 weeks of age. *P < 0.05 vs. control. Statistics were analyzed via a 2-tailed t test.
Figure 2
Figure 2. Loss of podocyte Pfn1 results in progressive glomerulosclerosis and tubulointerstitial injury.
(A) Representative light microscopy images (H&E, periodic acid–Schiff [PAS], and Masson’s trichrome) of control and Pfn1-KO mouse glomeruli at 3, 6, and 9 weeks of age. Scale bar: 25 μm. (B) Representative Masson’s trichrome staining in control and Pfn1-KO mouse kidneys at 3 and 9 weeks of age. Arrowheads depict dilated tubules, proteinaceous casts, and interstitial fibrosis. Scale bar: 100 μm. (C) Quantification of glomerulosclerosis in A. n = 8 mice. *P < 0.05 vs. control. (D) Quantification of tubulointerstitial injuries in B. n = 8 mice. *P < 0.05 vs. control. (E) Representative transmission electron micrography (TEM) of foot processes in control and Pfn1-KO mice at 4 weeks of age. Arrowheads depict podocyte foot process effacement. Scale bar: 1 μm. (F) Quantification of the number of foot processes per micrometer of GBM in E. n = 4 mice, *P < 0.05 vs. control. (G) Quantification of GBM thickness in E. n = 4 mice. *P < 0.05 vs. control. (H) Representative scanning electron micrography illustrating the ultrastructure of the glomerulus of control and Pfn1-KO mice at 3 and 7 weeks of age. Arrowheads demonstrate loss of foot process interdigitations. Scale bar: 1 μm. Statistics were analyzed via a 2-tailed t test.
Figure 3
Figure 3. Loss of podocyte Pfn1 results in morphologic MC appearance, chromosomal instability, and dsDNA damage.
(A) Representative images of transmission electron micrography demonstrate abnormal MC podocytes in Pfn1-KO mice (arrow) compared with control glomeruli at 4 weeks of age. Scale bar: 1 μm. (B) Immunofluorescence images of primary podocytes isolated from control and Pfn1-KO mice at P7 stained with WT1 (red, podocyte marker) and Hoechst (blue, DNA marker) showing abnormal MC podocytes in Pfn1-KO mice (arrow) compared with control podocytes. Scale bar: 20 μm. (C) Immunofluorescence images of primary culture podocytes isolated from control and Pfn1-KO mice stained with Hoechst and anti-tubulin antibody showing the chromosome bridge (arrow) in a MC Pfn1-KO podocyte. Scale bar: 20 μm. (D) Quantification of the percentage of MC podocytes per field of view in B. Total of 100 fields of view in 5 independent experiments. (E) Quantification of the percentage of chromosome bridge per field of view in C. n = 5 independent experiments. *P < 0.05 vs. control. (F) Immunofluorescence images of primary culture podocytes stained with γ-H2AX (green, double-strand breaks [DSBs] marker) and WT1 (red) showing abnormal MC podocytes in Pfn1-KO mice, as indicated by the arrows. Scale bar: 20 μm. (G) Quantification of γH2AX foci per podocyte nucleus (left) and per podocyte nuclear area (right) in F. Total of 400 cells in 5 independent experiments. *P < 0.05 vs. control. Statistics were analyzed via a 2-tailed t test.
Figure 4
Figure 4. Loss of podocyte Pfn1 activates the DNA damage response.
(A) Representative immunoblot images of cyclin D1, cyclin B1, P21, profilin1, and WT1 as loading control in control and Pfn1-KO mouse primary podocytes. (B) Quantification of immunoblots in A. n = 5 independent experiments. (C) Representative immunofluorescence image of P21 expression in control and Pfn1-KO mouse glomeruli at 5 weeks of age stained with P21 (green) and WT1 (red). Scale bar: 20 μm. (D) Quantification of immunofluorescence intensity of nuclear P21 per podocyte in C. Total of 310 podocytes in 5 mice. (E) Representative immunofluorescence images of P53 in control and Pfn1-KO mouse glomeruli at 5 weeks of age stained with P53 (green) and WT1 (red). Scale bar: 20 μm. (F) Quantification of immunofluorescence intensity of nuclear P53 per podocyte in E. Total of 310 podocytes in 5 different mice. *P < 0.05 vs. control. Statistics were analyzed via a 2-tailed t test.
Figure 5
Figure 5. Loss of podocyte Pfn1 results in podocytopenia and cell cycle entry.
(A) A schematic representing cell cycle phase visualization by different colors in podocytes from the R26Fucci2aR Pfn1-KO mice. G1 phase nuclei (mCherry, red); S phase nuclei (both mCherry and mVenus, yellow); and G2 phase nuclei (mVenus, green). (B) Representative immunofluorescence images of podocytes in control-FUCCI and Pfn1-KO-FUCCI glomeruli at 4 weeks of age stained with Cherry (red), Venus (green), and WT1 (blue). Scale bar: 20 μm. (C) Quantification of the distribution of podocytes in cell cycle phase in B. Total of 100 glomeruli in 5 different mice. (D) Primary podocytes isolated from control and Pfn1-KO mice demonstrated a significant decrease in adhesion after plating for 5 minutes and 10 minutes on the collagen type I–coated plates. n = 6 independent experiments. (E) Representative immunofluorescence images of podocytes in control and Pfn1-KO glomeruli at 7 weeks of age stained with WT1 (red). Scale bar: 20 μm. (F) Quantification of podocyte density in glomeruli in E. Total of 40 glomeruli from 5 different mice. (G) Representative immunofluorescence images of urinary podocytes from control and Pfn1-KO mice at 4 weeks of age stained with mCherry (red), mVenus (green), and WT1 (blue). G1 phase podocyte nuclei (red arrow), S phase podocyte nuclei (yellow arrow), and G2 phase podocyte nuclei (green arrow) were depicted. Scale bar: 20 μm. *P < 0.05 vs. control. Statistics were analyzed via a 2-tailed t test.
Figure 6
Figure 6. Differentially expressed genes analyzed by podocyte-specific RNA-Seq in Pfn1-KO TRAP mice.
(A and B) Heatmap representing color-coding of the highest upregulated (A) and downregulated (B) differentially expressed genes (DEGs) in podocytes analyzed by Z ratio in Pfn1-KO translating ribosome affinity purification (Pfn1-KO TRAP) mice compared with control TRAP mice at 3 weeks of age. n = 2 samples in control and n = 3 samples in Pfn1 KO. Purified 3-mouse podocyte mixtures were used as 1 sample to ensure enough podocyte yields for RNA-Seq analysis. (C) The top significant enriched signaling pathways according to GO and KEGG pathways. The signaling pathways in the red tangle depict the top 4 signaling pathways. (D) Three shared DEGs involved in these top 4 signaling pathways were analyzed by Venny 2.1. RP, RNA processing; RCB, ribonucleoprotein complex biogenesis; CO, chromatin organization; MCC, mitotic cell cycle. (E) Real-time PCR of the primary control and Pfn1-KO podocytes for validation of these 3 candidates DEGs, including Kat2b, Dicer1, and Rrp8 from D. n = 6. *P < 0.05 vs. control. Statistics were analyzed via a 2-tailed t test.
Figure 7
Figure 7. Overexpression of Rrp8 mitigates DNA damage and improves MC appearance in Pfn1-KO podocytes.
(A) Representative immunofluorescence images of podocytes in control and Pfn1-KO glomeruli at 5 weeks of age stained with Rrp8 (green) and WT1 (red). Scale bar: 20 μm. (B) Quantification of immunofluorescence intensity of Rrp8 per podocyte in A. Total of 320 podocytes in 6 different mice. (C) Representative immunofluorescence images of podocytes isolated from control and Pfn1-KO mice at P7 stained with Rrp8 (red) and Hoechst (blue). Scale bar: 20 μm. (D) Quantification of immunofluorescence intensity of Rrp8 per podocyte in C. Total of 320 podocytes in 5 independent experiments. (E and G) Representative immunofluorescence images of podocyte isolated from Pfn1-KO mouse at P7 transduced with mouse Rrp8 lentiviral activation particles or control particles (Ctrl), followed by staining with Rrp8 (red) and Hoechst (blue), as shown in E, or γH2AX (green) and WT1 (red), as shown in G. Scale bar: 20 μm. (F) Quantification of the percentage of MC podocytes per field of view in E. Total of 100 fields of view in 5 independent experiments. (H) Quantification of γH2AX foci per podocyte nucleus (left) and per podocyte nuclear area (right) in G. Total of 400 cells in 5 independent experiments. *P < 0.05 vs. control. Statistics were analyzed via a 2-tailed t test. OE, overexpression.
Figure 8
Figure 8. Patients with proteinuric kidney disease demonstrate reduced podocyte PFN1 expression and MC.
(A) The percentage of patients with MC podocytes observed in kidney biopsy specimens using transmission electron microscopy (TEM) in patients with nonglomerular disease following nephrectomy (control; 0 of 5 patients, 0%), patients with focal segmental glomerulosclerosis (FSGS; 3 of 20 patients, 15%), patients with diabetic kidney disease (DKD; 3 of 26 patients, 11.5%), patients with primary membranous nephropathy (pMN; 16 of 145 patients, 11%), patients with lupus nephritis (LN; 3 of 33 patients, 9.1%), and patients with IgA nephropathy (IgAN; 7 of 110 patients, 6.4%) hospitalized between September 2019 and August 2022. (B) Representative TEM images of kidney biopsy specimens. Mononucleated podocytes in control and MC podocytes in patients with FSGS, DKD, pMN, LN, and IgAN are depicted with arrows. Scale bar: 2 μm. (C) Representative immunofluorescence images of glomeruli in control patients and patients with FSGS, DKD, pMN, LN, and IgAN with MC podocytes observed with TEM stained with profilin1 (green) and nephrin (red). Scale bar: 20 μm. (D) Quantification of C examining mean immunofluorescence intensity of profilin1 in the glomeruli. Total of 17 glomeruli in 3 patients from each group. *P < 0.05. Statistics were analyzed via a 1-way ANOVA with Dunnett’s correction. (E) Representative immunofluorescence images of urine samples in patients with FSGS, DKD, pMN, LN, and IgAN with MC podocytes stained with WT1 (green) and DAPI (blue). Arrows denote multinuclei. Scale bar: 20 μm. (F) Quantification of urine protein excretion in patients with FSGS, DKD, pMN, LN, and IgAN at the time of kidney biopsy. MC podocytes and non-MC podocytes were observed with TEM individually in each group.*P < 0.05. Statistics were analyzed via a 2-tailed t test.

Comment in

  • The loss of profilin 1 is catastrophic to podocytes

References

    1. Tian X, Ishibe S. Targeting the podocyte cytoskeleton: from pathogenesis to therapy in proteinuric kidney disease. Nephrol Dial Transplant. 2016;31(10):1577–1583. doi: 10.1093/ndt/gfw021. - DOI - PMC - PubMed
    1. Medina Rangel PX, et al. New insights into the immunity and podocyte in glomerular health and disease: from pathogenesis to therapy in proteinuric kidney disease. Integr Med Nephrol Androl. 2021;8(1):5. doi: 10.4103/imna.imna_26_21. - DOI
    1. Trimarchi H. Mechanisms of podocyte detachment, podocyturia, and risk of progression of glomerulopathies. Kidney Dis (Basel) 2020;6(5):324–329. doi: 10.1159/000507997. - DOI - PMC - PubMed
    1. Vogelmann SU, et al. Urinary excretion of viable podocytes in health and renal disease. Am J Physiol Renal Physiol. 2003;285(1):F40–F48. doi: 10.1152/ajprenal.00404.2002. - DOI - PMC - PubMed
    1. Pippin JW, et al. Upregulated PD-1 signaling antagonizes glomerular health in aged kidneys and disease. J Clin Invest. 2022;132(16):e156250. doi: 10.1172/JCI156250. - DOI - PMC - PubMed

Publication types