. 2023 Oct 17;18(10):e0293077.
doi: 10.1371/journal.pone.0293077. eCollection 2023.

Cost-effectiveness of incorporating Ebola prediction score tools and rapid diagnostic tests into a screening algorithm: A decision analytic model

Affiliations

Cost-effectiveness of incorporating Ebola prediction score tools and rapid diagnostic tests into a screening algorithm: A decision analytic model

Antoine Oloma Tshomba et al. PLoS One. .

Abstract

Background: No distinctive clinical signs of Ebola virus disease (EVD) have prompted the development of rapid screening tools or called for a new approach to screening suspected Ebola cases. New screening approaches require evidence of clinical benefit and economic efficiency. As of now, no evidence or defined algorithm exists.

Objective: To evaluate, from a healthcare perspective, the efficiency of incorporating Ebola prediction scores and rapid diagnostic tests into the EVD screening algorithm during an outbreak.

Methods: We collected data on rapid diagnostic tests (RDTs) and prediction scores' accuracy measurements, e.g., sensitivity and specificity, and the cost of case management and RDT screening in EVD suspect cases. The overall cost of healthcare services (PPE, procedure time, and standard-of-care (SOC) costs) per suspected patient and diagnostic confirmation of EVD were calculated. We also collected the EVD prevalence among suspects from the literature. We created an analytical decision model to assess the efficiency of eight screening strategies: 1) Screening suspect cases with the WHO case definition for Ebola suspects, 2) Screening suspect cases with the ECPS at -3 points of cut-off, 3) Screening suspect cases with the ECPS as a joint test, 4) Screening suspect cases with the ECPS as a conditional test, 5) Screening suspect cases with the WHO case definition, then QuickNavi™-Ebola RDT, 6) Screening suspect cases with the ECPS at -3 points of cut-off and QuickNavi™-Ebola RDT, 7) Screening suspect cases with the ECPS as a conditional test and QuickNavi™-Ebola RDT, and 8) Screening suspect cases with the ECPS as a joint test and QuickNavi™-Ebola RDT. We performed a cost-effectiveness analysis to identify an algorithm that minimizes the cost per patient correctly classified. We performed a one-way and probabilistic sensitivity analysis to test the robustness of our findings.

Results: Our analysis found dual ECPS as a conditional test with the QuickNavi™-Ebola RDT algorithm to be the most cost-effective screening algorithm for EVD, with an effectiveness of 0.86. The cost-effectiveness ratio was 106.7 USD per patient correctly classified. The following algorithms, the ECPS as a conditional test with an effectiveness of 0.80 and an efficiency of 111.5 USD per patient correctly classified and the ECPS as a joint test with the QuickNavi™-Ebola RDT algorithm with an effectiveness of 0.81 and a cost-effectiveness ratio of 131.5 USD per patient correctly classified. These findings were sensitive to variations in the prevalence of EVD in suspected population and the sensitivity of the QuickNavi™-Ebola RDT.

Conclusions: Findings from this study showed that prediction scores and RDT could improve Ebola screening. The use of the ECPS as a conditional test algorithm and the dual ECPS as a conditional test and then the QuickNavi™-Ebola RDT algorithm are the best screening choices because they are more efficient and lower the number of confirmation tests and overall care costs during an EBOV epidemic.


Conflict of interest statement

The authors declare that they have no competing interests

Figures

Fig 1
Fig 1. Decision tree for eight competing algorithms for the screening of Ebola virus disease (EVD).
This is a reduced tree displayed. Not all the branch sequences are displayed in the graph. The non-displayed ones follow the same sequence, e.g., as one test to screen Ebola suspects or combining/sequencing two tests to screen Ebola suspects (thus, the same as the two examples of possible scenarios displayed in the figure). Algorithms 1, 2, and 3 use a single screening test; their visual representations are similar to the branch shown on the decision branch of algorithm 4. Algorithms 6, 7, and 8 use two sequencing screening tests; their visual presentations look like this, shown in this format on algorithm 5’s branch. QuickNavi™-Ebola RDT is used after the first screening test in algorithms with two screening tests. EVD = Ebola virus disease; ECPS = extended clinical prediction score; WHO = World health organization.
Fig 2
Fig 2. Variations in cost-effectiveness ratios of eight Ebola screening algorithms as a function of prevalence of Ebola virus disease in suspected population and sensitivities of the ECPS as a joint or conditional test, and the QuickNavi™-Ebola RDT.
A is the effect of variation in the prevalence of the Ebola virus disease on the efficiency of algorithms. B is the effect of variation in the sensitivity of the ECPS as a joint test on the efficiency of algorithms. C is the effect of variation in the sensitivity of the ECPS as a conditional test on the efficiency of algorithms. D is the effect of variation in the sensitivity of the QuickNavi™-Ebola RDT on the Efficiency of algorithms on the Efficiency of algorithms.
Fig 3
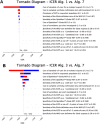
Fig 3. Tornado diagram presenting One-way sensitivity analysis of ICER comparing the combining ECPS as a conditional test with QuickNavi™–Ebola RDT algorithm (Algorithm 7) to WHO case definition for the suspect algorithm (Algorithm 1) and the ECPS as a joint test algorithm (Algorithm 3).
Vertical line represents incremental effects when using baseline estimates of all parameters. Not all the parameters tested in the sensitivity analysis are visible on the plot. All key variables were included in the sensitivity analysis. Alg. = algorithm; ECPS = extended clinical prediction score; ICER = incremental cost-effectiveness ratio; RDT = rapid diagnostic test; blue: decrease; red: increase.
Fig 4
Fig 4. Two-way sensitivity analysis comparing the net health benefit of EVD screening algorithms by varying both the cost of the QuickNavi™-Ebola RDT and the cost of the standard of care.
The figure shows the two-way sensitivity analysis based on variations in the cost of the QuickNavi™-Ebola RDT and the cost of the SOC at a willingness-to-pay of USD 584.1. For these, a willingness-to-pay of USD 1168.2 and a willingness-to-pay of USD 1752.3 do not appear here, as they display this at a willingness-to-pay of USD 584.1.
Fig 5
Fig 5. Cost-effectiveness scatterplot depicting the probabilistic sensitivity analysis (PSA) for 1000 iterations of simulated cost-effectiveness ratio of 8 algorithms for screening Ebola virus disease suspects.
Fig 6
Fig 6. Cost-effectiveness acceptability curve comparing Algorithm 1 (screening with the WHO case definition) to seven Ebola screening algorithms.
The curves depict the probability of being cost-effective for each screening algorithm. The curves show that the probability that integrating of the dual ECPS as a conditional test with QuickNavi™–Ebola RDT (”Algorithm 7”) into the screening algorithm for Ebola suspects compared to any other screening algorithms at varying thresholds WTP. "Algorithm 4" was cost-effective in about 31% of simulations at WTP less than USD 200, and in 0% of simulations at WTP USD 300; "Algorithm 7" was cost-effective in 68.4% of simulations at WTP USD 100, in 97.2% of simulations at WTP USD 350, and in 100% of simulations at WTP of USD 500 and higher. Abbreviations: Alg. = algorithm; EVD = Ebola virus disease; ECPS = extended clinical prediction score; WTP = willingness-to-pay.
Fig 7
Fig 7. Incremental cost-effectiveness of each algorithm compared to the WHO case definition-screening algorithm (Algorithm 1) during iterations of Monte Carlo simulation.
The ellipse represents 95% confidence points. The diagonal dashed line represents ICERs at a WTP threshold of USD 50 000. Points to the right of this dashed line are considered cost-effective. Dotted horizontal line shows incremental cost of USD 0. Points below this line represent iterations in which the given algorithm was cost- saving in 100% of simulation compared to Algorithm 1. This figure does not present all simulations of algorithms compared to algorithm 1. Those not presented here were cost- saving in 100% of simulation compared to algorithm 1 at this WTP threshold. Green points: ICERs that fall below the WTP line in Monte Carlo simulations, the maximum acceptable ICER (the algorithm is considered cost-effective); Red points: ICERs that fall above the WTP line, the maximum acceptable ICER (the algorithm is considered costly and less effective). Abbreviations: Alg. = algorithm; EVD = Ebola virus disease; ECPS = extended clinical prediction score; WTP = willingness-to-pay; ICER = incremental cost-effectiveness ratio.
Fig 8
Fig 8. Incremental cost-effectiveness of each algorithm compared to WHO case definition algorithm (Algorithm 1) during 1000 iterations of Monte Carlo simulation at a WTP threshold of USD 584.1.
The ellipse represents 95% confidence points. The diagonal dashed line represents ICERs at a WTP threshold of USD 584.1. Points to the right of this dashed line are considered cost-effective. Dotted horizontal line shows incremental cost of USD 0. Points below this line represent iterations in which the given algorithm was cost- saving compared to Algorithm 1. This figure does not present all simulations of algorithms compared to algorithm 1. Those not presented here were cost- saving in 100% of simulation compared to algorithm 1 at this WTP threshold. Green points: ICERs that fall below the WTP line in Monte Carlo simulations, the maximum acceptable ICER (the algorithm is considered cost-effective); Red points: ICERs that fall above the WTP line, the maximum acceptable ICER (the algorithm is considered costly and less effective). Abbreviations: Alg. = algorithm; WTP = willingness-to-pay; ICER = incremental cost-effectiveness ratio.

References

    1. Rosello A, Mossoko M, Flasche S, Van Hoek AJ, Mbala P, Camacho A, et al. Ebola virus disease in the Democratic Republic of the Congo, 1976–2014. Elife. 2015;4. Epub 20151103. doi: 10.7554/eLife.09015 ; PubMed Central PMCID: PMC4629279. - DOI - PMC - PubMed
    1. W. H. O. Ebola Response Team, Aylward B, Barboza P, Bawo L, Bertherat E, Bilivogui P, et al. Ebola virus disease in West Africa—the first 9 months of the epidemic and forward projections. N Engl J Med. 2014;371(16):1481–95. Epub 20140922. doi: 10.1056/NEJMoa1411100 ; PubMed Central PMCID: PMC4235004. - DOI - PMC - PubMed
    1. Aruna A, Mbala P, Minikulu L, Mukadi D, Bulemfu D, Edidi F, et al. Ebola Virus Disease Outbreak—Democratic Republic of the Congo, August 2018-November 2019. MMWR Morb Mortal Wkly Rep. 2019;68(50):1162–5. Epub 20191220. doi: 10.15585/mmwr.mm6850a3 ; PubMed Central PMCID: PMC6936163. - DOI - PMC - PubMed
    1. Pigott DM, Golding N, Mylne A, Huang Z, Henry AJ, Weiss DJ, et al. Mapping the zoonotic niche of Ebola virus disease in Africa. Elife. 2014;3:e04395. Epub 20140908. doi: 10.7554/eLife.04395 ; PubMed Central PMCID: PMC4166725. - DOI - PMC - PubMed
    1. Pigott DM, Golding N, Mylne A, Huang Z, Weiss DJ, Brady OJ, et al. Mapping the zoonotic niche of Marburg virus disease in Africa. Trans R Soc Trop Med Hyg. 2015;109(6):366–78. Epub 20150327. doi: 10.1093/trstmh/trv024 ; PubMed Central PMCID: PMC4447827. - DOI - PMC - PubMed

Publication types