. 2023 Dec 1;325(6):G539-G555.
doi: 10.1152/ajpgi.00240.2022. Epub 2023 Oct 17.

Functional and molecular profiling of fasted piglets reveals decreased energy metabolic function and cell proliferation in the small intestine

Affiliations

Functional and molecular profiling of fasted piglets reveals decreased energy metabolic function and cell proliferation in the small intestine

Anna F Bekebrede et al. Am J Physiol Gastrointest Liver Physiol. .

Abstract

The small intestine requires energy to exert its important role in nutrient uptake and barrier function. Pigs are an important source of food and a model for humans. Young piglets and infants can suffer from periods of insufficient food intake. Whether this functionally affects the small intestinal epithelial cell (IEC) metabolic capacity and how this may be associated with an increased vulnerability to intestinal disease is unknown. We therefore performed a 48-h fasting intervention in young piglets. After feeding a standard weaning diet for 2 wk, 6-wk-old piglets (n = 16/group) were fasted for 48 h, and midjejunal IECs were collected upon euthanasia. Functional metabolism of isolated IECs was analyzed with the Seahorse XF analyzer and gene expression was assessed using RNA-sequencing. Fasting decreased the mitochondrial and glycolytic function of the IECs by 50% and 45%, respectively (P < 0.0001), signifying that overall metabolic function was decreased. The RNA-sequencing results corroborated our functional metabolic measurements, showing that particularly pathways related to mitochondrial energy production were decreased. Besides oxidative metabolic pathways, decreased cell-cycle progression pathways were most regulated in the fasted piglets, which were confirmed by 43% reduction of Ki67-stained cells (P < 0.05). Finally, the expression of barrier function genes was reduced upon fasting. In conclusion, we found that the decreased IEC energy metabolic function in response to fasting is supported by a decreased gene expression of mitochondrial pathways and is likely linked to the observed decreased intestinal cell proliferation and barrier function, providing insight into the vulnerability of piglets, and infants, to decreased food intake.NEW & NOTEWORTHY Fasting is identified as one of the underlying causes potentiating diarrhea development, both in piglets and humans. With this study, we demonstrate that fasting decreases the metabolism of intestinal epithelial cells, on a functional and transcriptional level. Transcriptional and histological data also show decreased intestinal cell proliferation. As such, fasting-induced intestinal energy shortage could contribute to intestinal dysfunction upon fasting.

Keywords: cell proliferation; fasting; intestine; metabolic function; mitochondria.


Conflict of interest statement

No conflicts of interest, financial or otherwise, are declared by the authors.

Figures

None
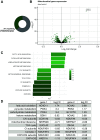
Graphical abstract
Figure 1.
Figure 1.
Macroscopic effects of 48-h fasting in 6-wk-old piglets. A: piglet growth during the study period, n = 12/group. B: piglet weight for the fed and fasted groups before and after the start of the 48-h fasting period, n = 12/group. C and D: small intestinal length at the end of the study period, raw values, and corrected for bodyweight, n = 16/group. Data are presented as means ± SD, and each dot in the bar-graphs represents an individual piglet. Significance was determined using repeated-measures ANOVA (piglet weight), or Student’s t test (intestinal length).
Figure 2.
Figure 2.
Metabolic function of isolated jejunal piglet small intestinal epithelial cells (IECs) following 48 h of fasting. Mitochondria flux parameters represented by: basal oxygen consumption rate (OCR) (A) and maximal respiration (B). Glycolytic flux parameters represented by: basal glycolytic proton efflux rate (glycoPER, C) and compensatory glycoPER (D). E: metabolic phenotype graph, showing basal OCR vs. basal glycoPER. Data are presented as means ± SD, n = 16/group. Significance was determined using Student’s t test. Maximal respiration and Compensatory glycoPER were log-transformed to meet normality assumptions.
Figure 3.
Figure 3.
Jejunal epithelial gene expression analysis upon 48 h fasting in 6-wk-old piglets. A: PCA plot of Euclidean distance between samples on variance stabilizing transformed data. Samples were colored based on group. B: Treeplot of Reactome pathway analysis of the differentially expressed genes (DEGs), clustered on similarity using the Jaccard similarity coefficient. C: heatmaps of the top 10 significantly regulated genes in each cluster. Scaled normalized counts are plotted for each individual gene and piglet, n = 16/group.
Figure 4.
Figure 4.
MitoCarta analysis of differentially expressed genes (DEGs) in jejunum upon 48 h of fasting in 6-wk-old piglets. A: pie chart showing that 37% of the 1,126 genes in the MitoCarta 3.0 set are significantly regulated upon 48 h of fasting in piglets. B: volcano plot displaying the DEGs of the MitoCarta 3.0 gene set. Eight hundred eighty-six of the 1,126 genes in the MitoCarta 3.0 set are present in our dataset and plotted in the volcano plot. Of those 886 genes, 424 genes were differentially regulated between fed and fasted piglets. C: Gene Set Enrichment Analysis (GSEA) of the MitoCarta 3.0 annotated mitochondrial pathways, showing which mitochondrial pathways are significantly regulated with a nominal P value <0.05. D: list of the two genes in each pathway with the highest Log2FC upon 48 h of fasting in piglets.
Figure 5.
Figure 5.
Cell proliferation analysis of 6-wk-old piglet’s jejunum following 48 h of fasting. A: representative images of processed immunohistochemical analysis of fed and fasted piglets stained with Ki67. Red objects are DAPI-stained objects that are larger than the defined size. Scalebar is 200 µm. B: bar-graph of the Ki67 stained cells corrected for the total number of cells per crypt. Data are presented as means ± SD, n = 8/group. Significance was determined using Student’s t test.
Figure 6.
Figure 6.
Morphological analysis of 6-wk-old piglet’s small intestine upon 48 h of fasting. A: representative images of Periodic Acid-Schiff and Hematoxylin (PASH) PASH stained fed and fasted piglet jejunum. Scale bar is 200 µm. Crypt depth (B), villi length (C), and villi length:crypt depth ratio in µm (D). E and F: total number of goblet cells per crypt or villi. G and H: number of goblet cells relative to crypt or villi area in µm2. Data are presented as means ± SD, n = 7 for fed piglets and n = 8 for fasted piglets. Significance was determined using Student’s t test (*P < 0.05; **P < 0.01; ***P < 0.001).
Figure 7.
Figure 7.
Analysis of barrier function and detoxification gene sets upon 48 h of fasting in 6-wk-old piglets. A: volcano plot of barrier function genes; 93 of 128 genes are present and plotted in the volcano plot, and 26 are significantly regulated. The top ten significantly regulated genes are labeled. B: heat map of the 26 significantly regulated genes in the barrier function gene set, with scaled normalized counts per pig and an additional column depicting the Log2FC of each gene in response to fasting (log2FC value plotted in the square). C: volcano plot of mitochondrial detoxification genes as annotated by MitoCarta 3.0. Forty-two of the 51 genes are present and plotted in the volcano plot, and 15 are significantly regulated. The eleven redox detoxification specific genes are labeled. D: heatmap of the 15 significantly regulated genes in the detox gene set, with scaled normalized counts per pig and an additional column depicting the Log2FC of each gene in response to fasting (log2FC value plotted in the square).

References

    1. Potten CS, Booth C, Pritchard DM. The intestinal epithelial stem cell: the mucosal governor. Int J Exp Pathol 78: 219–243, 1997. doi:10.1046/j.1365-2613.1997.280362.x. - DOI - PMC - PubMed
    1. Peterson LW, Artis D. Intestinal epithelial cells: regulators of barrier function and immune homeostasis. Nat Rev Immunol 14: 141–153, 2014. doi:10.1038/nri3608. - DOI - PubMed
    1. Kiela PR, Ghishan FK. Physiology of intestinal absorption and secretion. Best Pract Res Clin Gastroenterol 30: 145–159, 2016. doi:10.1016/j.bpg.2016.02.007. - DOI - PMC - PubMed
    1. Rolfe DF, Brown GC. Cellular energy utilization and molecular origin of standard metabolic rate in mammals. Physiol Rev 77: 731–758, 1997. doi:10.1152/physrev.1997.77.3.731. - DOI - PubMed
    1. van Erp RJJ, van Hees HMJ, Zijlstra RT, van Kempen TATG, van Klinken JB, Gerrits WJJ. Reduced feed intake, rather than increased energy losses, explains variation in growth rates of normal-birth-weight piglets. J Nutr 148: 1794–1803, 2018. doi:10.1093/jn/nxy200. - DOI - PubMed

Publication types