. 2023 Dec 20;111(24):3926-3940.e10.
doi: 10.1016/j.neuron.2023.09.017. Epub 2023 Oct 16.

In vivo photopharmacology with light-activated opioid drugs

Affiliations

In vivo photopharmacology with light-activated opioid drugs

Shannan P McClain et al. Neuron. .

Abstract

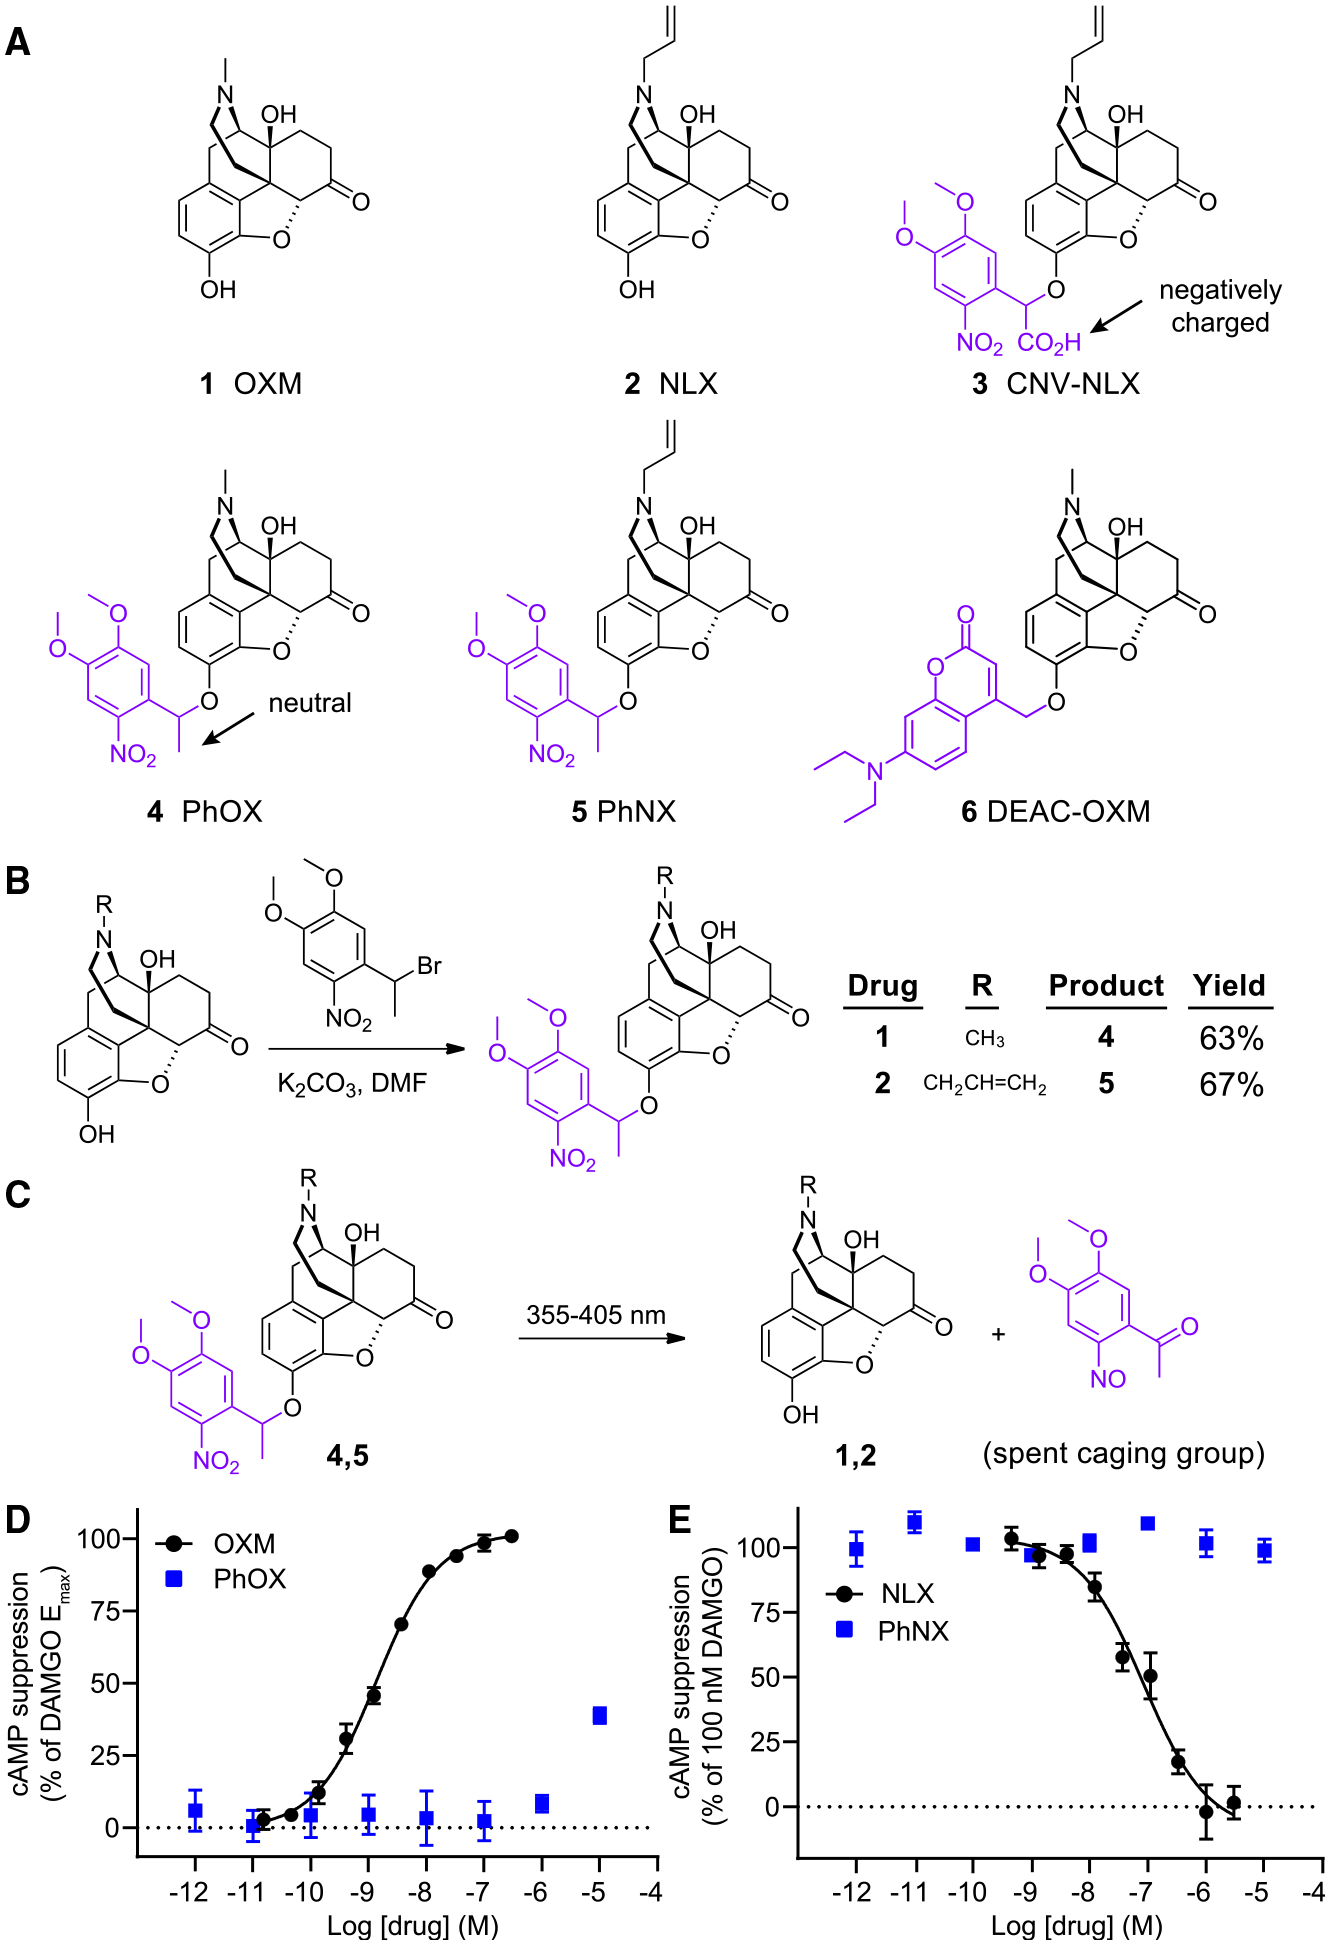
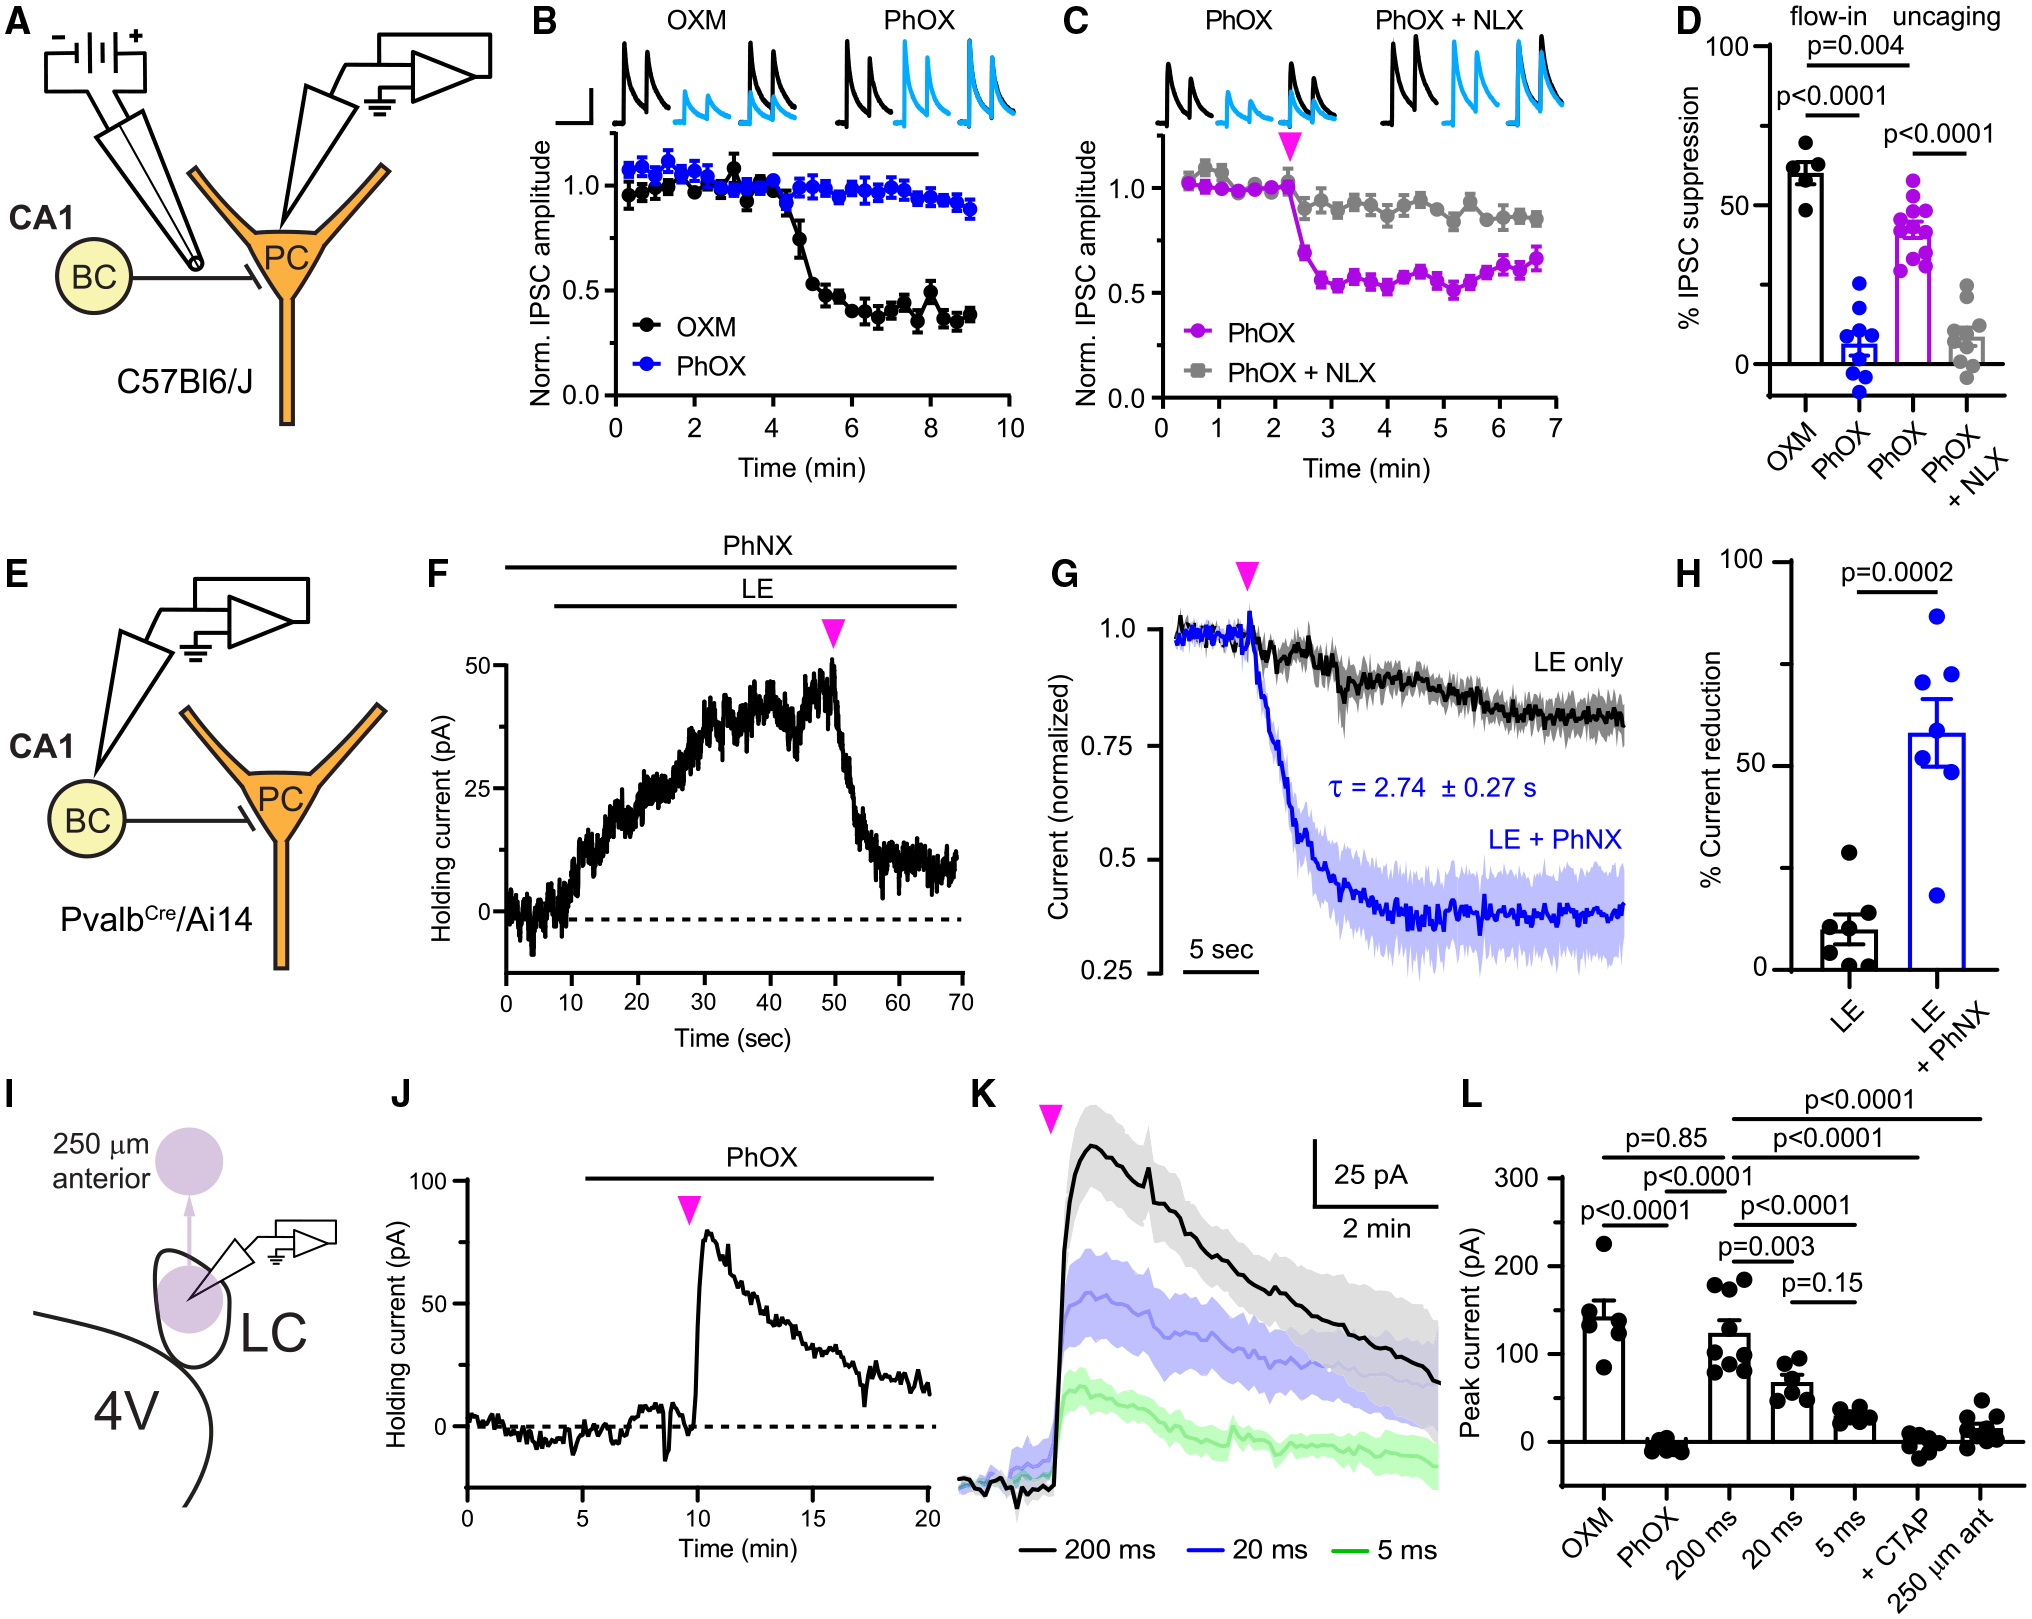
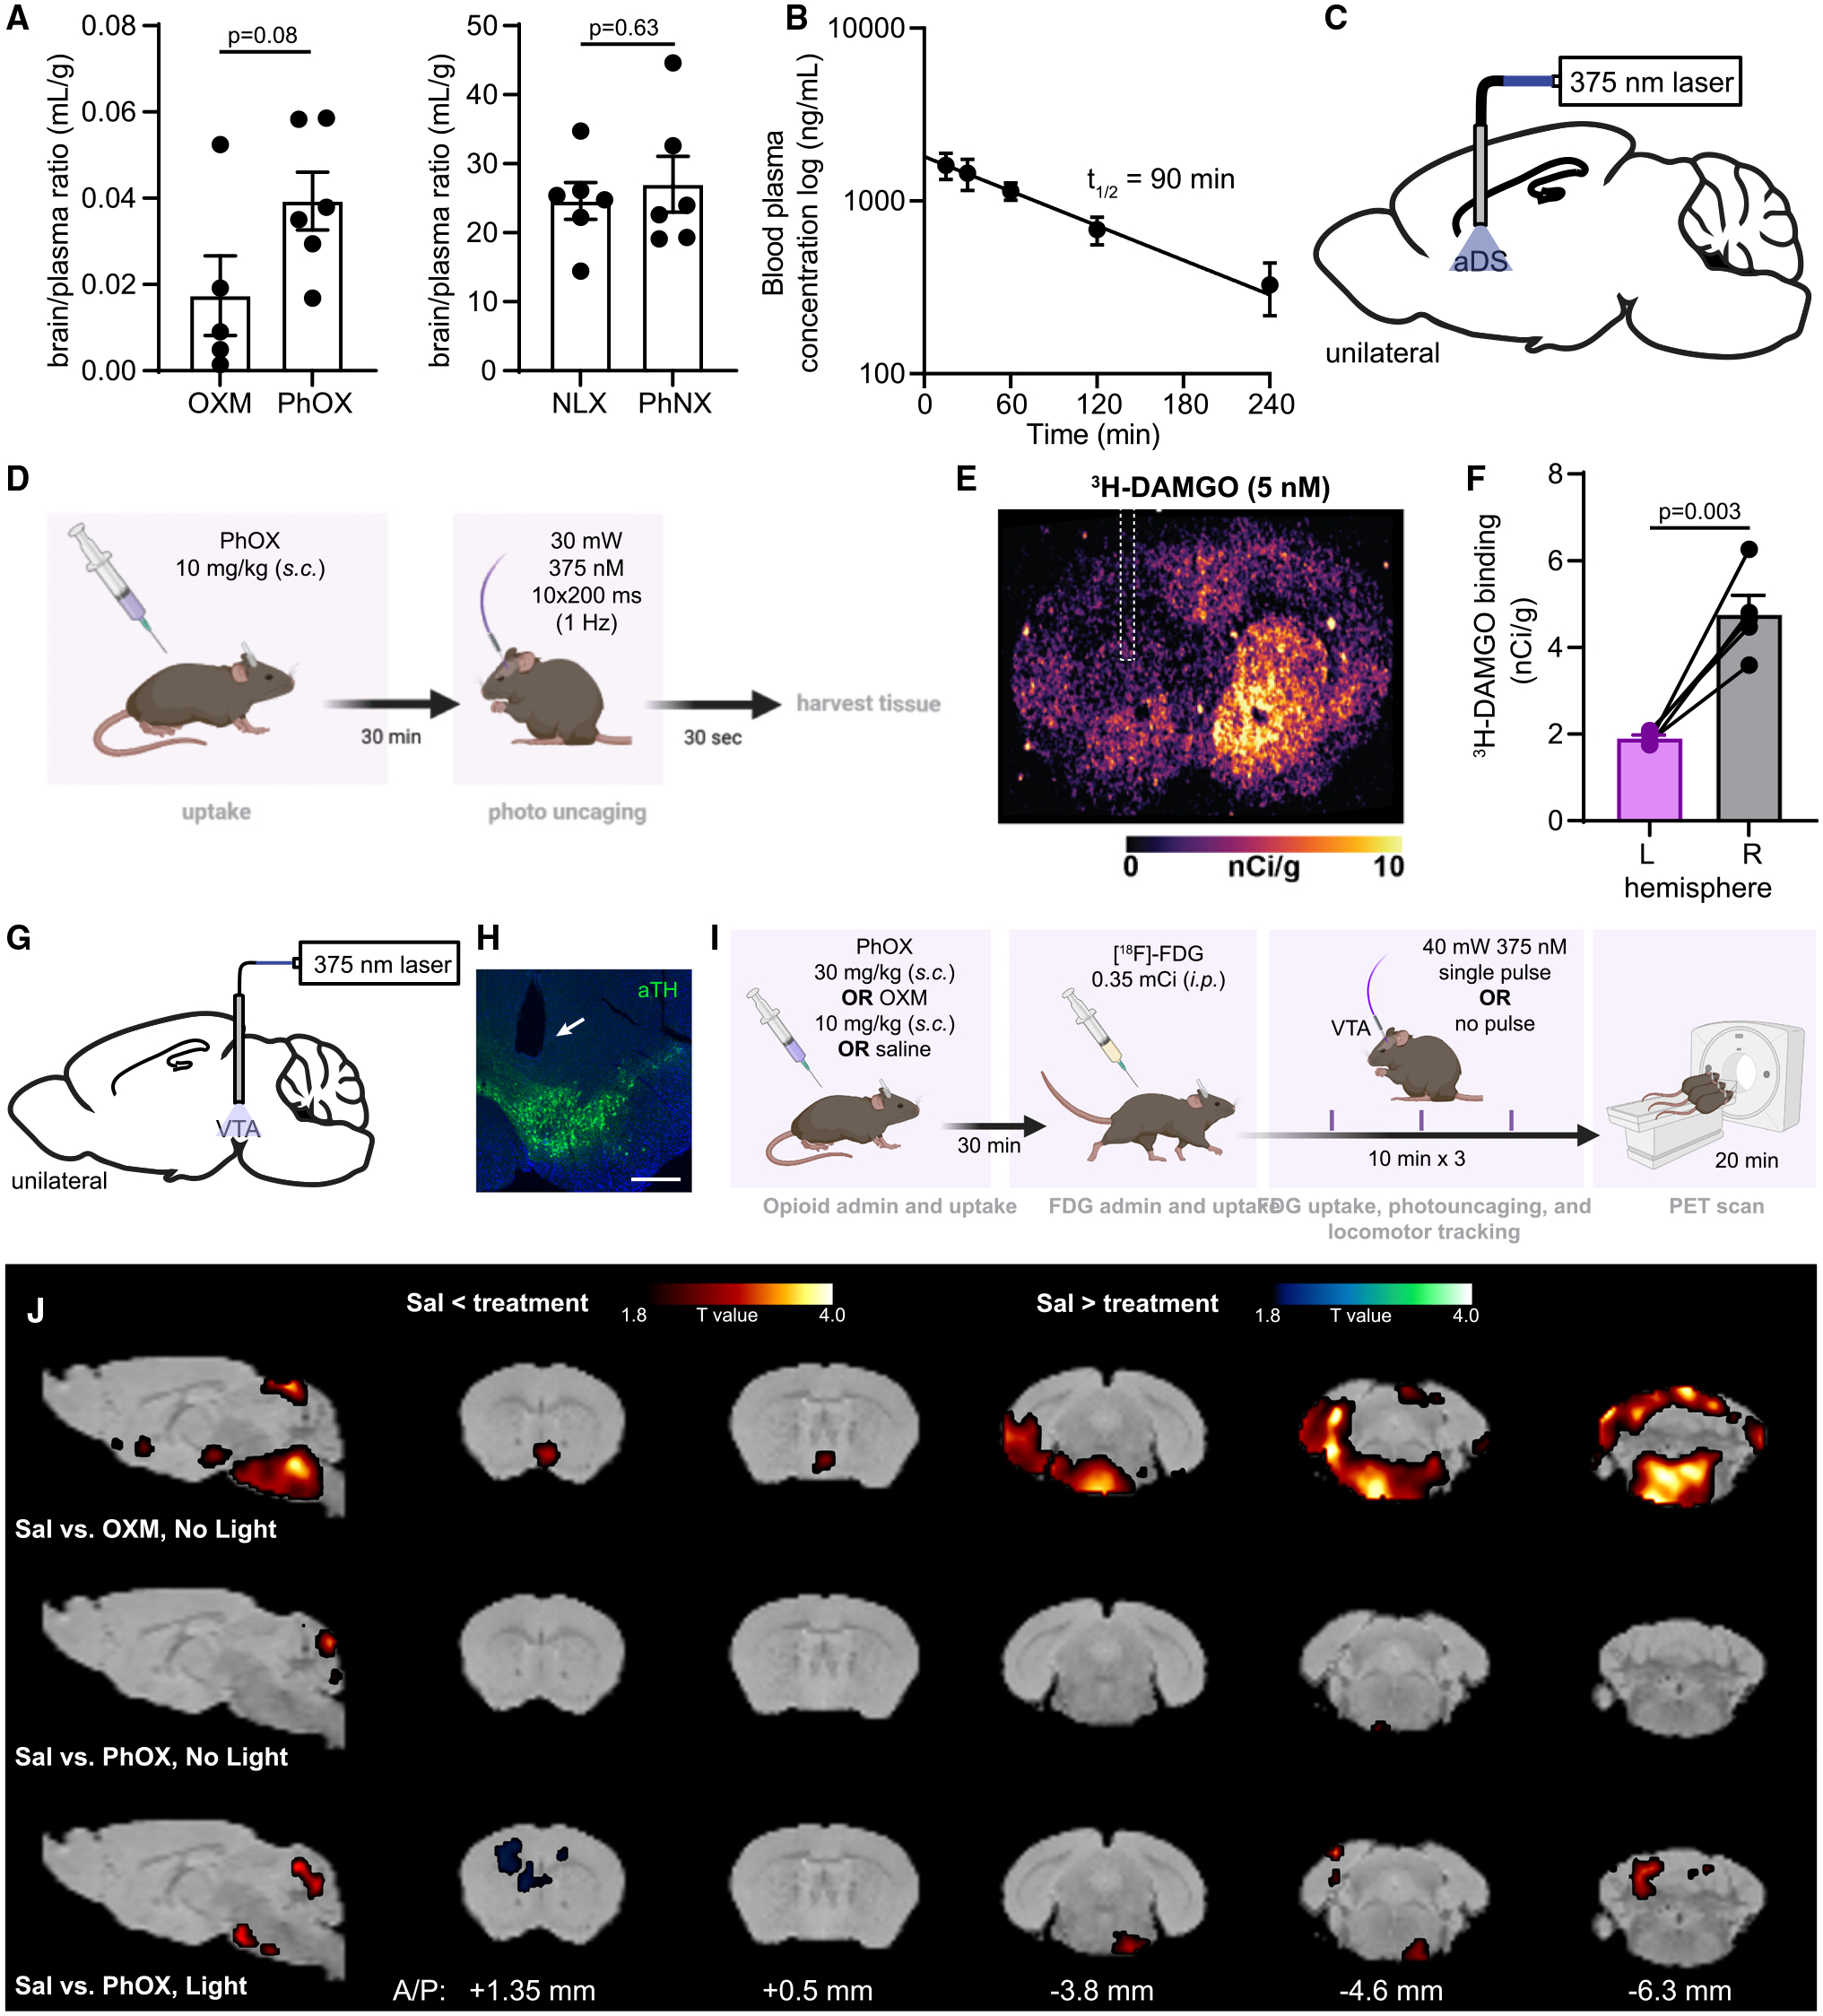
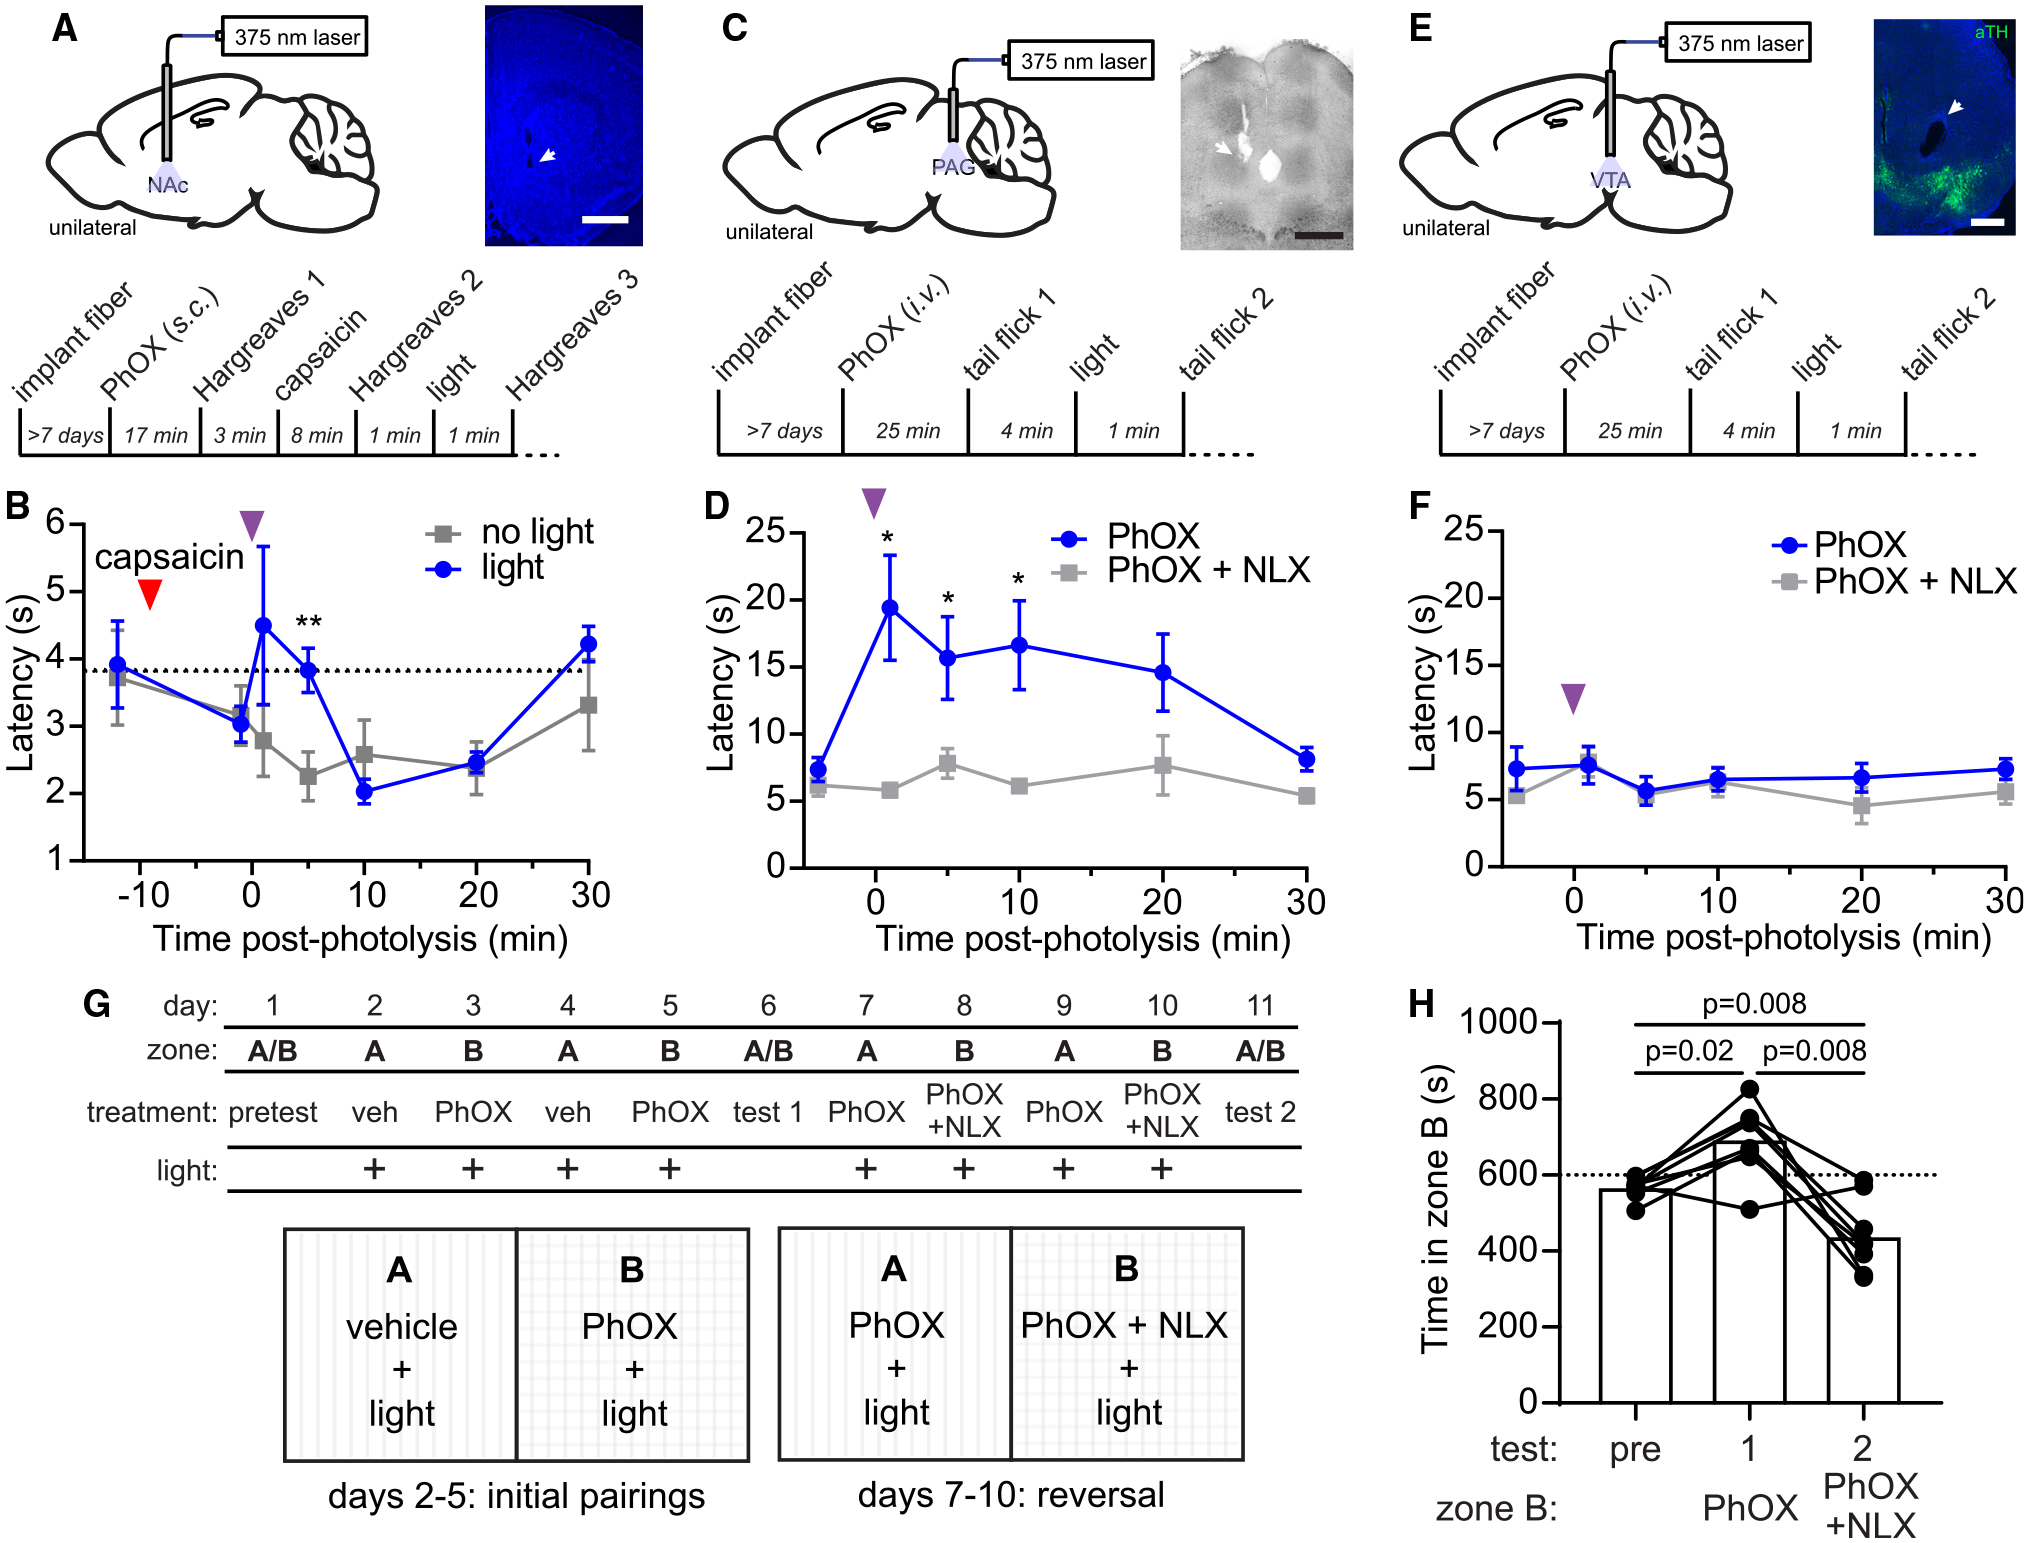
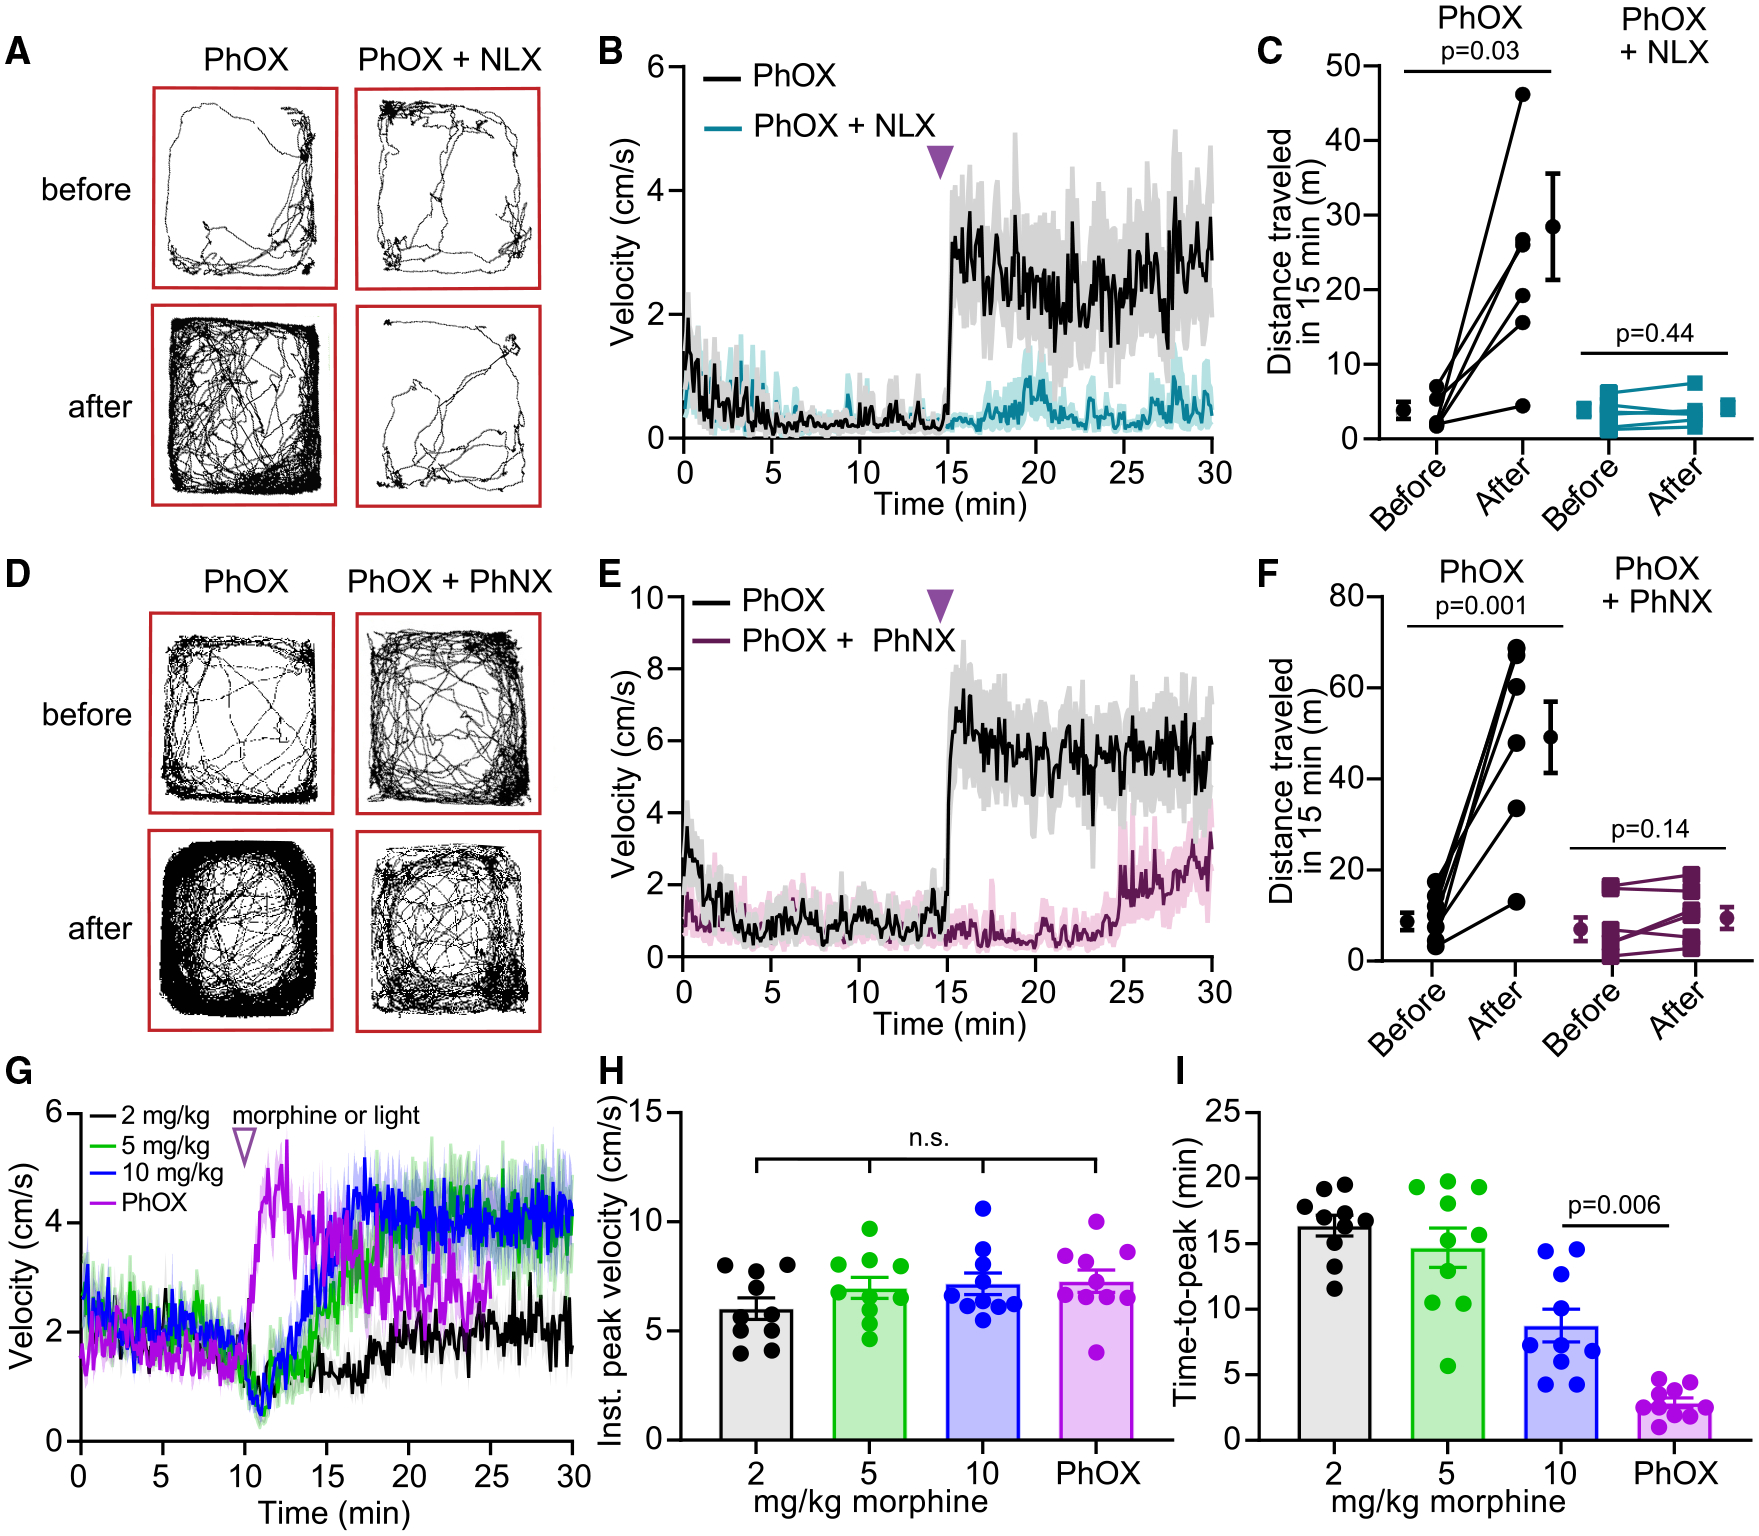
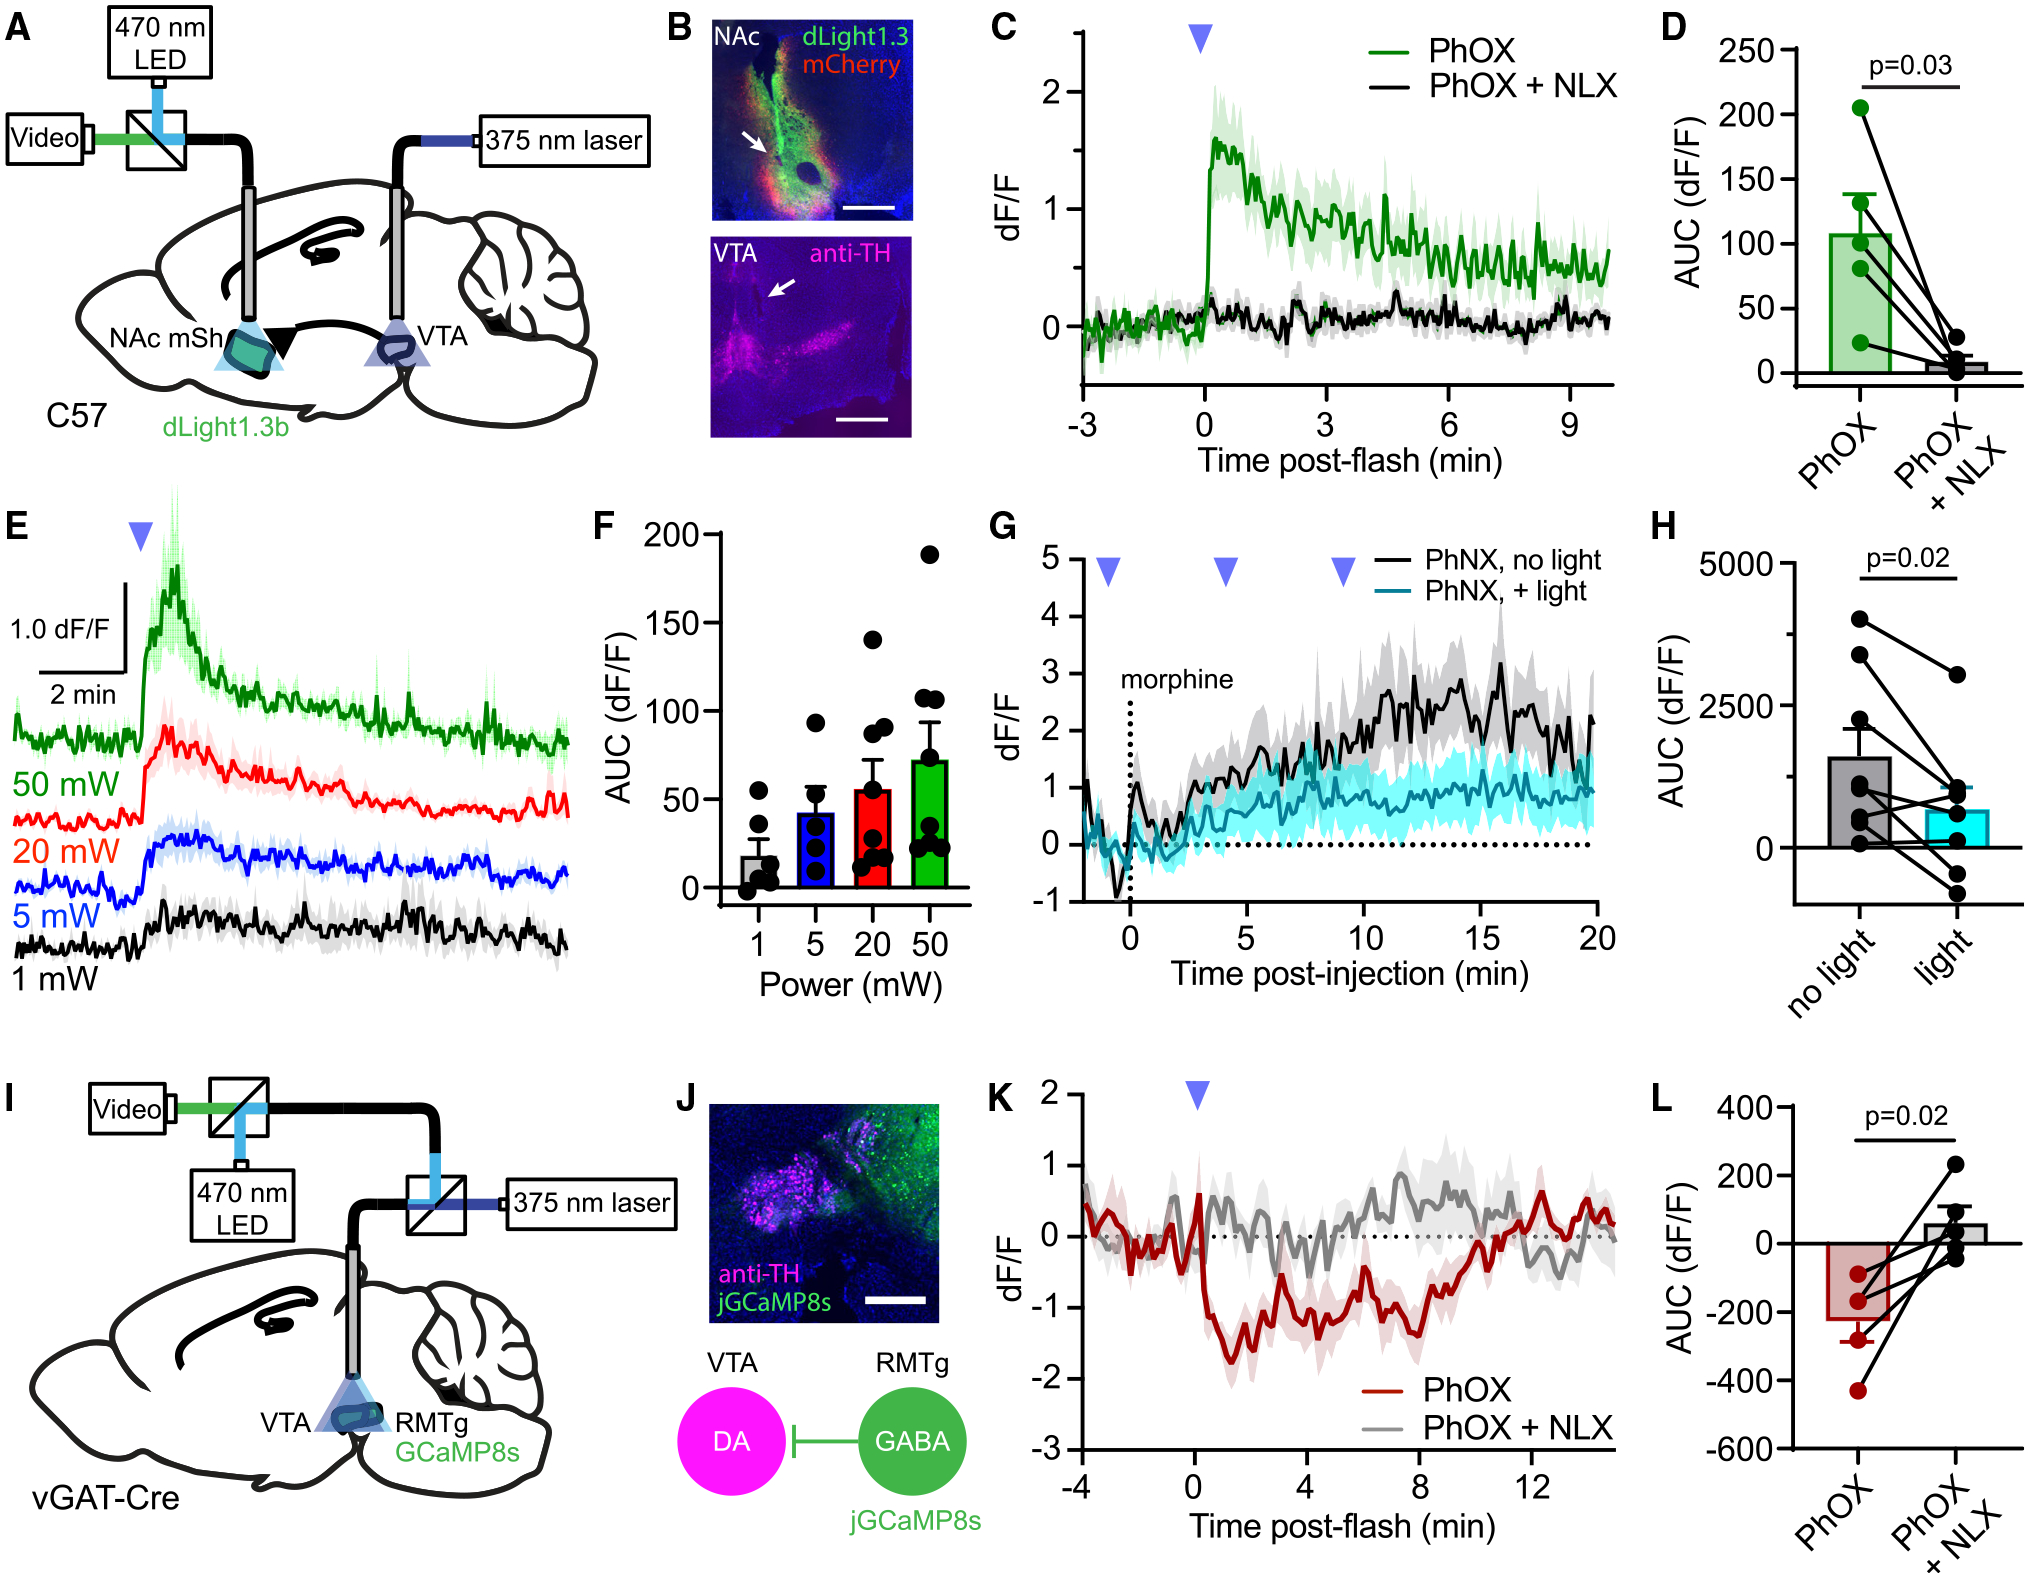
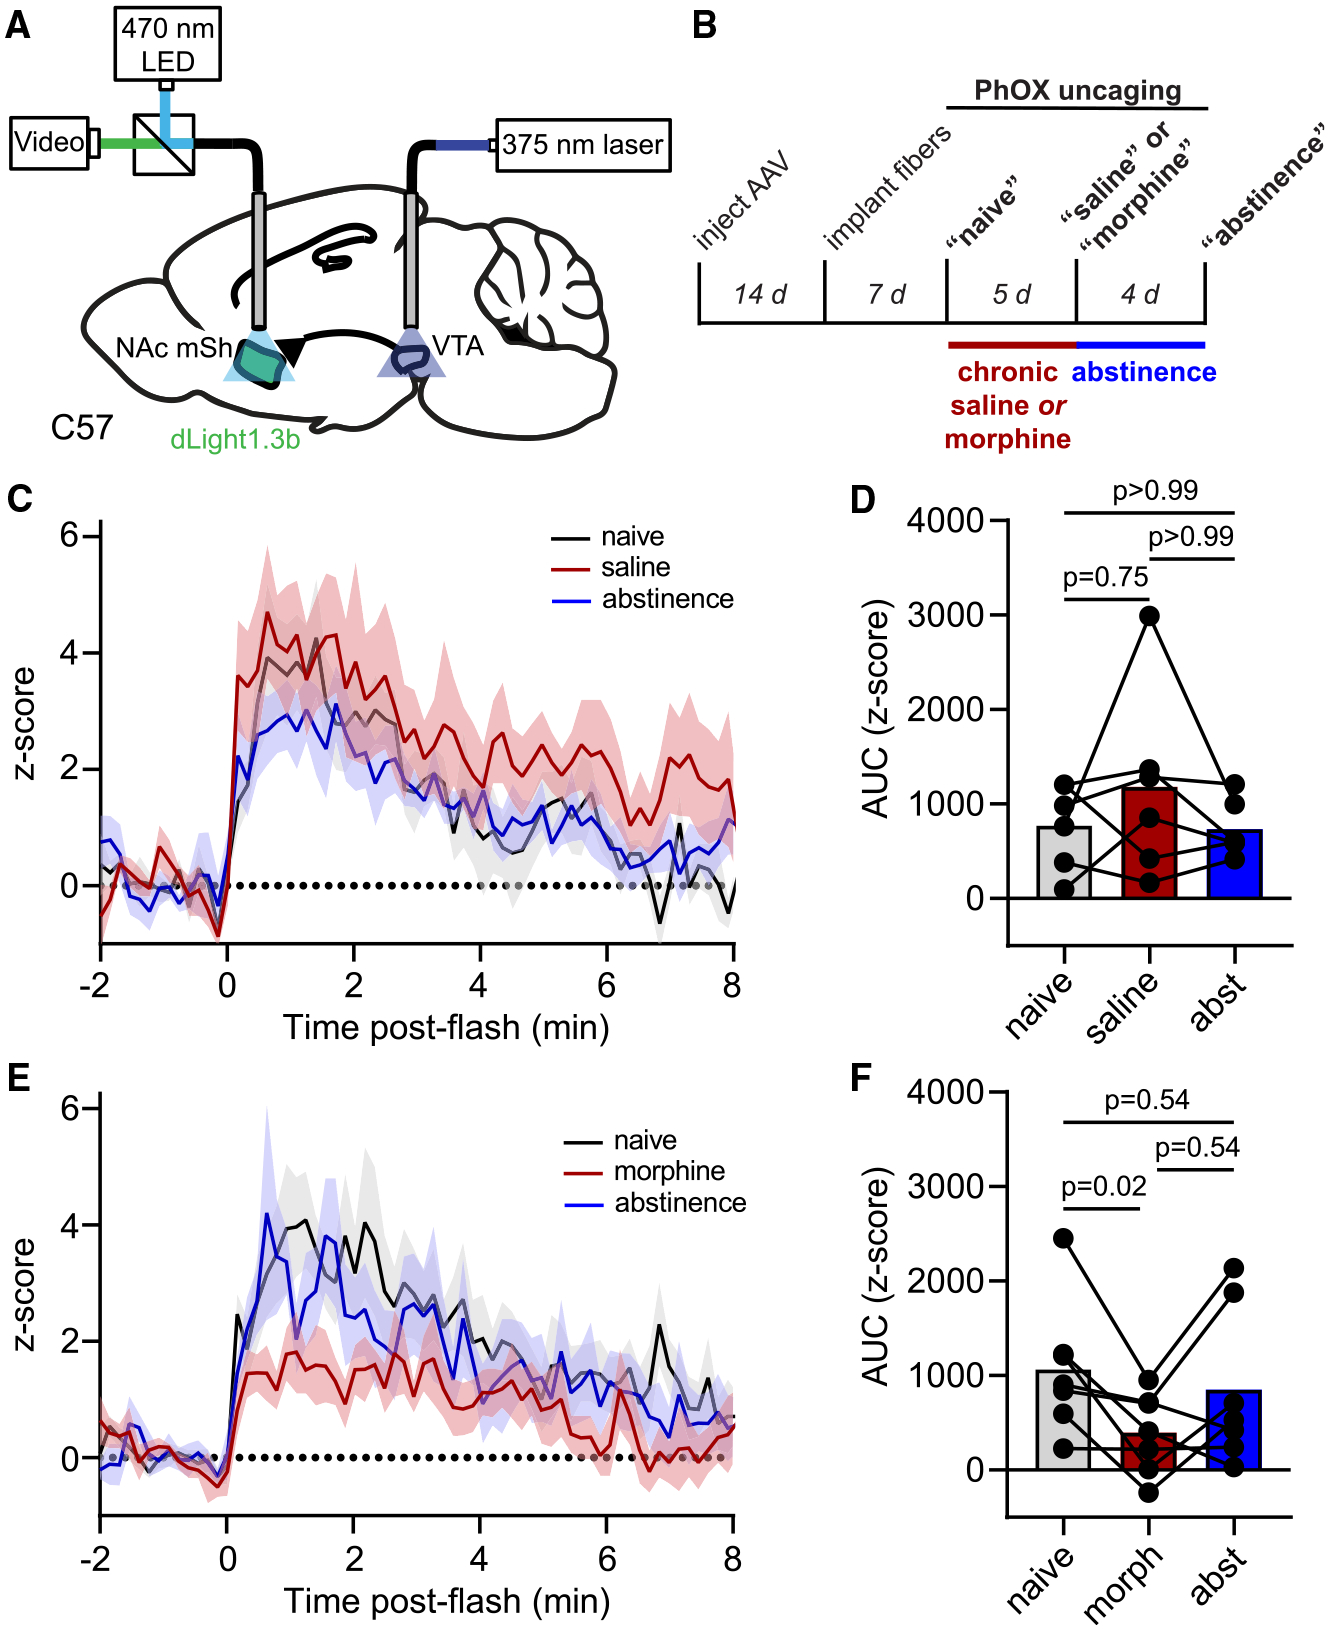
Traditional methods for site-specific drug delivery in the brain are slow, invasive, and difficult to interface with recordings of neural activity. Here, we demonstrate the feasibility and experimental advantages of in vivo photopharmacology using "caged" opioid drugs that are activated in the brain with light after systemic administration in an inactive form. To enable bidirectional manipulations of endogenous opioid receptors in vivo, we developed photoactivatable oxymorphone (PhOX) and photoactivatable naloxone (PhNX), photoactivatable variants of the mu opioid receptor agonist oxymorphone and the antagonist naloxone. Photoactivation of PhOX in multiple brain areas produced local changes in receptor occupancy, brain metabolic activity, neuronal calcium activity, neurochemical signaling, and multiple pain- and reward-related behaviors. Combining PhOX photoactivation with optical recording of extracellular dopamine revealed adaptations in the opioid sensitivity of mesolimbic dopamine circuitry in response to chronic morphine administration. This work establishes a general experimental framework for using in vivo photopharmacology to study the neural basis of drug action.

Keywords: addiction; analgesia; behavioral pharmacology; dopamine; opioid; optical recording; pain; photoactivation; photopharmacology; reward.


Conflict of interest statement

Declaration of interests The authors declare no competing interests.

Figures

Figure 1.
Figure 1.. Design, synthesis, and in vitro validation of PhOX and PhNX
(A) Chemical structures of OXM (1), NLX (2), and the photoactivatable small molecule opioid drugs CNV-NLX (3), PhOX (4), PhNX (5), and DEAC-OXM (6). The light-removable DMNPE and DEAC caging groups are drawn in violet. (B) Reaction scheme depicting the one-step alkylation procedure used to synthesize PhOX and PhNX. (C) Reaction scheme depicting ultraviolet-light-driven photorelease of OXM and NLX from PhOX, and PhNX, respectively. (D) Agonist dose-response curves at the MOR using a cAMP assay. The solid line depicts the best-fit sigmoidal function used to derive the indicated EC50 value. Data were normalized to the response produced by DAMGO (1 μM) and are expressed as mean ± SEM (n = 5 wells per concentration). (E) Antagonist dose-response curves at the MOR in the presence of DAMGO (100 nM). Data are presented as in (D). See also Figures S1–S3.
Figure 2.
Figure 2.. Evaluation of PhOX-mediated photo-agonism and PhNX-mediated photo-antagonism in acute brain slices
(A) Schematic depicting whole-cell voltage clamp recording of opioid-sensitive synaptic inhibition in the hippocampus. BC, basket cell; PC, pyramidal cell. (B) Baseline-normalizedIPSCs in response to bath application of drug, as indicated by the black line (OXM: n = 5 cells from 2 mice; PhOX: n = 9 cells from 6 mice). Top insets: example average IPSCs (n = 3 sweeps from one cell) before (black) and after (blue) drug application. Scale bars, 200 pA, 80 ms. (C) IPSC suppression in response to uncaging with a full-field flash of UV light (pink arrow) (PhOX: n = 12 cells from 7 mice; PhOX + NLX: n = 10 cells from 5 mice). (D) Summary data for (B) and (C) (one-way ANOVA, F(3,32) = 58.2, p < 0.0001, Bonferroni’s multiple comparisons test). (E) Schematic depicting the whole-cell voltage clamp recording of outward currents from BCs. (F) Example recording demonstrating photoinhibition of the current evoked by bath application of LE upon PhNX uncaging. Scale bars, 10 pA, 10 s. (G) Normalized response of LE-evoked currents to a UV light flash in the absence and presence of PhNX (LE only: n = 7 cells from 3 mice; LE + PhNX: n = 7 cells from 3 mice). (H) Summary of the LE-evoked current remaining 10–15 s after application of a light flash (unpaired two-tailed t test). (I) Schematic depicting whole-cell voltage clamp recording from noradrenergic neurons in rat LC and movement of the uncaging spot (purple circle) away from the recorded neurons. (J) Example recording from an LC neuron in which bath application of PhOX was followed by uncaging. (K) Average currents evoked by uncaging PhOX with light flashes of varied duration (200 ms: n = 9 cells from 3 rats; 20 ms: n = 6 cells from 3 rats; 5 ms: n = 6 cells from 3 rats). (L) Summary of the currents evoked in LC neurons (one-way ANOVA, F(6,42) = 33.6, p < 0.0001, Sidak’s multiple comparisons test). All data are plotted as mean ± SEM. See also Figure S3.
Figure 3.
Figure 3.. In vivo photoactivation of PhOX after systemic administration
(A) Brain/plasma ratios determined 15 min after administration (n = 5–6 mice per condition, unpaired two-tailed t test). Data are plotted as mean ± SEM. (B) Time course of PhOX clearance from the bloodstream (15 mg/kg, n = 4 mice). Data are plotted as mean ± SEM. (C) Schematic indicating the implantation of an optical fiber in the aDS. (D) Experimental timeline for in vivo uncaging followed by autoradiography. (E) Autoradiographic image of the fiber implant site in mice. (F) Quantification of [3H]-DAMGO binding in the illuminated (L) and unilluminated (R) hemispheres (n = 5 sections from 5 mice, paired two-tailed t test). Data are plotted as mean ± SEM. (G) Schematic indicating the implantation of an optical fiber above the VTA. (H) Representative fluorescence image of the VTA implant site (scale bars, 0.5 mm). (I) Schematic depicting the experimental protocol for PET imaging after PhOX uncaging. (J) Brain-wide voxel-based analysis of [18F]-FDG uptake. Color shaded areas overlaid on the corresponding sections of a brain atlas represent clusters of voxels (R100) with significant (p < 0.05) increases or decreases in FDG accumulation compared with saline (n = 5–6 mice per condition).
Figure 4.
Figure 4.. In vivo photoactivation of PhOX suppresses pain-related behavior and drives behavioral reinforcement
(A) Schematic indicating the implantation of an optical fiber in the NAc-mSh (top left), representative fluorescence image of the optical fiber implant site (scale bars, 1 mm) (top right), and experimental timeline (bottom). (B) Paw withdrawal latency in the Hargreaves assay (n = 6 mice, ** indicates p < 0.005, paired two-tailed t test). (C) Same as (A) for the PAG (scale bars, 0.5 mm). (D) Withdrawal latency in the tail flick assay (n = 6 mice, * indicates p < 0.05, Wilcoxon signed-rank test). (E) Same as (A) for the VTA (scale bars, 0.5 mm). (F) Withdrawal latency in the tail flick assay (n = 4 mice, no significant differences detected, Mann-Whitney test). (G) Schematic depicting the CPP protocol. (H) Time spent in zone B on test days (n = 8 mice, repeated measures one-way ANOVA, F(1.13,7.88) = 19.4, p = 0.002, Bonferroni’s multiple comparisons test). All data are plotted as mean ± SEM. See also Figure S4.
Figure 5.
Figure 5.. In vivo photoactivation of PhOX in the VTA drives rapid locomotor activation
(A) Example maps of open field locomotor activity. (B) Plot of average velocity over time (n = 6 mice). (C) Summary plot of the total distance traveled before or after photoactivation (n = 6 mice, Wilcoxon signed-rank test). (D) Same as (A). (E) Same as (B) (n = 7 mice). (F) Same as (C) (n = 7 mice, paired two-tailed t test). (G) Same as (B) but comparing PhOX photoactivation to systemic morphine (n = 10 mice). (H) Summary plot of the instantaneous peak velocity reached after morphine injection or PhOX photoactivation (n = 10 mice, repeated measures one-way ANOVA, F(2.2, 19.3) = 2.33, p = 0.12). (I) Summary plot of the time to reach the peak locomotor response (n = 10 mice, repeated measures one-way ANOVA, F(1.9, 16.9) = 36.12, p < 0.0001, Tukey’s multiple comparisons test). All data are plotted as mean ± SEM. See also Figure S5.
Figure 6.
Figure 6.. Interfacing in vivo photopharmacology with fiber photometry
(A) Schematic indicating fiber implantation in the VTA for uncaging and fiber photometry recording of extracellular dopamine in the ipsilateral NAc-mSh. (B) Example images of viral expression and fiber implantation site for fiber photometry in the NAc-mSh, and uncaging site in the VTA by immunostaining for tyrosine hydroxylase (TH, magenta). Scale bars, 0.5 mm (NAc) and 0.75 mm (VTA). (C) Average NAc-mSh dLight1.3b fluorescence in response to VTA PhOX uncaging with a single light flash (n = 5 mice). (D) Summary plot of the data shown in (C) (AUC [area under the curve], n = 5 mice, paired two-tailed t test). (E) Average dLight1.3b fluorescence in response to a single light flash at the indicated light powers (n = 6–8 mice). (F) Summary plot of the data shown in (E) (n = 6–8 mice). (G) Average dLight1.3b fluorescence in the NAc-mSh in response to systemic morphine, with or without PhNX uncaging in the ipsilateral VTA (n = 8 mice). (H) Summary plot of the morphine-evoked fluorescence changes shown in (G) (n = 8 mice, paired two-tailed t test). (I) Schematic indicating implantation of a fiber over the VTA coupled to both a 375-nm laser and a fiber photometry recording system to detect changes in Ca2+ activity, with jGCaMP8s expressed in RMTg GABA neurons. (J) (Top) Example image of the fiber implant site along with jGCaMP8s expression in RMTg GABA neurons. Scale bars, 0.5 mm. (Bottom) Diagram depicting inhibition of VTA dopamine (DA) neurons by jGCaMP8s-expressing RMTg GABA neurons. (K) Average normalized jGCaMP8s fluorescence in response to PhOX uncaging with a single light flash (n = 5 mice). (L) Summary plot of the data shown in (K) (n = 5 mice, paired two-tailed t test). All data are plotted as mean ±SEM. See also Figure S7.
Figure 7.
Figure 7.. Combined in vivo uncaging and fiber photometry reveal drug-dependent changes in the opioid sensitivity of mesolimbic dopamine signaling
(A) Schematic indicating fiber implantation in the VTA for uncaging and fiber photometry recording of extracellular dopamine in the ipsilateral NAc-mSh. (B) Experimental timeline. (C) Average Z scored dLight1.3b fluorescence in the NAc-mSh in response to PhOX uncaging before, during, and after chronic saline administration (n = 6 mice). (D) Summary plot of the data shown in (C) (n = 6 mice, Friedman test, p = 0.57, Dunn’s multiple comparisons test). (E) Same as (C) but for chronic morphine (n = 7 mice). (F) Same as (D) but for chronic morphine (n = 7 mice, Friedman test, p = 0.027, Dunn’s multiple comparisons test). All data are plotted as mean ± SEM.

Update of

References

    1. Ellis-Davies GCR (2007). Caged compounds: photorelease technology for control of cellular chemistry and physiology. Nat. Methods 4, 619–628. 10.1038/nmeth1072. - DOI - PMC - PubMed
    1. Velema WA, Szymanski W, and Feringa BL (2014). Photopharmacology: beyond proof of principle. J. Am. Chem. Soc 136, 2178–2191. 10.1021/ja413063e. - DOI - PubMed
    1. Broichhagen J, Frank JA, and Trauner D (2015). A roadmap to success in photopharmacology. Acc. Chem. Res 48, 1947–1960. 10.1021/acs.accounts.5b00129. - DOI - PubMed
    1. Lima SQ, and Miesenböck G (2005). Remote control of behavior through genetically targeted photostimulation of neurons. Cell 121, 141–152. 10.1016/j.cell.2005.02.004. - DOI - PubMed
    1. Acosta-Ruiz A, Gutzeit VA, Skelly MJ, Meadows S, Lee J, Parekh P, Orr AG, Liston C, Pleil KE, Broichhagen J, et al. (2020). Branched photoswitchable tethered ligands enable ultra-efficient optical control and detection of G protein-coupled receptors in vivo. Neuron 105, 446–463.e13. 10.1016/j.neuron.2019.10.036. - DOI - PMC - PubMed

Publication types

MeSH terms