. 2023 Oct 26;186(22):4851-4867.e20.
doi: 10.1016/j.cell.2023.09.013. Epub 2023 Oct 16.

Serotonin reduction in post-acute sequelae of viral infection

Affiliations

Serotonin reduction in post-acute sequelae of viral infection

Andrea C Wong et al. Cell. .

Abstract

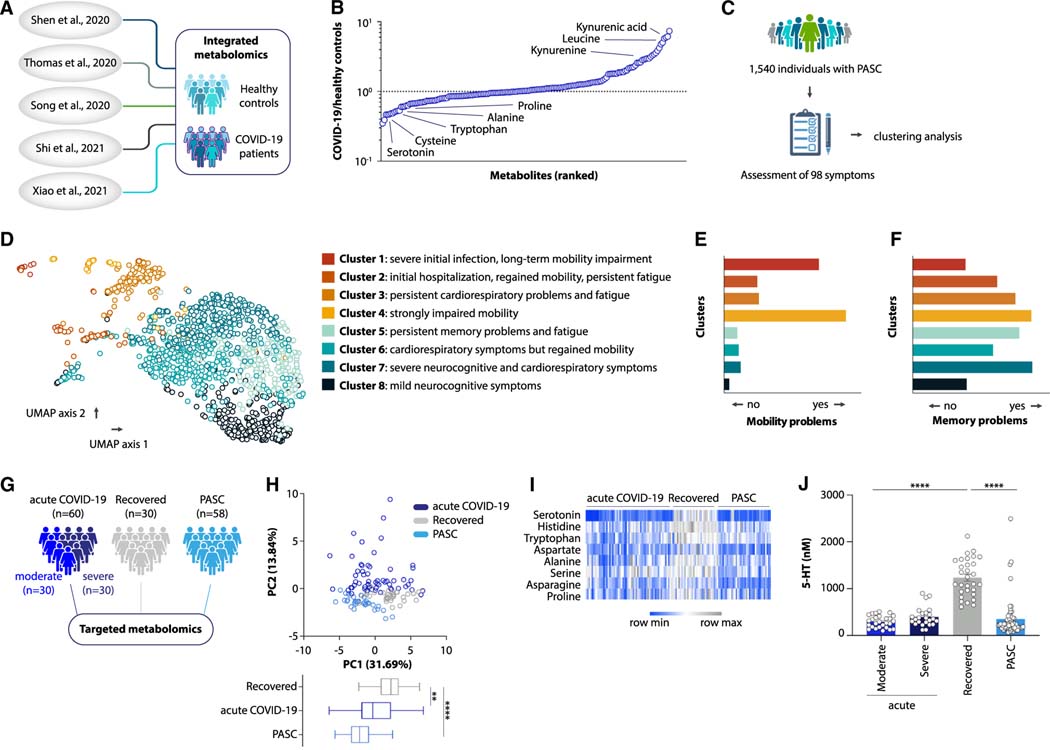
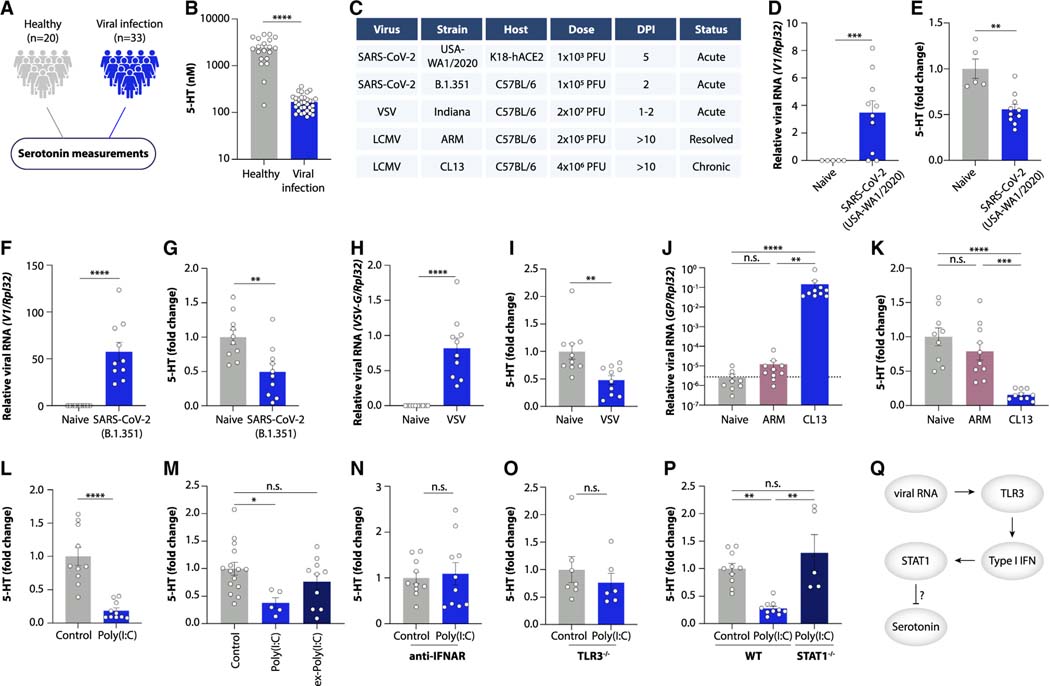
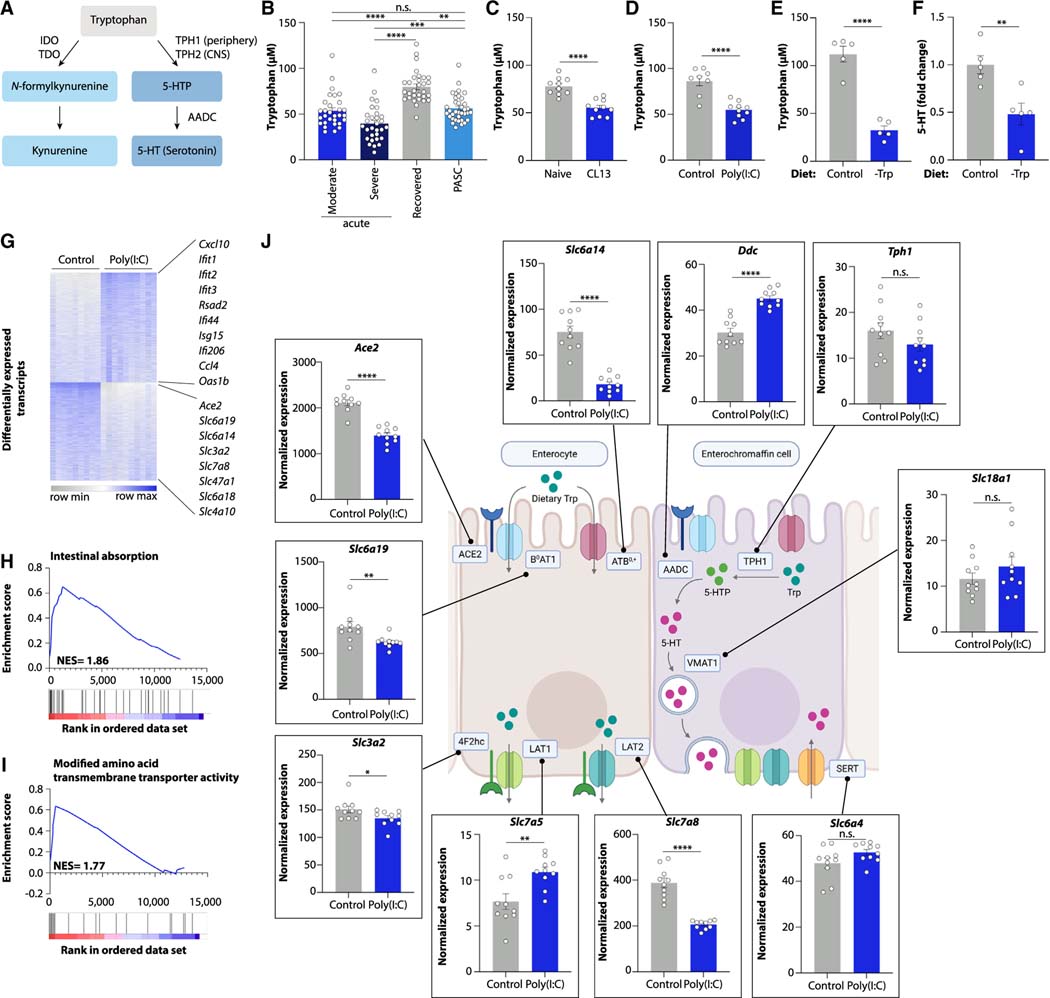
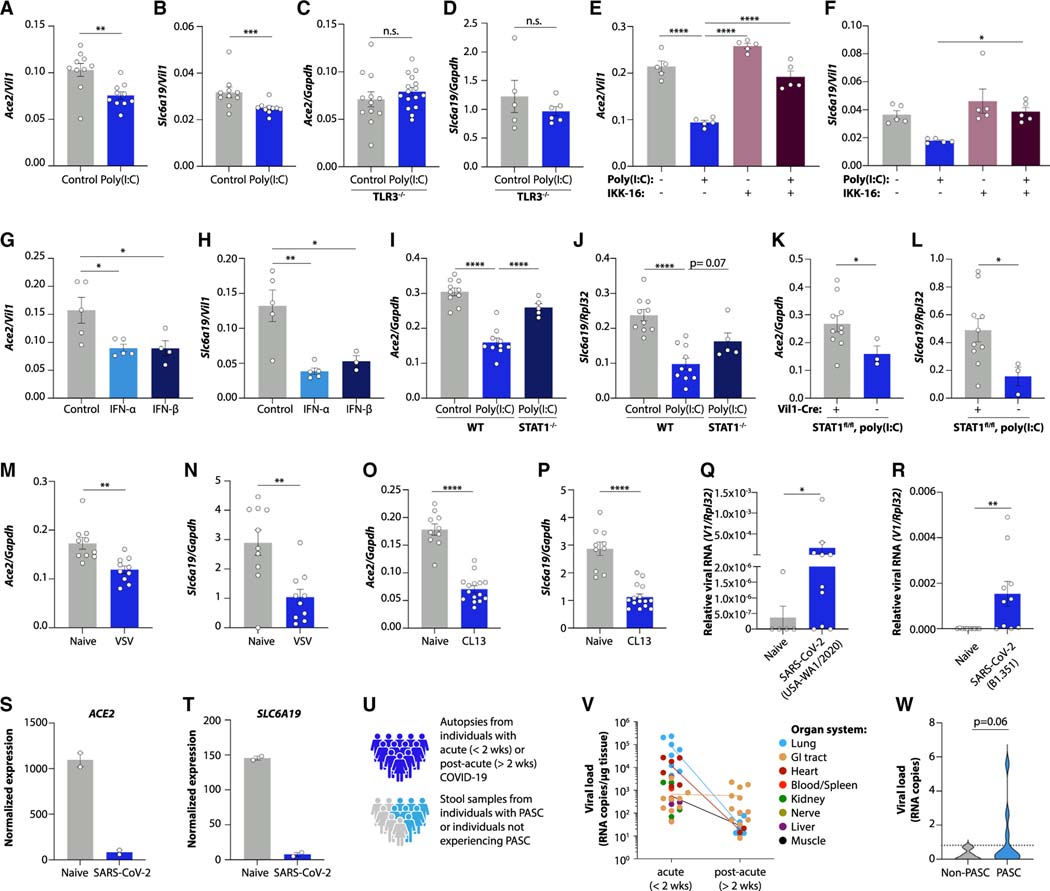
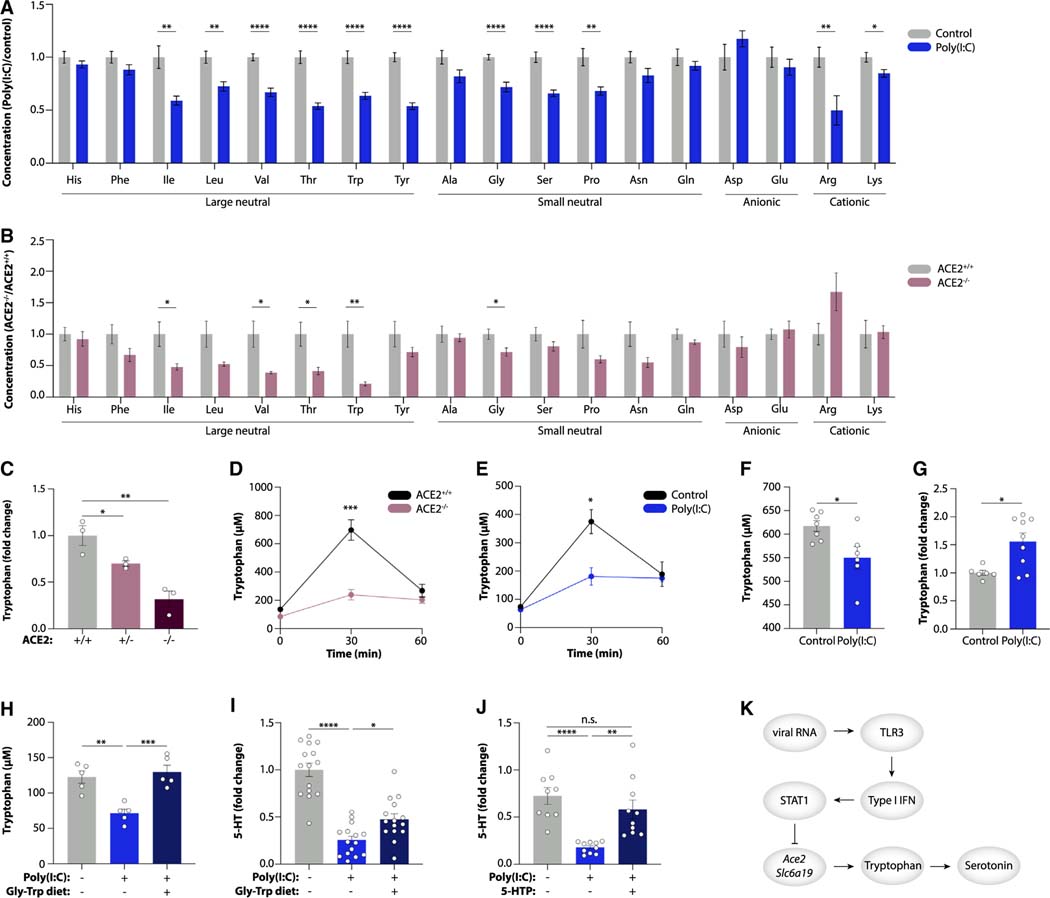
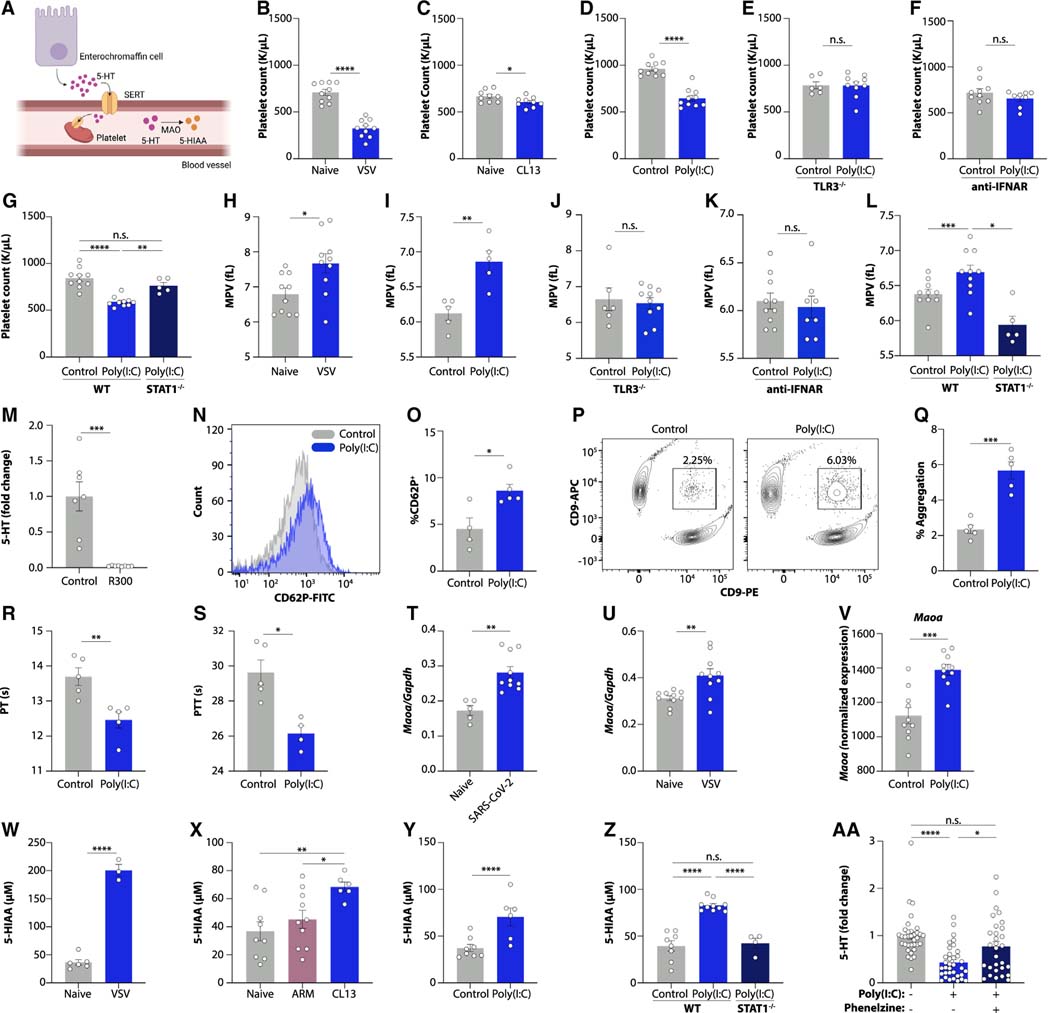
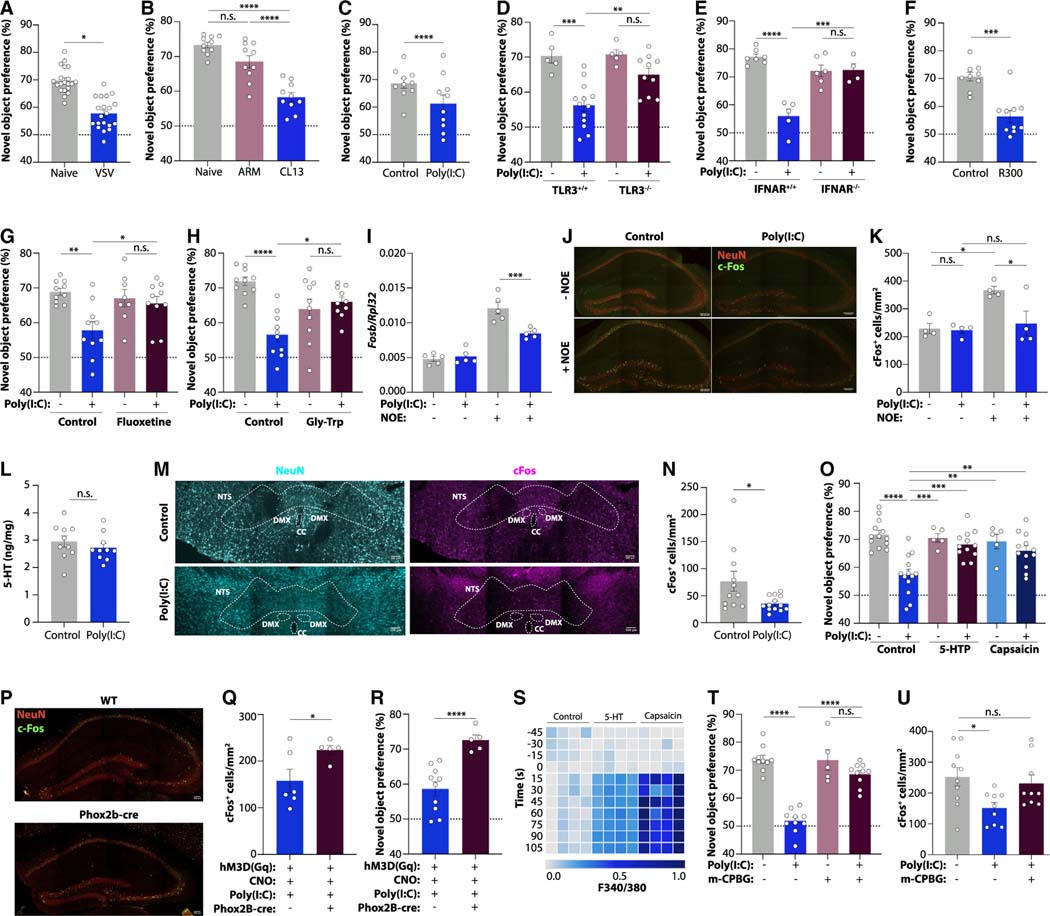
Post-acute sequelae of COVID-19 (PASC, "Long COVID") pose a significant global health challenge. The pathophysiology is unknown, and no effective treatments have been found to date. Several hypotheses have been formulated to explain the etiology of PASC, including viral persistence, chronic inflammation, hypercoagulability, and autonomic dysfunction. Here, we propose a mechanism that links all four hypotheses in a single pathway and provides actionable insights for therapeutic interventions. We find that PASC are associated with serotonin reduction. Viral infection and type I interferon-driven inflammation reduce serotonin through three mechanisms: diminished intestinal absorption of the serotonin precursor tryptophan; platelet hyperactivation and thrombocytopenia, which impacts serotonin storage; and enhanced MAO-mediated serotonin turnover. Peripheral serotonin reduction, in turn, impedes the activity of the vagus nerve and thereby impairs hippocampal responses and memory. These findings provide a possible explanation for neurocognitive symptoms associated with viral persistence in Long COVID, which may extend to other post-viral syndromes.

Keywords: Long COVID; PASC; neurocognitive symptoms; platelets; post-viral syndromes; serotonin; thrombocytopenia; type I interferons; vagus nerve; viral persistence.


Conflict of interest statement

Declaration of interests E.J.W. is an advisor for Danger Bio, Janssen, New Limit, Marengo, Pluto Immunotherapeutics Related Sciences, Rubius Therapeutics, Santa Ana Bio, Synthekine, and Surface Oncology. E.J.W. is a founder of and holds stock in Surface Oncology, Danger Bio, and Arsenal Biosciences. N.J.M. reports consulting fees from Endpoint Health Inc and AstraZeneca and receives funding from Quantum Leap Healthcare Collaborative outside of the published work.

Figures

Figure 1.
Figure 1.. Serotonin deficiency in PASC
(A and B) Study schematic (A) and differential abundance ranking (B) of metabolomics data from COVID-19 patients vs. healthy controls. (C and D) Study schematic (C) and uniform manifold approximation and projection (UMAP) clusters (D) of symptom presentation in UPenn PASC cohort. (E and F) Symptom distribution in PASC cohort clusters. (G–J) Study schematic (G), principal component analysis (PCA) plot and PC1 values from targeted metabolomics data (H), heatmap of metabolites decreasing in acute COVID-19 and not recovering in PASC (I), and plasma serotonin (J) in acute COVID-19, recovered, and PASC patients. Plotted are means ± SEM. **p < 0.01, ****p < 0.0001. See also Figures S1 and S2.
Figure 2.
Figure 2.. Viral inflammation drives serotonin deficiency
(A and B) Study schematic (A) and plasma serotonin (B) in viremia patients vs. healthy controls. (C) Overview of viral infections in mice. (D and E) Viral RNA load in lungs (D) and plasma serotonin levels (E) in K18-hACE2 mice infected with SARS-CoV-2 (USA-WA 1/2020). (F and G) Viral RNA load in lungs (F) and plasma serotonin levels (G) in mice infected with SARS-CoV-2 (B.1.351). (H and I) Viral RNA load in spleen (H) and plasma serotonin levels (I) in mice infected with VSV. (J and K) Viral RNA load in ileum (J) and plasma serotonin levels (K) in mice infected with LCMV Armstrong (ARM) or Clone 13 (CL13) for 15 days. (L–P) Plasma serotonin levels in control and poly(I:C)-treated mice (L and M), ex-poly(I:C) mice (M), anti-IFNAR-treated mice (N), TLR3−/− mice (O), and STAT1−/− mice (P). (Q) Schematic of serotonin reduction by viral RNA. Plotted are means ± SEM. n.s. p > 0.05, *p < 0.05, **p < 0.01, ***p < 0.001, ****p < 0.0001. See also Figure S3.
Figure 3.
Figure 3.. Viral inflammation suppresses genes involved in intestinal amino acid absorption
(A) Schematic of kynurenine and serotonin biosynthesis. (B–F) Plasma levels of tryptophan (B–E) and serotonin (F) in acute COVID-19, recovered, and PASC patients (B), mice infected with LCMV CL13 for 30 days (C), poly(I:C)-treated mice (D), and mice fed a tryptophan-deficient diet (E and F). (G) Differentially expressed genes in ileum of poly(I:C)-treated mice vs. controls. (H and I) Gene set enrichment analysis plots of ileal genes downregulated by poly(I:C) treatment. (J) Ileal expression of genes involved in tryptophan uptake and serotonin biosynthesis. Plotted are means ± SEM. n.s. p > 0.05, *p < 0.05, **p < 0.01, ***p < 0.001, ****p < 0.0001. See also Figure S4.
Figure 4.
Figure 4.. Mechanisms of viral inflammation-induced intestinal gene expression changes
(A–P) Ace2 and Slc6a19 expression in poly(I:C)-treated small intestinal organoids (A and B), poly(I:C)-treated TLR3−/− mice (C and D), poly(I:C) and IKK-16-treated small intestinal organoids (E and F), IFN-α- and IFN-β-treated small intestinal organoids (G and H), poly(I:C)-treated STAT1−/− mice (I and J), poly(I:C)-treated VillinCre–ERT/+ STAT1flox/flox mice (K and L), ileum of VSV-infected mice (M and N), and ileum of LCMV CL13-infected mice 27 days post-infection (O and P). (Q and R) Intestinal viral RNA after infection with the indicated strains of SARS-CoV-2. (S and T) Normalized expression of Ace2 (S) and Slc6a19 (T) in SARS-CoV-2-infected human small intestinal organoids. (U–W) Study schematic (U), SARS-CoV-2 RNA detected in tissues obtained from autopsies during the acute or post-acute phase after infection (V), and SARS-CoV-2 RNA detected in stool obtained from individuals with PASC and a control group of individuals with prior SARS-CoV-2 infection but no persistent symptoms (W). Plotted are means ± SEM. n.s. p > 0.05, *p < 0.05, **p < 0.01, ***p < 0.001, ****p < 0.0001. See also Figure S5.
Figure 5.
Figure 5.. Viral inflammation inhibits intestinal amino acid absorption
(A and B) Targeted plasma metabolomics in poly(I:C)-treated mice vs. controls (A) and ACE2−/− vs. ACE2+/+ mice (B). (C) Plasma tryptophan in ACE2+/+, ACE2+/−, and ACE2−/− mice. (D and E) Plasma tryptophan in ACE2+/+ vs. ACE2−/− mice (D) and poly(I:C)-treated mice vs. controls (E) after tryptophan gavage. (F and G) Tryptophan levels in sera (F) and ileal content (G) of poly(I:C)-treated mice 30 min following tryptophan gavage. (H–J) Plasma tryptophan (H) and serotonin (I and J) in poly(I:C)-treated mice fed a Gly-Trp dipeptide diet (H and I) or given the serotonin precursor 5-HTP (J). (K) Schematic of serotonin reduction by viral RNA via reduced tryptophan uptake. Plotted are means ± SEM. n.s. p > 0.05, *p < 0.05, **p < 0.01, ***p < 0.001, ****p < 0.0001. See also Figure S6.
Figure 6.
Figure 6.. Viral inflammation drives thrombocytopenia and serotonin turnover
(A) Cartoon of serotonin transport and degradation. (B–G) Platelet counts in naive or VSV-infected mice (B); LCMV CL13-infected mice at day 15 post-infection (C); and poly(I:C)-treated wild-type (D), TLR3−/− (E), anti-IFNAR-receiving (F), and STAT1−/− mice. (H–L) Mean platelet volume of VSV-infected mice (H) and poly(I:C)-treated wild-type (I), TLR3−/− (J), anti-IFNAR-receiving (K), and STAT1−/− mice (L). (M) Plasma serotonin in mice treated with a platelet-depleting antibody. (N–Q) Representative FACS plot (N and P) and quantification (O and Q) of platelet CD62P expression (N and O) and platelet aggregation (P and Q) in poly(I:C)-treated mice. (R and S) Prothrombin (R) and partial thromboplastin (S) time in poly(I:C)-treated mice. (T–V) Ileal Maoa expression in mice treated with SARS-CoV-2 (USA-WA 1/2020) (T), VSV (U), or poly(I:C) (V). (W–Z) 5-HIAA levels in urine from mice infected with VSV (W) and LCMV ARM or CL13 at day 15 post-infection (X), as well as poly(I:C)-treated wild-type (Y) and STAT1−/− mice (Z). (AA) Platelet serotonin levels of poly(I:C)-treated mice receiving the MAO inhibitor phenelzine. Plotted are means ± SEM. n.s. p > 0.05, *p < 0.05, **p < 0.01, ***p < 0.001, ****p < 0.0001. See also Figure S6.
Figure 7.
Figure 7.. Serotonin deficiency drives cognitive dysfunction via vagal signaling
(A–H) Novel object preference in mice infected with VSV (A) or LCMV ARM or CL13 at day 14 post-infection (B); poly(I:C)-treated wild-type (C), TLR3−/− (D), and IFNAR−/− mice (E); platelet-depleted mice (F); poly(I:C)-treated mice receiving the SSRI fluoxetine (G); and poly(I:C)-treated mice fed a Gly-Trp dipeptide diet (H). (I) Fosb expression in the hippocampus of poly(I:C)-treated mice with or without novel object exposure (NOE). (J and K) Representative images (J) and quantification (K) of cFos+ cells in the dentate gyrus of poly(I:C)-treated mice with or without NOE. Scale bars, 100 μm. (L) Serotonin concentrations in the brains of poly(I:C)-treated mice. (M and N) Representative images (M) and quantification (N) of cFos+ cells in the nucleus tractus solitarii (NTS) of poly(I:C)-treated mice. Scale bars, 100 μm. Outlined are NTS, dorsal motor nucleus (DMX), and central canal (CC). (O) Novel object preference in mice receiving poly(I:C), 5-HTP, or capsaicin. (P–R) Representative images (P) and quantification of cFos+ cells in the dentate gyrus following NOE (Q) and novel object preference (R) of Phox2b-cre mice injected with AAV-hM3Dq, CNO, and poly(I:C). Scale bars, 100 μm. (S) Calcium signaling of cultured vagal neurons exposed to capsaicin or serotonin. (T and U) Novel object preference (T) and quantification of cFos+ cells in the dentate gyrus (U) of mice treated with poly(I:C) and the 5-HT3 receptor agonist m-CPBG. Plotted are means ± SEM. n.s. p > 0.05, *p < 0.05, **p < 0.01, ***p < 0.001, ****p < 0.0001. See also Figure S7.

Similar articles

Cited by

References

    1. Choutka J, Jansari V, Hornig M, and Iwasaki A. (2022). Unexplained post-acute infection syndromes. Nat. Med. 28, 911–923. 10.1038/s41591-022-01810-6. - DOI - PubMed
    1. Al-Aly Z, Xie Y, and Bowe B. (2021). High-dimensional characterization of post-acute sequelae of COVID-19. Nature 594, 259–264. 10.1038/s41586-021-03553-9. - DOI - PubMed
    1. Davis HE, McCorkell L, Vogel JM, and Topol EJ (2023). Long COVID: major findings, mechanisms and recommendations. Nat. Rev. Microbiol. 21, 133–146. 10.1038/s41579-022-00846-2. - DOI - PMC - PubMed
    1. Merad M, Blish CA, Sallusto F, and Iwasaki A. (2022). The immunology and immunopathology of COVID-19. Science 375, 1122–1127. 10.1126/science.abm8108. - DOI - PubMed
    1. Pretorius E, Vlok M, Venter C, Bezuidenhout JA, Laubscher GJ, Steenkamp J, and Kell DB (2021). Persistent clotting protein pathology in Long COVID/Post-Acute Sequelae of COVID-19 (PASC) is accompanied by increased levels of antiplasmin. Cardiovasc. Diabetol. 20, 172. 10.1186/s12933-021-01359-7. - DOI - PMC - PubMed

Publication types