. 2023 Oct 18;8(1):398.
doi: 10.1038/s41392-023-01641-y.

Single-cell transcriptomic analysis reveals a systemic immune dysregulation in COVID-19-associated pediatric encephalopathy

Affiliations

Single-cell transcriptomic analysis reveals a systemic immune dysregulation in COVID-19-associated pediatric encephalopathy

Yi Wang et al. Signal Transduct Target Ther. .

Abstract

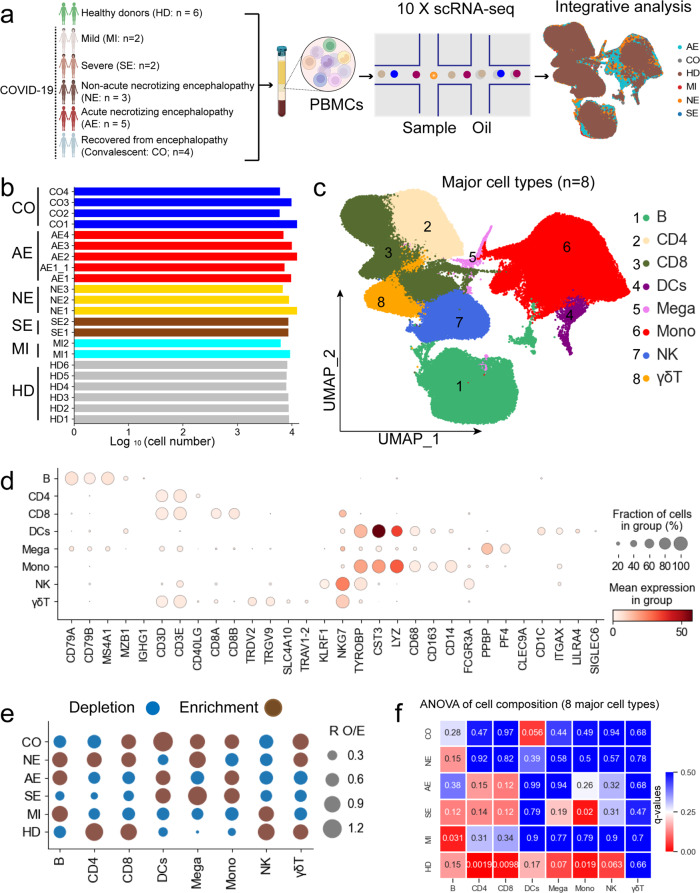
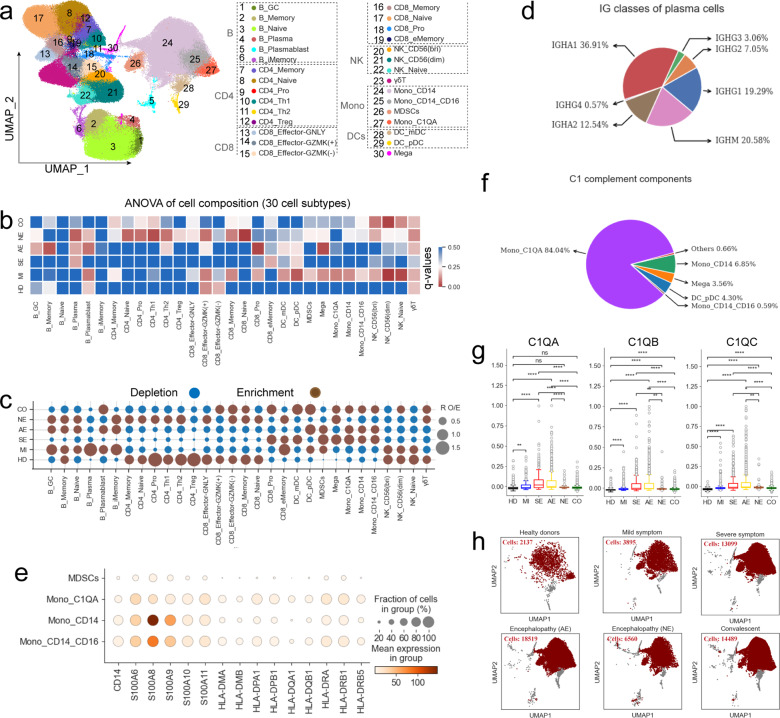
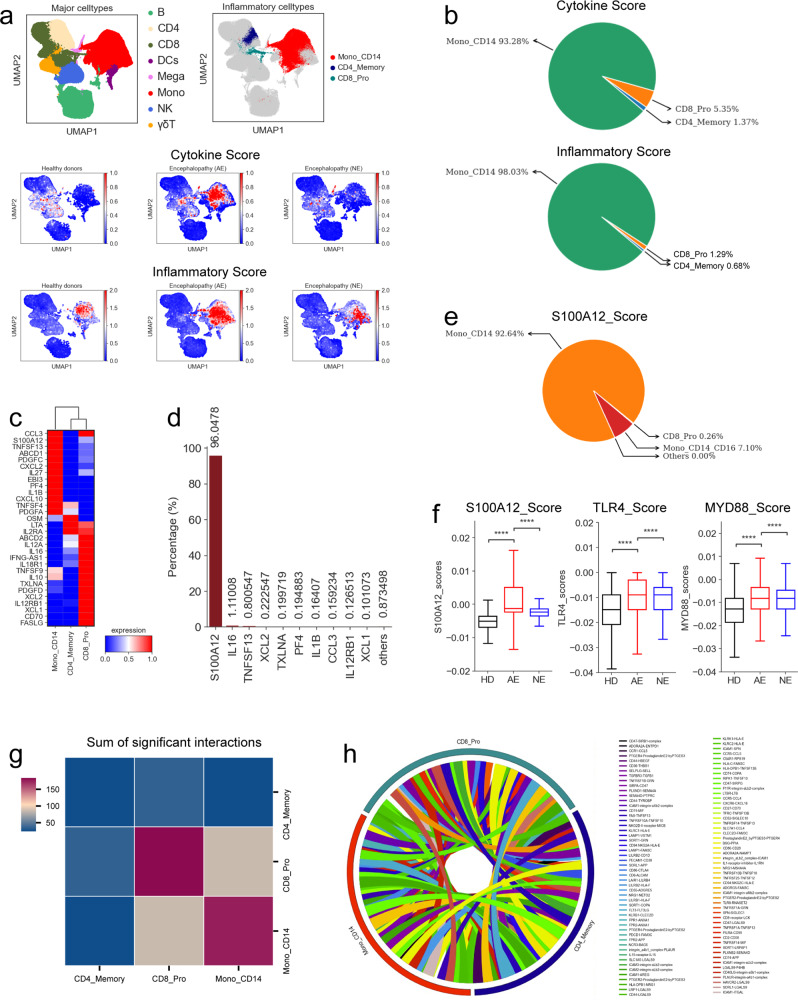
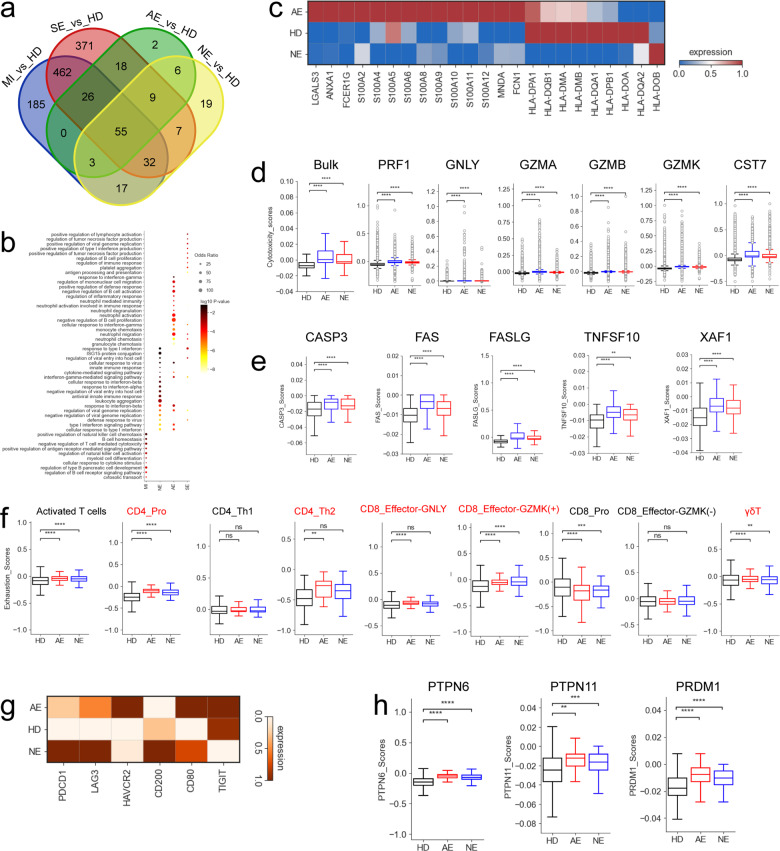
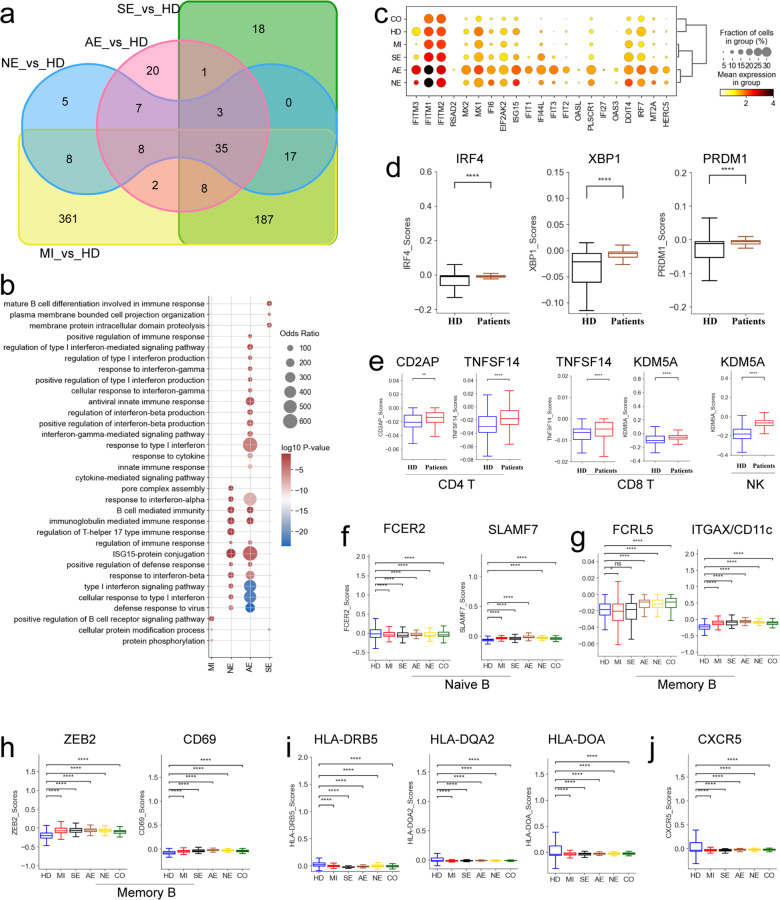
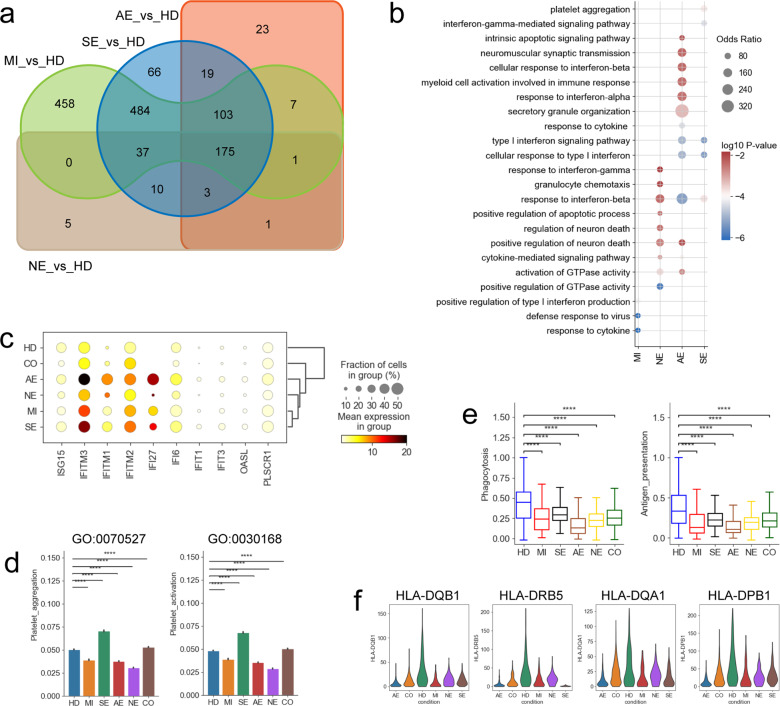
Unraveling the molecular mechanisms for COVID-19-associated encephalopathy and its immunopathology is crucial for developing effective treatments. Here, we utilized single-cell transcriptomic analysis and integrated clinical observations and laboratory examination to dissect the host immune responses and reveal pathological mechanisms in COVID-19-associated pediatric encephalopathy. We found that lymphopenia was a prominent characteristic of immune perturbation in COVID-19 patients with encephalopathy, especially those with acute necrotizing encephalopathy (AE). This was characterized a marked reduction of various lymphocytes (e.g., CD8+ T and CD4+ T cells) and significant increases in other inflammatory cells (e.g., monocytes). Further analysis revealed activation of multiple cell apoptosis pathways (e.g., granzyme/perforin-, FAS- and TNF-induced apoptosis) may be responsible for lymphopenia. A systemic S100A12 upregulation, primarily from classical monocytes, may have contributed to cytokine storms in patients with AE. A dysregulated type I interferon (IFN) response was observed which may have further exacerbated the S100A12-driven inflammation in patients with AE. In COVID-19 patients with AE, myeloid cells (e.g., monocytic myeloid-derived suppressor cells) were the likely contributors to immune paralysis. Finally, the immune landscape in COVID-19 patients with encephalopathy, especially for AE, were also characterized by NK and T cells with widespread exhaustion, higher cytotoxic scores and inflammatory response as well as a dysregulated B cell-mediated humoral immune response. Taken together, this comprehensive data provides a detailed resource for elucidating immunopathogenesis and will aid development of effective COVID-19-associated pediatric encephalopathy treatments, especially for those with AE.


Conflict of interest statement

The authors declare no competing interests.

Figures

Fig. 1
Fig. 1
PBMC single-cell transcriptomic study design and overview of results. a Diagram depicting the overall study design. 22 samples were collected from 17 individuals, including 6 healthy donors and 11 COVID-19 patients (2 patients with mild-moderate disease, 2 patients with severe disease, 3 patients with non-acute necrotizing encephalopathy and 4 patients with acute necrotizing encephalopathy). b Box plots illustrating the log10 transformed number of cells for each sample. 6 HD samples were obtained from healthy donors, 2 MI samples from patients with mild-moderate symptoms, 2 SE samples from patients with severe symptoms, 3 NE samples from patients with non-acute necrotizing encephalopathy, 5 AE samples from patients with acute necrotizing encephalopathy and 4 CO samples from patients who recovered from encephalopathy (convalescent). c The clustering result (Left row) of 8 major cell types (right row) from 22 samples. Each point represents one single cell, colored according to cell type. d Dot plots of the 8 major cell types (Columns) and their marker genes (Rows). e Disease preference of major cell clusters as estimated using RO/E. f Heatmap showing the association between cell composition and disease types. The color represents ANOVA q-values
Fig. 2
Fig. 2
Associations between COVID-19 disease severity and PBMC cellular composition. a UMAP projection showing the 30 cellular subtypes identified from 22 samples. Each dot depicts a single cell while color represents the cell subtype. b Heatmap showing the p-values from ANOVA analysis of differences in cell subtype composition between disease types. Disease severity: HD, MI, SE, AE, NE and CO. c Dot plot depicting the 30 cell subtype disease preference as calculated using RO/E. d Classes of heavy chains for plasma cells from AE. e Dot plot showing the expression of selected monocyte marker genes in monocyte subtypes. f Pie chart depicting the relative contribution of each cell subtype to the C1 complement components. g Box plots showing C1QA, C1QB, and C1QC expression in Mono_ C1QA cells between different groups. Significant differences were determined with a two-sided Student’s T-test with Bonferroni correction. Standard Error (SE) and median are shown. h UMAP projection density plots of Mono_CD14 cells from different groups
Fig. 3
Fig. 3
Contribution of S100A12 to COVID-19 cytokine storms in severe disease. a UMAP projections of PBMCs. Colored based on the 8 major cell types (top left), 3 hyper-inflammatory cell subtypes (top right), cytokine (Middle) and inflammatory score (Bottom). b Pie charts depicting the relative contribution of each inflammatory cell subtype to the cytokine and inflammatory scores. c Heatmap depicting the expression of cytokines within each hyper-inflammatory cell subtype identified. d Bar chart depicting the relative contribution of the top 10 cytokines in COVID-19 patients with acute necrotizing encephalopathy. e Pie charts depicting the relative contribution of each cell subtype to the S100A12-score. f Box plots depicting the S100A12, TLR4 and MYD88 gene expression scores between different groups. Significant differences were determined with a two-sided Student’s T-test with Bonferroni correction. Standard Error (SE) and median are shown. g Heatmap of the sum of significant interaction among the 3 hyper-inflammatory cell subtypes. h Circos plot depicting the ligand-receptor pair interactions between the 3 hyper-inflammatory cell subtypes
Fig. 4
Fig. 4
Gene expression differences in T cells from different COVID-19 groups. a Venn diagram shows number of upregulated DEGs in T cells, comparisons as indicated. b Selected enriched GO BP terms for genes upregulated in T cells. The colored bars show Log10 P-value. c Heatmap depicting normalized expression for selected neutrophil activation associated genes and HLA-II genes in T cells between different groups (HD, AE and NE). d Box plots depicting cytotoxicity scores (Left) and cytotoxicity-related genes expressed in T cells from different groups (HD, AE and NE). e Box plots depicting apoptosis-related gene expression in T cells between different groups (HD, AE and NE). f Box plots depicting exhaustion scores in effector T cells between different groups (HD, AE and NE). g Heatmap depicting normalized exhaustion-related gene expression in T cells between different groups (HD, AE and NE). h Box plots depicting selected genes expressed in T cells between different groups (HD, AE and NE). Significant differences in d, e, f and h were determined with a two-sided Student’s T-test with Bonferroni correction. Standard Error (SE) and median are shown
Fig. 5
Fig. 5
Gene expression differences in B cells from different COVID-19 groups. a Venn diagram shows number of upregulated DEGs in B cells, comparisons as indicated. b Selected enriched GO BP terms for genes upregulated in B cells. The colored bars show Log10 P-value. c Dot plots of selected IFN-response genes in B cells between groups. d Box plots of the selected genes in B cells between COVID-19 patients and healthy donors. e Box plots of selected genes in CD4 (Left), CD8 (Middle) and NK (Right) cells between COVID-19 patients and healthy donors. f Box plots depicting selected genes expressed in naïve B cells from different groups. g Box plots depicting selected genes expressed in memory B cells from different groups. h Box plots depicting ZEB2 and CD69 gene expression in memory B cells from different groups. i Box plots depicting HLA-II gene expression in B cells from different groups. j Box plots depicting CXCR5 expression in B cells from different groups. Significant differences in d, e, f, g, h, i and j were determined with a two-sided Student’s T-test with Bonferroni correction. Standard Error (SE) and median are shown
Fig. 6
Fig. 6
Gene expression differences in myeloid cells from different COVID-19 groups. a Venn diagram shows number of upregulated DEGs in myeloid cells, comparisons as indicated. b Selected enriched GO BP terms for genes upregulated in myeloid cells. The colored bars show Log10 P-value. c Dot plots of selected IFN-response genes in myeloid cells between groups. d Bar plots of the normalized expression score for two GO gene sets (platelet_aggregation (GO:0070527) and platelet_activation (GO:0042113)) in megakaryocytes. e Box plots of phagocytosis scores and antigen presentation scores in DCs. f Violin plots of representative HLA-II genes in DCs from different COVID-19 groups. Significant differences in d, e were determined with a two-sided Student’s T-test with Bonferroni correction. Standard Error (SE) and median are shown

References

    1. Wang Y, et al. Proteomic and metabolomic signatures associated with the immune response in healthy individuals immunized with an inactivated SARS-CoV-2 vaccine. Front. Immunol. 2022;13:848961. doi: 10.3389/fimmu.2022.848961. - DOI - PMC - PubMed
    1. Zhang PP, et al. COVID-19-associated monocytic encephalitis (CAME): histological and proteomic evidence from autopsy. Signal Transduct. Target Ther. 2023;8:24. doi: 10.1038/s41392-022-01291-6. - DOI - PMC - PubMed
    1. Ruhl L, et al. Endothelial dysfunction contributes to severe COVID-19 in combination with dysregulated lymphocyte responses and cytokine networks. Signal Transduct. Target Ther. 2021;6:418. doi: 10.1038/s41392-021-00819-6. - DOI - PMC - PubMed
    1. Chen N, et al. Epidemiological and clinical characteristics of 99 cases of 2019 novel coronavirus pneumonia in Wuhan, China: a descriptive study. Lancet. 2020;395:507–513. doi: 10.1016/S0140-6736(20)30211-7. - DOI - PMC - PubMed
    1. Lapostolle F, et al. Clinical features of 1487 COVID-19 patients with outpatient management in the Greater Paris: the COVID-call study. Intern Emerg. Med. 2020;15:813–817. doi: 10.1007/s11739-020-02379-z. - DOI - PMC - PubMed

Publication types

Substances