. 2023 Oct 17;14(1):6565.
doi: 10.1038/s41467-023-42315-1.

Thalamic nucleus reuniens coordinates prefrontal-hippocampal synchrony to suppress extinguished fear

Affiliations

Thalamic nucleus reuniens coordinates prefrontal-hippocampal synchrony to suppress extinguished fear

Michael S Totty et al. Nat Commun. .

Abstract

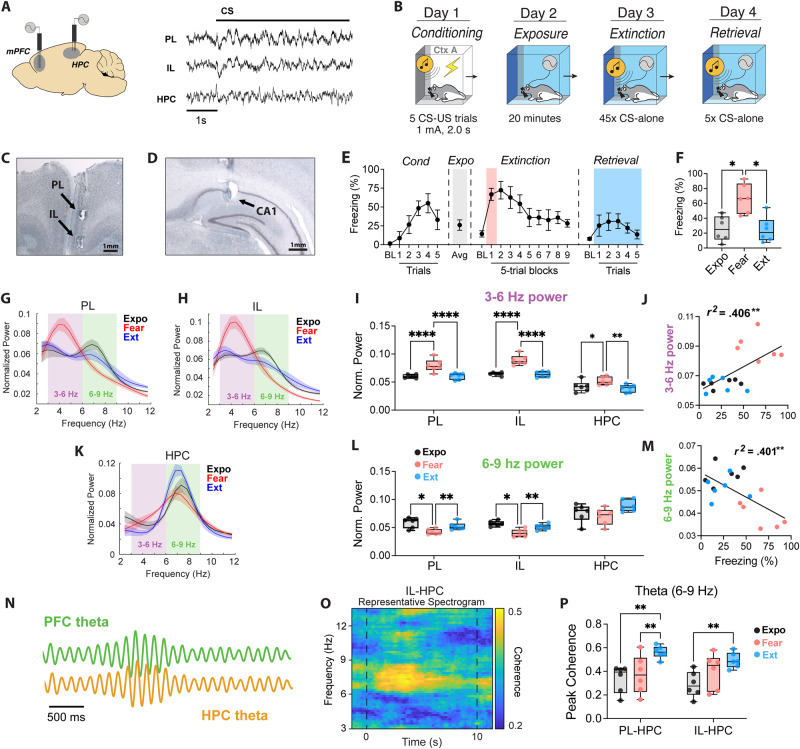
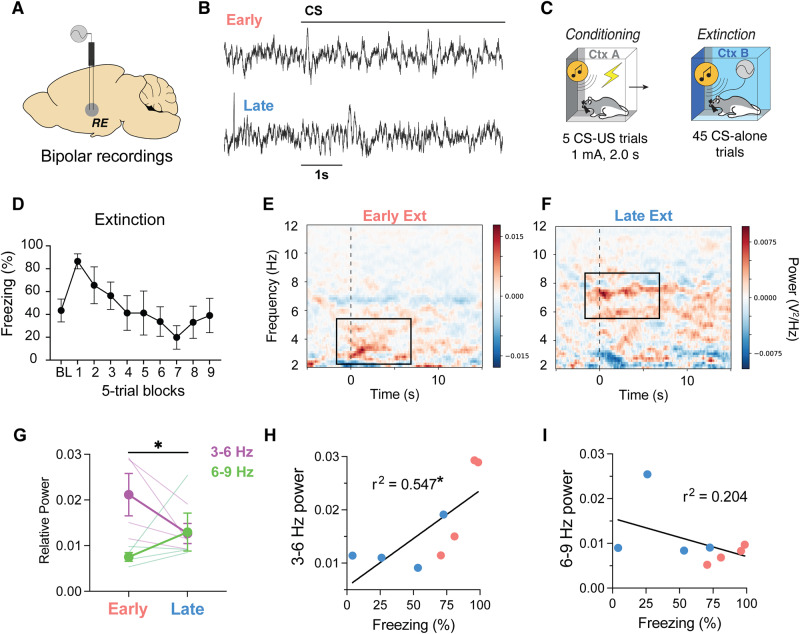
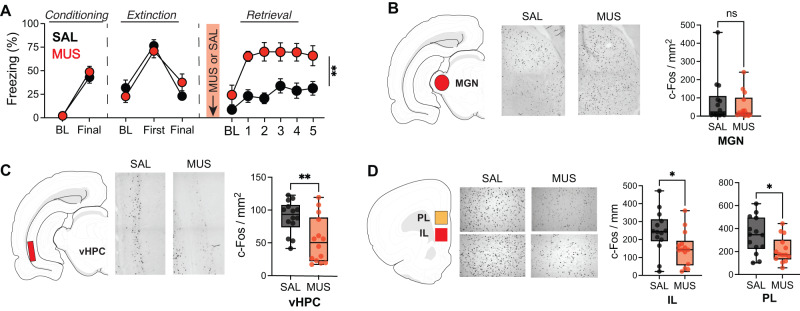
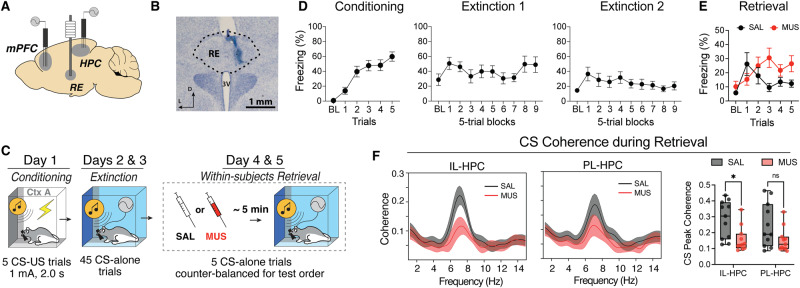
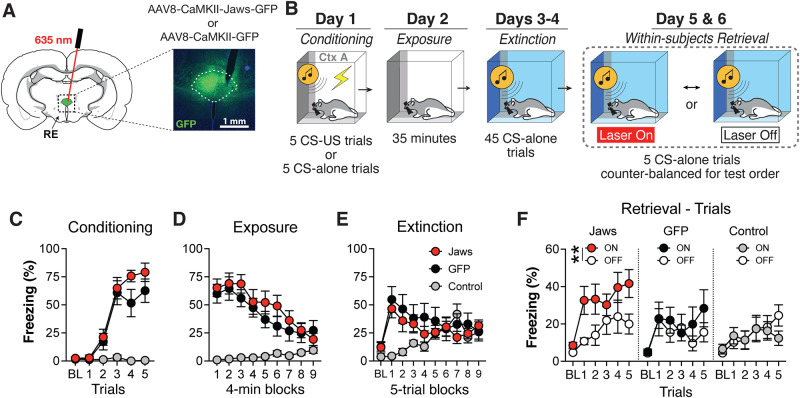
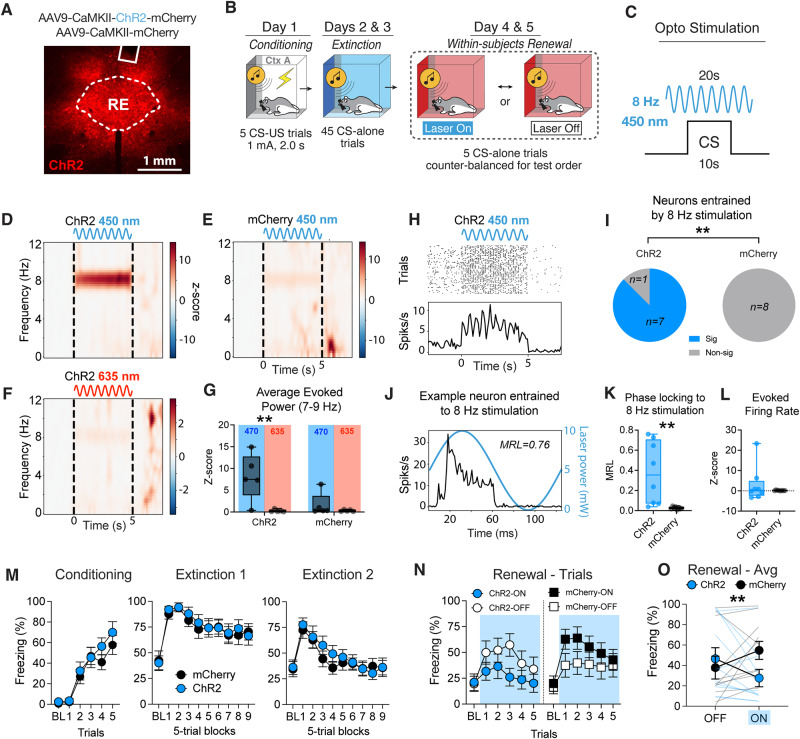
Traumatic events result in vivid and enduring fear memories. Suppressing the retrieval of these memories is central to behavioral therapies for pathological fear. The medial prefrontal cortex (mPFC) and hippocampus (HPC) have been implicated in retrieval suppression, but how mPFC-HPC activity is coordinated during extinction retrieval is unclear. Here we show that after extinction training, coherent theta oscillations (6-9 Hz) in the HPC and mPFC are correlated with the suppression of conditioned freezing in male and female rats. Inactivation of the nucleus reuniens (RE), a thalamic hub interconnecting the mPFC and HPC, reduces extinction-related Fos expression in both the mPFC and HPC, dampens mPFC-HPC theta coherence, and impairs extinction retrieval. Conversely, theta-paced optogenetic stimulation of RE augments fear suppression and reduces relapse of extinguished fear. Collectively, these results demonstrate a role for RE in coordinating mPFC-HPC interactions to suppress fear memories after extinction.


Conflict of interest statement

The authors declare no competing interests.

Figures

Fig. 1
Fig. 1. In vivo electrophysiological recordings during context exposure, fear extinction, and extinction retrieval.
A Illustration and representative traces of mPFC and HPC local field potential recordings (LFPs). B Behavioral timeline of the fear conditioning protocol. Representative photomicrographs show mPFC (C) and HPC (D) electrode placements. Similar photomicrographs were taken to confirm electrode placement for all animals. E Averaged freezing behavior (n = 6; 3 male and 3 female) during fear conditioning, context exposure, extinction, and extinction retrieval (BL = baseline). F Average freezing during fear retrieval during the first five trials of extinction (Fear) was greater than context exposure (Expo; p = 0.044, repeated measures one-way ANOVA with Tukey’s multiple comparison test) and the five extinction retrieval trials (Ext; p = 0.024). G, H, K Normalized spectral power of theta-range oscillations in the prelimbic (PL) and infralimbic (IL) cortex and the HPC during 10 s CS presentations across days. I Normalized 3–6 Hz power was elevated during Fear recall in the PL relative to Exposure (p < 0.0001) and Extinction (p < 0.0001). This was also observed in the IL (p < 0.0001; p < 0.0001) and HPC (p = 0.048; p = 0.006). L Conversely, 6–9 Hz power was decreased during Fear recall in the PL relative to Exposure (p = 0.0305) and Extinction (p < 0.002). This was likewise observed in the IL (p = 0.0109; p = 0.0092). J, M Linear regression of freezing vs IL theta-range power during Expo, Fear and Ext. N Cartoon illustrating synchronous theta oscillations. O Example coherogram depicting high mPFC-HPC theta coherence during extinction retrieval. P Average peak coherence of 6–9 Hz oscillations between the PL and HPC was highest during extinction retrieval, compared to exposure (p = 0.002) and fear retrieval (p = 0.008). IL-HPC coherence was also greater during extinction retrieval relative to context exposure (p = 0.005). BL baseline, CS conditioned stimulus, PL prelimbic cortex, IL infralimbic cortex, HPC hippocampus. Line plots represent mean ± s.e.m.s; boxplots represent mean plus minima and maxima with lower and upper quantiles. *p < 0.05; **p < 0.01; ***p < 0.001; ****p < 0.0001. Source data are provided as a Source Data file.
Fig. 2
Fig. 2. The nucleus reuniens displays theta-range rhythms that correlate with conditioned freezing across extinction learning.
A Illustration and (B) raw traces of bipolar electrophysiological field recordings from the RE. C Behavioral timeline showing that field recordings took place during fear extinction after all rats were conditioned the previous day in distinct contexts. D Average freezing behavior (n = 4; 2 male and 2 female) during fear extinction training. Baseline subtracted spectrograms showing increased 3–6 Hz power (E) during the first five trials of extinction (Early) and increased 6–9 Hz power (F) during the last five trials of extinction (Late). G Average normalized power for 3–6 Hz oscillations decreased from early to late extinction, whereas 6–9 Hz power increased (p = 0.041, two-way ANOVA). Relationship of freezing behavior vs 3–6 Hz power (H) and 6–9 Hz power (I). RE = nucleus reuniens of the thalamus, CS conditioned stimulus. Line plots represent mean ± s.e.m.s. *p < 0.05. Source data are provided as a Source Data file.
Fig. 3
Fig. 3. Pharmacological inactivation of RE suppresses Fos expression in mPFC and HPC during after relapse of extinguished fear.
A Freezing behavior during conditioning, first and last trial of extinction, and extinction retrieval after saline (SAL; n = 14 males) or muscimol (MUS; n = 14 males) infusions into the RE. Fear relapse induced by MUS inactivation of the RE did not impair c-Fos expression in the MGN (p = 0.485, unpaired t-test) (B), but did reduce c-Fos expression in both the vHPC (p = 0.006) (C) and both IL (p = 0.031) and PL (p = 0.022) subregions of the mPFC (D). MGN medial geniculate nucleus of the thalamus, vHPC ventral hippocampus, IL infralimbic cortex, PL prelimbic cortex. Line plots represent mean ± s.e.m.s; boxplots represent mean plus minima and maxima with lower and upper quantiles. *p < 0.05; **p < 0.01. Source data are provided as a Source Data file.
Fig. 4
Fig. 4. Pharmacological inactivation of RE impairs mPFC-HPC synchrony.
A Illustration depicting electrode and cannula placements. B Representative photomicrograph showing injector tip placement in the RE. Similar photomicrographs were taken to confirm placements for all animals. C Behavioral timeline. D Average freezing behavior (n = 11; 8 male and 3 female) across fear conditioning and extinction. E Freezing behavior showing that muscimol inactivation of the RE impairs extinction retrieval. F Average theta-range spectral coherence between the mPFC and HPC after either muscimol or saline infusion in the RE. Muscimol inactivation of the RE impaired IL-HPC 6–9 Hz coherence (p = 0.017, two-way ANOVA with Bonferroni correction). mPFC medial prefrontal cortex, HPC hippocampus, RE nucleus reuniens of the thalamus. Line plots represent mean ± s.e.m.s; boxplots represent mean plus minima and maxima with lower and upper quantiles. *p < 0.05. Source data are provided as a Source Data file.
Fig. 5
Fig. 5. Optogenetic inactivation of the RE selectively impairs extinction memory retrieval.
A Illustration depicting fiber placement and intracranial injections of either the active Jaws (AAV8-CaMKII-Jaws-GFP) or GFP control virus (AAV8-CaMKII-GFP) into the RE. B Experimental timeline. Average freezing behavior during fear conditioning (C), context exposure (D), and extinction (E). F Average freezing behavior during extinction retrieval showing that optogenetic inhibition of the RE selectively increases freezing in conditioned animals expressing the active Jaws virus (n = 12; 5 male and 7 female; p = 0.0044, two-way ANOVA with Bonferroni correction), but not GFP (n = 10; 6 male and 4 female; p = 0.969) or non-conditioned control animals (n = 8; 5 male and 3 female; p > 0.999). RE nucleus reuniens of the thalamus, GFP green fluorescent protein. Line plots represent mean ± s.e.m.s. **p < 0.01. Source data are provided as a Source Data file.
Fig. 6
Fig. 6. Sinusoidal 8-Hz stimulation of the RE attenuates the renewal of extinguished fear.
A A representative image showing viral expression and optic fiber placement targeting the RE. Similar photomicrographs were taken to confirm placements for all animals. B Experimental timeline for fear renewal procedure. C Schematic of the optogenetic stimulation protocol by which RE neurons were stimulated with an 8-Hz sine wave pattern beginning five seconds before CS onset and stopping five seconds after CS termination. D Spectrograms showing that blue-laser stimulation using 8-Hz sine waves induces 8-Hz rhythms in the RE LFPs of ChR2-expressing rats, (E) but not control mCherry-expressing rats. F Red-laser stimulation was also insufficient to induce 8-Hz rhythms in ChR2 rats. G Average laser-evoked theta power was greatest in ChR2 under blue-laser stimulation, relative to red-laser (n = 5/group, p = 0.0014, two-way ANOVA with Bonferroni correction). H Raster plot of one example single unit phase-locked to blue-laser stimulation in a ChR2-expressing rat. I 8-Hz sinusoidal stimulation entrained 7/8 RE units in ChR2-expressing rats, compared to 0/8 units in mCherry-expressing rats (n = 8 units/group, p = 0.0014, Fisher’s exact test). J Average firing rate in relation to the phase of laser stimulation of the same example neuron in H. K 8-Hz sinusoidal stimulation strongly entrained the firing of RE neurons (n = 8 units/group, p = 0.0061, Unpaired t-test), (L) despite not uniformly increasing their firing rates (p = 0.374, Unpaired t-test). M Average freezing data during conditioning and extinction sessions. N Freezing behavior during fear renewal trials shows that sinusoidal 8-Hz stimulation of RE attenuates fear renewal (p = 0.006; Three-way ANOVA, Laser x Group interaction) in rats expressing ChR2 (n = 11; p = 0.0493, Bonferroni correction) and not mCherry (n = 11; p = 0.0835, Bonferroni correction). O This is further confirmed by comparing the average freezing across the five CS trials (p = 0.004; Two-way ANOVA, Laser × Group interaction). RE nucleus reuniens of the thalamus, MRL mean resultant length. Line plots represent mean ± s.e.m.s; boxplots represent mean plus minima and maxima with lower and upper quantiles. *p < 0.05; **p < 0.01. Source data are provided as a Source Data file.

References

    1. Ressler KJ, et al. Post-traumatic stress disorder: clinical and translational neuroscience from cells to circuits. Nat. Rev. Neurol. 2022;18:273–288. doi: 10.1038/s41582-022-00635-8. - DOI - PMC - PubMed
    1. Milad MR, Quirk GJ. Fear extinction as a model for translational neuroscience: ten years of progress. Annu. Rev. Psychol. 2012;63:129–151. doi: 10.1146/annurev.psych.121208.131631. - DOI - PMC - PubMed
    1. Kaczkurkin AN, Foa EB. Cognitive-behavioral therapy for anxiety disorders: an update on the empirical evidence. Dialogues Clin. Neurosci. 2015;17:337–346. doi: 10.31887/DCNS.2015.17.3/akaczkurkin. - DOI - PMC - PubMed
    1. Bouton ME, Maren S, McNally GP. Behavioral and neurobiological mechanisms of pavlovian and instrumental extinction learning. Physiol. Rev. 2021;101:611–681. doi: 10.1152/physrev.00016.2020. - DOI - PMC - PubMed
    1. Myers KM, Davis M. Mechanisms of fear extinction. Mol. Psychiatry. 2007;12:120–150. doi: 10.1038/sj.mp.4001939. - DOI - PubMed

Publication types