. 2023 Oct 17;14(1):6569.
doi: 10.1038/s41467-023-42303-5.

Phagocytosis-initiated tumor hybrid cells acquire a c-Myc-mediated quasi-polarization state for immunoevasion and distant dissemination

Affiliations

Phagocytosis-initiated tumor hybrid cells acquire a c-Myc-mediated quasi-polarization state for immunoevasion and distant dissemination

Chih-Wei Chou et al. Nat Commun. .

Abstract

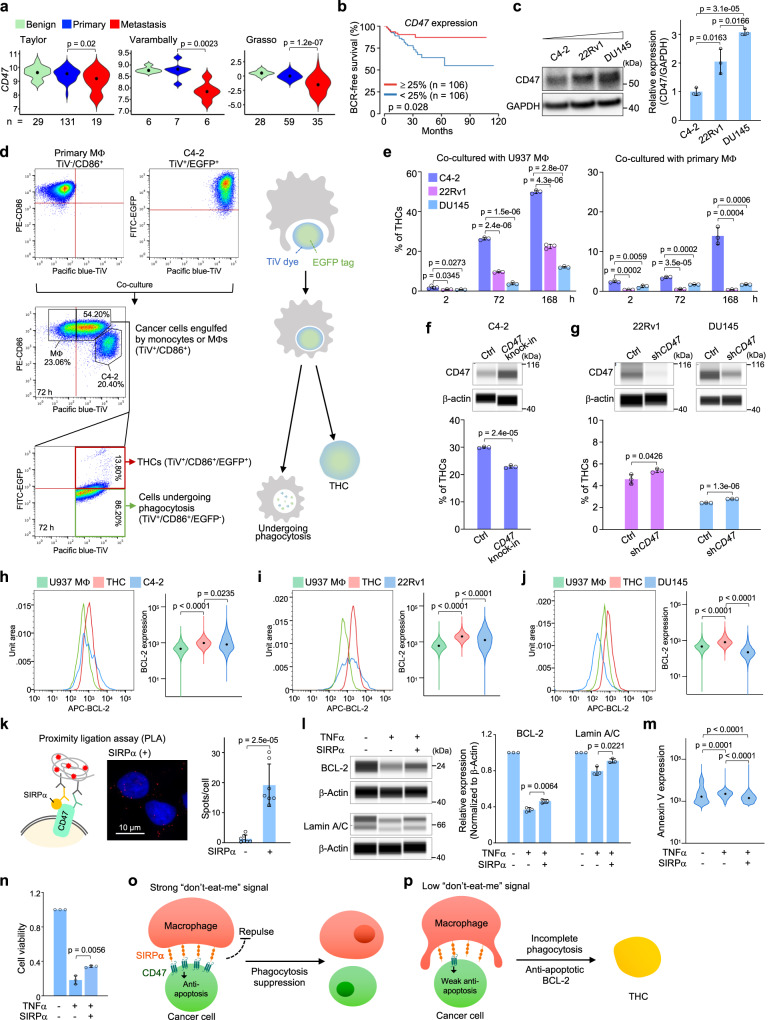
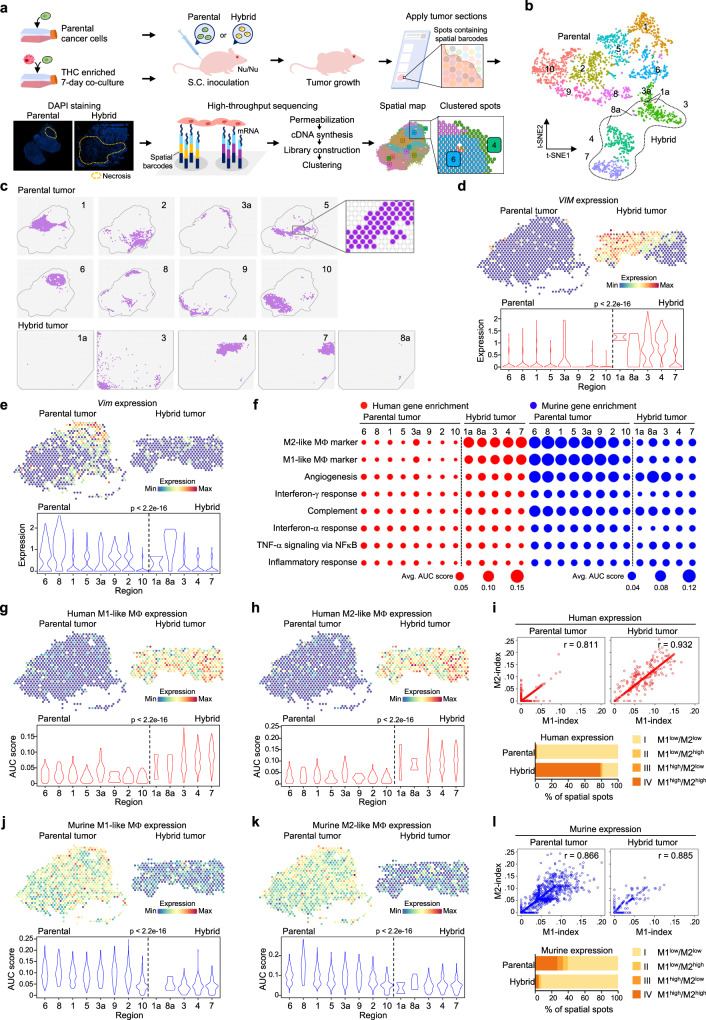
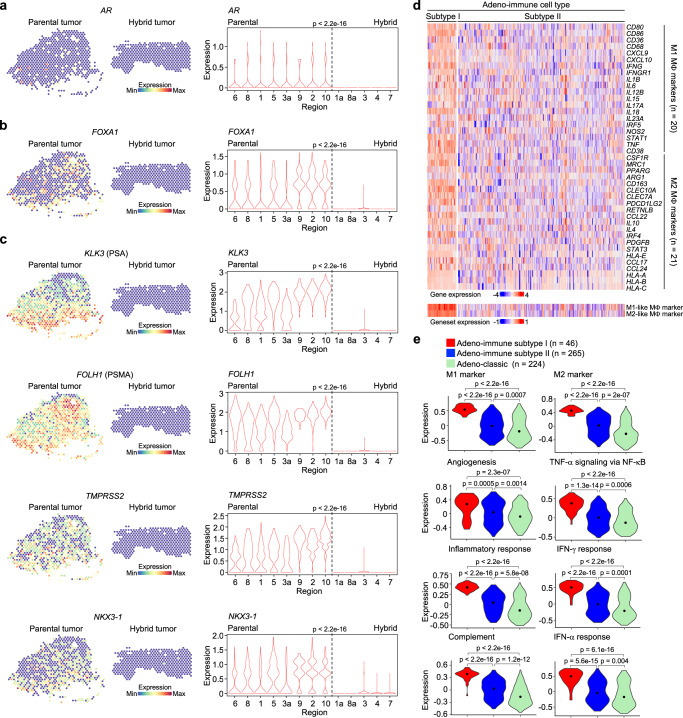
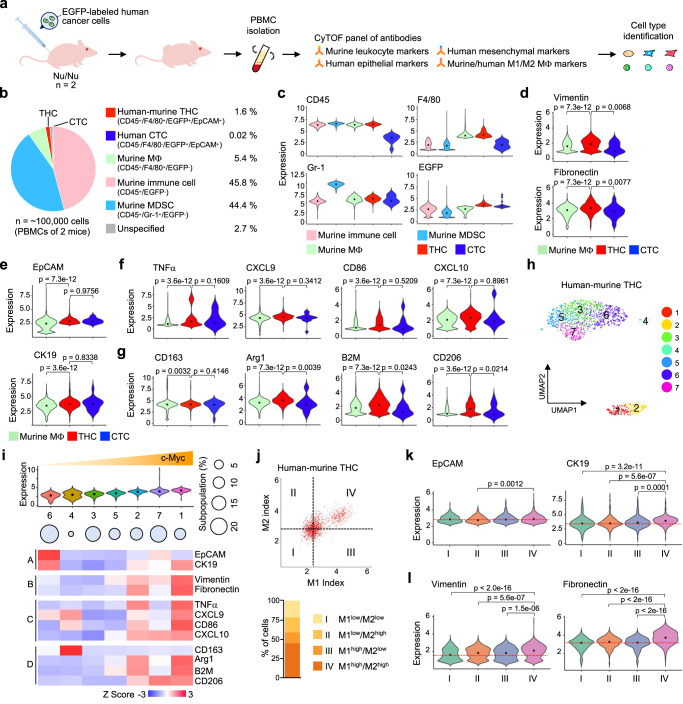
While macrophage phagocytosis is an immune defense mechanism against invading cellular organisms, cancer cells expressing the CD47 ligand send forward signals to repel this engulfment. Here we report that the reverse signaling using CD47 as a receptor additionally enhances a pro-survival function of prostate cancer cells under phagocytic attack. Although low CD47-expressing cancer cells still allow phagocytosis, the reverse signaling delays the process, leading to incomplete digestion of the entrapped cells and subsequent tumor hybrid cell (THC) formation. Viable THCs acquire c-Myc from parental cancer cells to upregulate both M1- and M2-like macrophage polarization genes. Consequently, THCs imitating dual macrophage features can confound immunosurveillance, gaining survival advantage in the host. Furthermore, these cells intrinsically express low levels of androgen receptor and its targets, resembling an adenocarcinoma-immune subtype of metastatic castration-resistant prostate cancer. Therefore, phagocytosis-generated THCs may represent a potential target for treating the disease.


Conflict of interest statement

The authors declare no competing interests.

Figures

Fig. 1
Fig. 1. Low CD47 facilitates THC formation between macrophages and cancer cells.
a CD47 expression levels in benign prostatic hyperplasia, primary, and metastatic tumors analyzed from three published prostate cancer datasets. b Biochemical recurrence (BCR)-free survival of the prostate cancer patients in the TCGA cohort. c Western blotting analysis of CD47 expression levels in three human prostate cancer cell lines. d A representative example of flow cytometry analysis of THCs in human primary macrophage and C4-2 cell co-culture model. Some CD86+ macrophages acquire Tag-it-Violet (TiV) dyes through engulfing cancer cells in co-culture. The cells maintained EGFP expression in this TiV+/CD86+ population were further identified as THCs. e Percentage of THCs in different co-culture models at different time points. f, g Percentage of THCs in 3-day co-cultures of U937 macrophages and CD47 overexpressed (e) or knockdown (g) cells. hj Flow cytometry histograms and the corresponding violin plots showing BCL-2 expression in U937 macrophages and C4-2 (h), 22Rv1 (i), or DU145 (j) cells co-culture model. k Left: schematic diagram of proximity-ligation assay (PLA). Right: PLA signals of C4-2 cells with or without SIRPα stimulation. The dots represent mean values of total PLA counts per cell (n = 7 images/group, 180 cells analyzed). ln Effects of C4-2 cells unstimulated or stimulated by TNFα or TNFα combined with SIRPα. Capillary Western immunoassay (WES) showing BCL-2 and Lamin A/C expression (l), violin plots showing Annexin V expression (m), and bar graph showing cell viability (n each dot represents the mean for each independent experiment). o Schematic diagram showing strong “don’t-eat-me” signals effectively inhibit phagocytosis. p Schematic diagram showing low “don’t-eat-me” signals allow macrophages to engulf cancer cells but partially increase the pro-survival function of cancer cells to escape from complete phagocytosis, subsequently resulting in THC formation. Data are the mean ± SD. P-values were determined using a two-sided unpaired t-test (a, c, el, n), a log-rank test (b), and a one-way ANOVA followed by Tukey test (m). Three independent experiments were carried out in (c, eg, l, n). Source data for c, en are provided as a Source Data file.
Fig. 2
Fig. 2. Spatial transcriptomics analysis unveils an increased expression of human immune markers in hybrid tumor.
a Workflow of spatial transcriptomics analysis of xenograft C4-2 and enriched THCs tumors. See detailed experimental protocol in the Methods. b t-SNE plot depicting ten main and three minor regions in parental and hybrid tumors. Note: regions 1, 3, and 8 were shared in both parental and hybrid tumors. c The corresponding spatial spots of each region in the parental and hybrid tumor sections. d, e The expression of human (d) or murine (e) vimentin gene. Upper: representative spatial heatmap in the parental tumor regions 1, 5, and 6, and hybrid tumor regions 4 and 7. Lower: violin plot showing the expression in each region. f Relative enrichment of eight immune-related genesets across different regions by AUCell analysis. The dot size represents the average gene signature score over all spots in each region. g, h The expression of human M1-like (g) and M2-like (h) macrophage genesets. Upper: representative spatial heatmap in the parental tumor regions 1, 5, and 6, and hybrid tumor regions 4 and 7. Lower: violin plot showing the expression in each region. i Upper: correlation of human M1-like and M2-like index values, each scatter dot represents a spatial spot. Lower: proportion of four categories stratified based on the upper quartile of the human M1- and M2-like index values. j, k The expression of murine M1-like (g) and M2-like (h) macrophage genesets. Upper: representative spatial heatmap in the parental tumor regions 1, 5, and 6, and hybrid tumor regions 4 and 7. Lower: violin plot showing the expression in each region. l Upper: the correlation of murine M1- and M2-like index values. Lower: proportion of four categories stratified based on the upper quartile of murine M1- and M2-like index values. P-values were determined using a two-sided Spearman’s rank correlation (d, e, g, h, j, k).
Fig. 3
Fig. 3. Elevated c-Myc obtained from parental cancer cells upregulates M1- and M2-like macrophage genes in THCs.
a Flow cytometry histogram of c-Myc expression in co-cultured macrophages, cancer cells, and THCs. b The corresponding violin plot of a. c Representative immunoFISH images of MYC loci (white dots) and c-Myc expression (red) in parental C4-2 (n = 58 cells), U937 macrophages (n = 54 cells), and THCs (n = 62 cells). Scale bar, 5 µm. d ChIP-qPCR of c-Myc (upper), RNA polymerase II (middle), or IgG (lower) binding to the promoter regions of M1- and M2-like genes of two independent hybrid tumors, parental macrophages, and parental C4-2 cancer cells (n = 3 technical repeats). The schematic diagram of the promoter region of each gene was shown. Red bars, primer amplicon sites. Scale bar, 200 bp. e Real-time RT-qPCR of the expression of M1- and M2-like genes in two independent hybrid tumors, parental macrophages, and parental C4-2 cancer cells (n = 3 technical repeats). f WES showing c-Myc expression in the THC line created from hybrid tumor, CWC cells, infected with scramble or shMYC lentivirus. g Real-time RT-qPCR of the expressions of M1- and M2-like genes in CWC cells infected with scramble or shMYC lentivirus (n = 3 technical repeats). h The population of CD8+ T cells, regulatory CD25+/CD4+ T cells, or naive CD25/CD4+ T cells in human peripheral blood mononuclear cells (PBMCs) after co-cultured with CWC cells infected with scramble or shMYC lentivirus (n = 3 independent experiments). i Proposed model depicting the transcription of c-Myc-mediated M1- and M2-like genes in THCs. Data are the mean ± SD. P-values were determined using a one-way ANOVA followed by Tukey test (b) and a two-sided unpaired t-test (h). Data represent two independent experiments (d, e, g). Source data for b, d, e, g, h are provided as a Source Data file.
Fig. 4
Fig. 4. Increased c-Myc is associated with upregulated M1- and M2-like macrophage genes and epithelial-mesenchymal plasticity in metastatic human hybrid tumor.
a Schematic diagram of serial transplantation of human hybrid tumor in mice. THCs in the femur and spine were enriched through bone-in-culture array (BICA). A metastatic tumor found after serial transplantation was analyzed by single-cell proteomic cytometry by time-of-flight (CyTOF). b, c Representative inverted microscope images (b, n = 5 mice) and immunofluorescence images (c, n = 2 mice) of BICA cells. A bi-nucleated cell was shown in cell #1 in panel c. Scale bar, 10 µm. d Growth curves of the secondary (purple, n = 5 mice) and tertiary (red, n = 5 mice) transplanted hybrid tumors. e A visible metastatic lesion in the thoracic cavity of one mouse transplanted with hybrid tumors and an intestinal lesion in another xenotransplanted mouse. fm The thoracic metastatic tumor was analyzed by CyTOF. f CyTOF gating strategy to identify metastatic human THCs and host cells in the thoracic metastatic tumor. g Pie chart showing the proportions of cell types in the thoracic metastatic tumor. h UMAP plot depicting 15 subpopulations of metastatic human THCs. i Upper: the 15 subpopulations identified in (h) were aligned by increased expression levels of c-Myc. Middle: circle plot depicting the subpopulation sizes. Lower: heatmaps showing the expression of epithelial (A), mesenchymal (B), and M1- (C) and M2-like (D) macrophage markers in each subpopulation. j Scatter plot indicating the correlation of M1- and M2-like index values and the expression of c-Myc. k Four categories stratified based on the average of M1- or M2-like index values. Violin plots showing the expression of two epithelial markers (l) and two mesenchymal markers (m) in categories I, II, III, and IV. P-values were determined using a one-way ANOVA followed by Tukey test. Source data for d are provided as a Source Data file.
Fig. 5
Fig. 5. Naturally occurring THCs are observed in murine xenograft models and human prostate cancer patients.
C4-2 cells were inoculated into immunocompromised Nu/Nu mice through subcutaneous (a) or tail vein (b, c) injection (n = 2 mice/group). Representative immunohistochemistry (IHC) images of pan-cytokeratin (pan-CK) and murine macrophage marker F4/80 in the subcutaneous tumor (a), non-tumor liver sites (b), or liver with metastatic tumor (c). Increased resident macrophages were observed in regions adjacent to metastatic liver tumor (b). Note that clonal expansion of THCs was found in the metastatic liver but not in the subcutaneous tumor. Scale bar, 50 µm. di Murine syngeneic prostate RM-1 (df, n = 3 mice) or TRAMP-C2 (gI, n = 2 mice) cancer cells were inoculated into immunocompetent C57BL/6J mice through tail vein injection. Representative IHC images of pan-CK and F4/80 identified macrometastatic (d-arrows) and micrometastatic (g-A′ and B′) lesions in the lungs of RM-1 and TRAMP-C2 inoculated mice, respectively. Infiltrated macrophages (e) and a few THCs (f-arrows) were observed in the RM-1 macrometastatic lesions, while more infiltrated macrophages and more THCs (h, i-arrows) were found in the TRAMP-C2 micrometastatic lesions. These lesions circled by dashed lines A’ and B’ were enlarged in h and i to show the THC clusters, respectively. jp IHC analysis of primary prostate tumors (n = 50 specimens) and metastatic tumors (n = 44 specimens). Representative images of tissue sections showing THCs (expressing pan-CK and CD68, arrows), macrophages (expressing CD68 only, asterisks), and cells engulfed by macrophages. A bi-nucleated THC was shown (j). Workflow of THC analysis in human prostate tumors. Ten regions of each section were categorized into no-, low- (1–4), or high- (>5) THCs (k). Representative image of each Category (l). More Category III regions were identified in metastatic tumors (m). Patients with higher Gleason scores (n), older age (o), or higher PSA level (p) had more Category III regions in the tumor sections. P-values were determined using a two-sided unpaired t-test (m) and a one-way ANOVA followed by Kruskal–Wallis test (np). Source data for mp are provided as a Source Data file.
Fig. 6
Fig. 6. THCs resemble a subtype of metastatic castration-resistant prostate cancer (mCRPC).
ac Spatial transcriptomics analysis of the androgen receptor (AR) signaling in the parental and hybrid tumors. Left: representative spatial heatmap showing the expression of human AR (a), FOXA1 (b), or the AR-target genes KLK3, FOLH1, TMPRSS2, and NKX3-1 (c) in parental tumor regions 1, 5, and 6, and hybrid tumor regions 4 and 7. Right: violin plots showing the mean enrichment scores of the aforementioned genes in each region. Hybrid tumor displayed very low expression of AR-target genes. d, e Two subtypes were identified from the Adeno-immune group of mCRPC from four published RNA-seq datasets based on M1- and M2-like macrophage gene expression. Heatmap depicting elevated expression of M1- and M2-like macrophage genes in Adeno-immune subtype I (d). Violin plots showing the expression of eight immune-related genesets in Adeno-classic, Adeno-immune subtype I, and Adeno-immune subtype II cancer cells (e). See also Supplementary Fig. 7c, d and Supplementary Table 1. P-values were determined using a two-sided Wilcoxon rank-sum test (ac) and a two-sided unpaired t-test (e).
Fig. 7
Fig. 7. Naturally occurring THCs gain more mesenchymal features in the vasculature.
a Schematic diagram of characterizing THCs in the blood circulation of xenograft mice. Nu/Nu mice were subcutaneously inoculated with EGFP-labeled C4-2 cancer cells. The PBMCs isolated from xenograft mice were analyzed by CyTOF. See also Supplementary Table 3. b Pie chart showing the proportions of human-murine THCs, human CTCs, murine macrophages, murine myeloid-derived suppressor cells (MDSCs), other murine immune cells, and unspecified cells in murine PBMCs. c The expression of murine CD45, F4/80, Gr-1, and EGFP in the five cell types. dg The expression of mesenchymal (d), epithelial (e), M1- (f), and M2-like (g) macrophage markers in murine macrophages, human-murine THCs, and CTCs. h, i The human-murine THCs were further stratified into seven subpopulations by PhenoGraph clustering (h) and aligned by increasing expression of c-Myc (i). Heatmap showing the expression of epithelial (A), mesenchymal (B), M1- (C), and M2-like (D) macrophage markers in these subpopulations. j Upper: scatter plot showing the M1- and M2-like index values of circulating human-murine THCs in murine PBMCs. Lower: cells were grouped into four categories based on the average of M1- or M2-like index values. k, l Expression of epithelial (k) and mesenchymal (l) markers in the four categories shown in (j). P-values were determined using a one-way ANOVA followed by Tukey test.
Fig. 8
Fig. 8. THCs are present in PBMCs of prostate cancer patients.
a Immunofluorescence images of cells retained after filtering out small blood cells through the ScreenCell® pores. Arrowhead, THCs expressed both macrophage CD86 and epithelial EpCAM markers. Dashed lines, giant macrophage-like THCs. These images are representative of >100 putative THCs analyzed from 10 patients. Scale bar, 50 µm. bj PBMCs of prostate cancer patients were analyzed by CyTOF (n = 16 patients). b UMAP depicting different cell types based on their specific markers. CTC, circulating tumor cell; NK, natural killer cell; NKT cell, natural killer T cell; PMN-MDSC, polymorphonuclear myeloid-derived suppressor cell. See also Supplementary Fig. 9 and Supplementary Table 6. c Pie chart showing the proportions of each cell type identified by CyTOF. d, e The expression levels of mesenchymal markers Vimentin and Fibronectin (f) and monocyte/macrophage-related markers CD86, CD163, CD14, and CD16 (g) in monocytes/macrophages, THCs, and CTCs. f Left: scatter plot showing the expression levels of CD86 and CD163 in monocytes/macrophages and THCs. Cells were divided into four categories based on the median expression of CD86 and CD163. Right: proportion of the four categories in THCs and monocytes/macrophages. g, h The expression levels of epithelial (g) or mesenchymal (h) markers of putative THCs in the four categories. i, j Ratios of THC numbers to CTC numbers in individual patients. BCR biochemical recurrence, CR/MET castration resistance and/or metastasis. P-values were determined using a one-way ANOVA followed by Tukey test (d, e, g, h) and two-sided unpaired t-test (i, j). Source data for i, j are provided as a Source Data file.

References

    1. Arandjelovic S, Ravichandran KS. Phagocytosis of apoptotic cells in homeostasis. Nat. Immunol. 2015;16:907–917. - PMC - PubMed
    1. Gordon S. Phagocytosis: an immunobiologic process. Immunity. 2016;44:463–475. - PubMed
    1. Elliott MR, et al. Nucleotides released by apoptotic cells act as a find-me signal to promote phagocytic clearance. Nature. 2009;461:282–286. - PMC - PubMed
    1. Ravichandran KS. Find-me and eat-me signals in apoptotic cell clearance: progress and conundrums. J. Exp. Med. 2010;207:1807–1817. - PMC - PubMed
    1. Feng M, et al. Phagocytosis checkpoints as new targets for cancer immunotherapy. Nat. Rev. Cancer. 2019;19:568–586. - PMC - PubMed

Publication types