. 2023 Oct 17;14(1):6531.
doi: 10.1038/s41467-023-42188-4.

Endogenous renal adiponectin drives gluconeogenesis through enhancing pyruvate and fatty acid utilization

Affiliations

Endogenous renal adiponectin drives gluconeogenesis through enhancing pyruvate and fatty acid utilization

Toshiharu Onodera et al. Nat Commun. .

Abstract

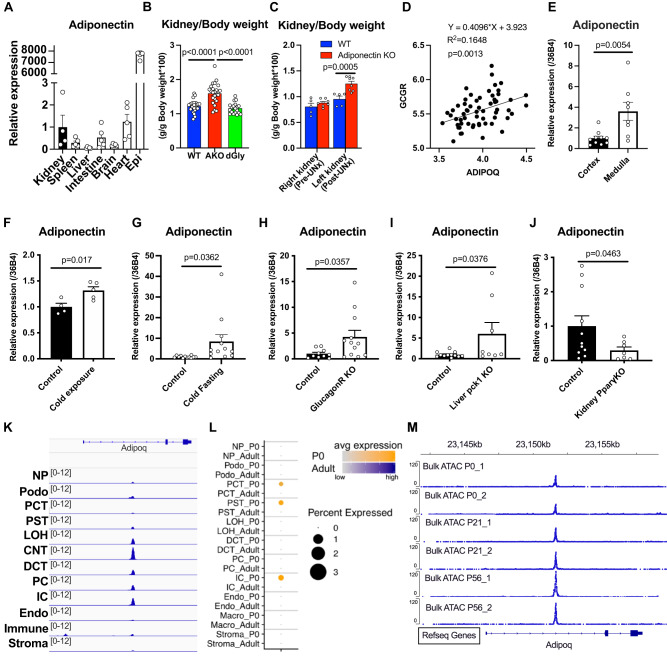
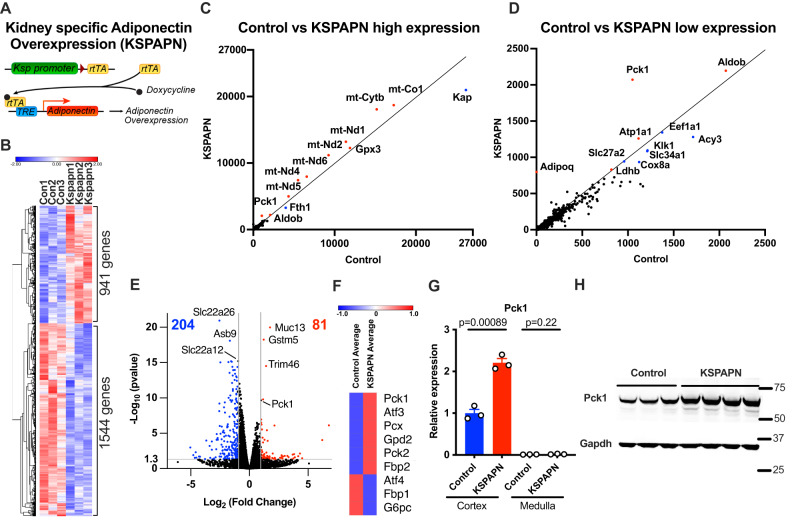
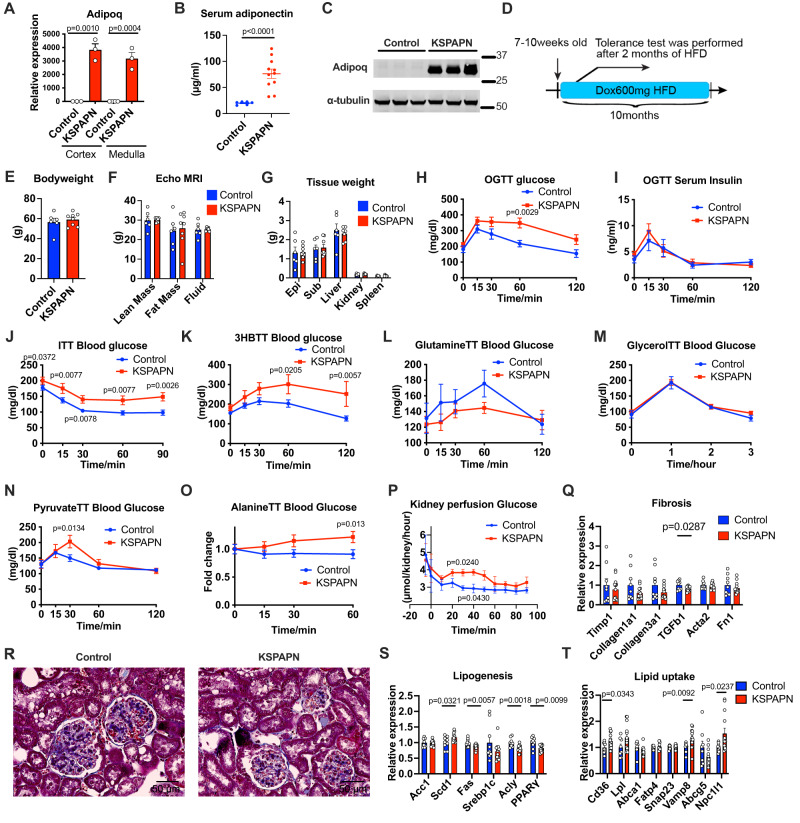
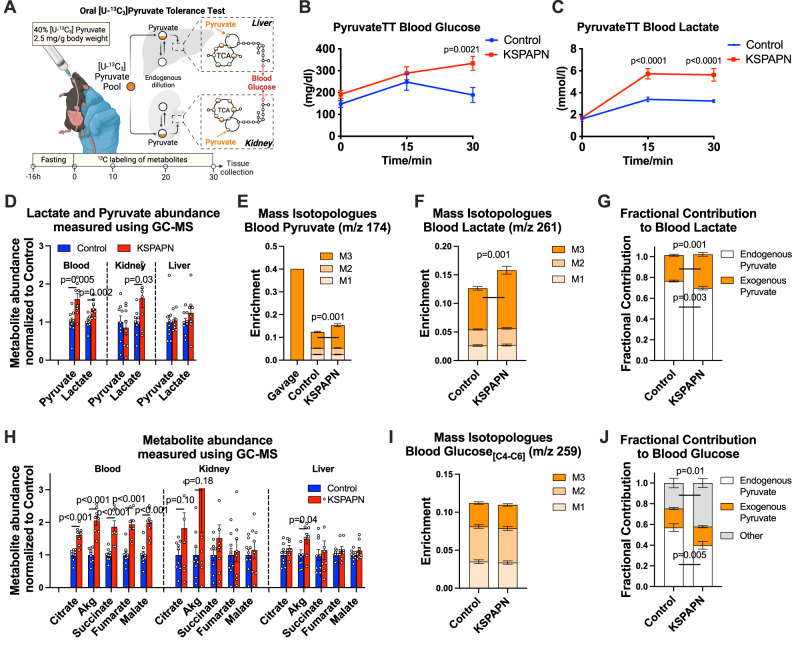
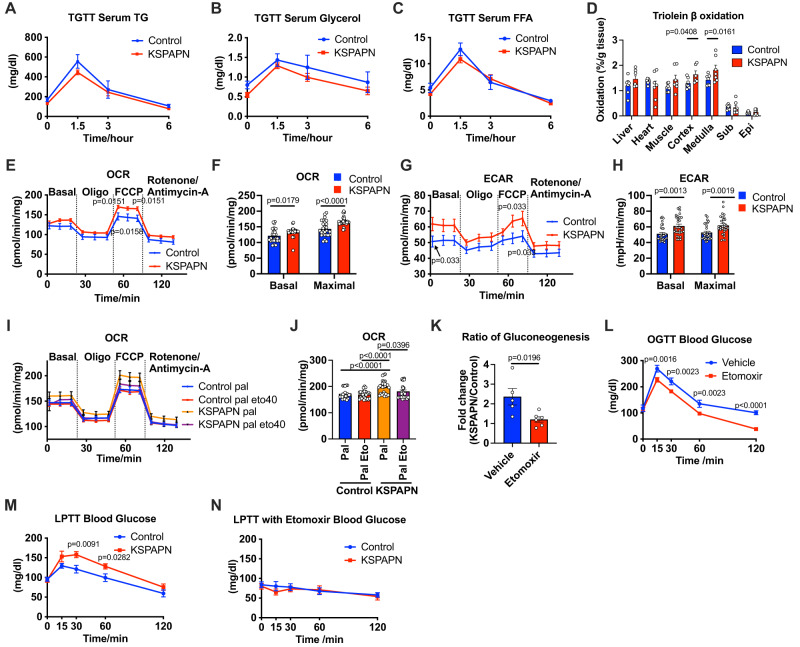
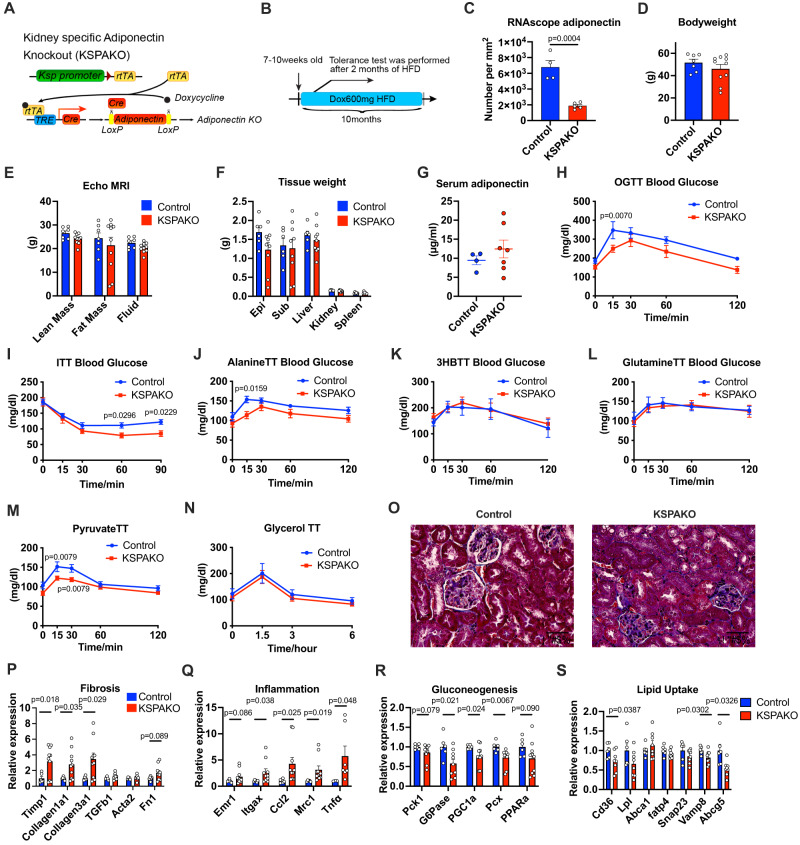
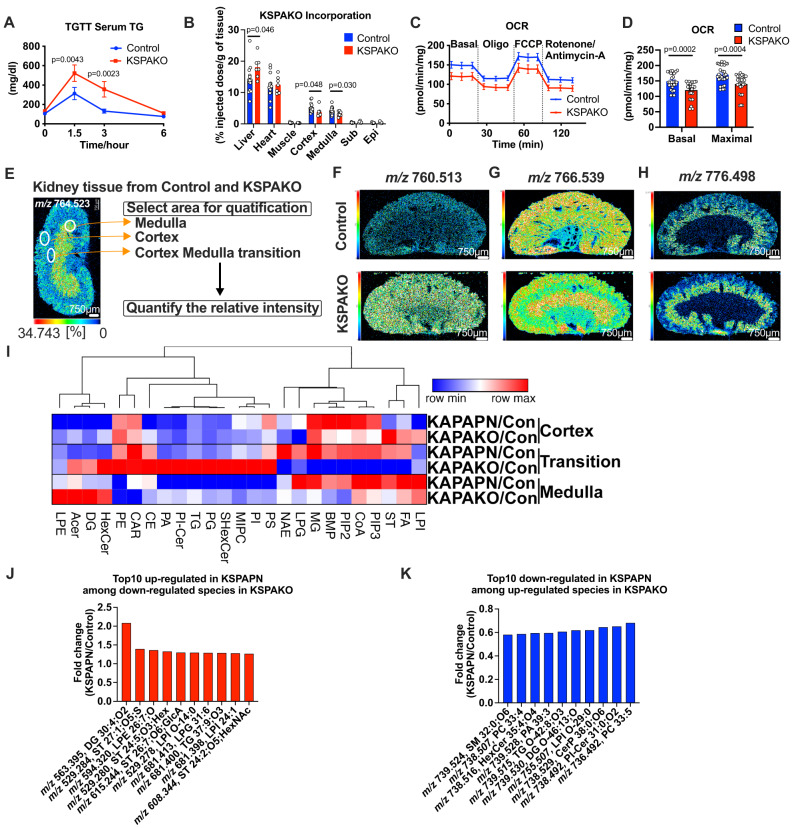
Adiponectin is a secretory protein, primarily produced in adipocytes. However, low but detectable expression of adiponectin can be observed in cell types beyond adipocytes, particularly in kidney tubular cells, but its local renal role is unknown. We assessed the impact of renal adiponectin by utilizing male inducible kidney tubular cell-specific adiponectin overexpression or knockout mice. Kidney-specific adiponectin overexpression induces a doubling of phosphoenolpyruvate carboxylase expression and enhanced pyruvate-mediated glucose production, tricarboxylic acid cycle intermediates and an upregulation of fatty acid oxidation (FAO). Inhibition of FAO reduces the adiponectin-induced enhancement of glucose production, highlighting the role of FAO in the induction of renal gluconeogenesis. In contrast, mice lacking adiponectin in the kidney exhibit enhanced glucose tolerance, lower utilization and greater accumulation of lipid species. Hence, renal adiponectin is an inducer of gluconeogenesis by driving enhanced local FAO and further underlines the important systemic contribution of renal gluconeogenesis.


Conflict of interest statement

The authors declare no competing interests.

Figures

Fig. 1
Fig. 1. The expression and regulation of renal adiponectin.
Determination of adiponectin expression levels, regulation and location of adiponectin expression in kidney cells using wildtype, glucagon receptor KO, liver specific Pck1 KO and kidney-specific PPARγ KO mice. A Adiponectin expression in Epididymal adipose tissue (Epi) (n = 5), kidney (n = 4), spleen (n = 5), liver (n = 5), intestine (n = 5), brain (n = 5) and heart (n = 5). B The kidney weight as a percentage of body weight in wild type (WT) (n = 23), adiponectin knockout (AKO) (n = 25) and delta-Gly adiponectin overexpression (dGly) mice (n = 19). P values were determined by Tukey’s multiple comparison test. C The kidney weight as a percentage of body weight before and after unilateral nephrectomy (UNx) (WT n = 5, AKO n = 8) P values were determined by Sidak’s multiple comparison test. D The expressions of ADIPOQ and GCGR in human kidney biopsy samples from Gene Expression Omnibus (n = 60). E Adiponectin expression in the cortex and medulla in the kidney (Cortex n = 10, medulla n = 8). F Adiponectin expression in the whole kidney after 1 week cold exposure under fed conditions (Control n = 4, cold exposure n = 5). G Adiponectin expression in the whole kidney after 3 days cold exposure and 16-hour fasting (Control and cold fasting n = 12). H Adiponectin expression in the kidney of global glucagon receptor KO mice (Control n = 10, Glucagon R KO n = 12). I Adiponectin expression in the kidney of liver-specific Pck1 KO mice (Albumin-Cre/Pck1 flox mice) (Control n = 12, Liver pck1 KO n = 8) J Adiponectin expression in the kidney of kidney-specific PPARγ KO mice (Six2-Cre/PPARγ flox mice) (Control n = 11, Kidney PPARγ KO n = 7). K Single cell-seq reads were mapped to the reference genome. Visualization of adiponectin expression using IGV. Abbreviations are as follows. NP nephron progenitors; Podo podocyte; PCT proximal convoluted tubule; PST proximal straight tubule; LOH ascending loop of Henle; CNT connecting tubule; DCT distal convoluted tubule; PC collecting duct principal cell; IC collecting duct intercalated cell; Endo containing endothelial, vascular, and descending loop of Henle; Immune cells, including macrophages, neutrophils, lymphocytes; Stroma, stromal cell. L Scatter plot representation of adiponectin expression in each kidney cell type in adult kidney and postnatal day (P)0 (P0) kidneys. M ATAC-seq reads mapped to the adiponectin locus was visualized by IGV software. ATAC-seq was performed in duplicate utilizing whole kidney of P0, P21 and P56. Data are mean ± SEM. Unpaired two-tailed student t-tests were performed from E to J.
Fig. 2
Fig. 2. RNAseq analysis of renal adiponectin overexpression mice exhibit higher gluconeogenic signature.
Whole kidneys were harvested after 4 days of doxycycline 600 mg/kg chow diet treatment with KsprtTA mice (Controls) and KsprtTA/TRE-adiponectin mice (KSPAPN). 3 mouse samples were pooled. 3 RNA-seq data reactions represent a total of 9 mouse samples. A Schematic representation of the doxycycline-inducible kidney-specific adiponectin overexpression mouse model (KSPAPN). B Hierarchical clustering of transcriptional profiles in control and KSPAPN (n = 3). C Scatter plot representation of protein-coding gene transcriptional profiles in controls and KSPAPN mice (n = 3). The range of fpkm is from 0 to 27000. D Scatter plot representation of protein-coding gene transcriptional profiles in controls and KSPAPN mice (n = 3). The range of fpkm is from 0 to 2500. E Volcano plots of protein-coding gene transcriptional profiles comparing P-value vs. fold-change. Unpaired two-tailed student t-tests were performed to determine p-value. While 81 genes were significantly up-regulated, 204 genes were significantly down-regulated. (n = 3). F Hierarchical clustering of genes involved in gluconeogenesis pathway. (n = 3). G Gene expression of Pck1 in the cortex and medulla in control and KSPAPN kidney (n = 3). Unpaired two-tailed student t-tests were performed to determine p value. H Western blot of Pck1 protein in control and KSPAPN kidney (Control n = 3, KSPAPN n = 4). Data are mean ± SEM.
Fig. 3
Fig. 3. Renal adiponectin overexpression mice exhibit an enhanced gluconeogenic phenotype.
A Validation of adiponectin overexpression in the cortex and the medulla of the kidney after 1week doxycycline treatment (600 mg per kg diet weight) (Control Cortex n = 3, KSPAPN cortex n = 3, KSPAPN medulla n = 3, Control Medulla n = 4). B Serum adiponectin levels after 1week doxycycline treatment (Control n = 6, KSPAPN: n = 11). C Representative western blot of adiponectin (top) and α-tubulin (bottom) (n = 3). D Schematic illustration of the time course of the experiment. Doxycycline 600 mg/kg containing (dox600) HFD was started at the age of 7–10 weeks old. Tolerance tests were performed after 2months of HFD dox600. Tissues were harvested after 10 months of HFD feeding. E Bodyweight after 10 months of HFD dox600 (Control n = 6, KSPAPN n = 8). F Body composition measured by echo nuclear magnetic resonance (echo MRI) (Control n = 6, KSPAPN: n = 8). G Tissue weight after 10 months of HFD dox600 (Control n = 5, KSPAPN: n = 10). H Blood Glucose levels at different time points in OGTT (Control n = 5, KSPAPN: n = 10). I Blood insulin level at different time points in OGTT (Control n = 5, KSPAPN: n = 10). J Blood glucose level at different time points after insulin injection (Control n = 16, KSPAPN: n = 20). K Blood glucose levels at different time points after 3HB injection (Control n = 10, KSPAPN n = 7). L Blood glucose level at different time points after Glutamine injection (Control n = 6, KSPAPN n = 11). M Blood glucose levels at different time points after glycerol injection (Control n = 6, KSPAPN n = 11). N Blood glucose levels at different time points after pyruvate gavage (Control n = 8, KSPAPN n = 7). O Blood glucose levels (fold-change) at different time points after alanine injection (Control n = 14, KSPAPN n = 10). P Glucose production rate per kidney during the perfusion of kidneys with pyruvate-containing perfusate (n = 3). Q Gene expression of fibrosis markers (Control n = 9, KSPAPN n = 13). R Representative trichrome staining images of the kidney. (Scale bar: 50μm) S Gene expression of lipogenesis markers (Control n = 9, KSPAPN n = 13). T Gene expression of lipid uptake markers (Control n = 8, KSPAPN n = 13). Data are mean ± SEM. 2way ANOVA with 2-stage linear step-up procedure of BKY correction for multiple comparisons was performed to determine p-value from (H) to (P). Multiple unpaired two-tailed t-tests with 2-stage linear step-up procedure of BKY correction for multiple comparisons were utilized to determine p-values for (Q), (S) and (T).
Fig. 4
Fig. 4. Adiponectin affects pyruvate metabolism and sources of glucose carbon increases during OPTT.
A Schematic illustration of oral [U-13C3]pyruvate tolerance test (OPTT). 2.5 g/kg pyruvate solution containing 40% [U-13C3]pyruvate was gavaged to KSPAPN mice after 1.5 months HFD dox600 feeding. Blood, liver and kidney were harvested at the 30-minute time point. We defined the carbon contribution of pyruvate to each metabolite by analyzing the amount and percentage of each metabolite that contains labeled carbons by mass spectrometry. Created with BioRender.com. B Blood glucose levels at 0, 15, 30-minute time point during OPTT (Control n = 8, KSPAPN n = 8). C Blood lactate levels at 0, 15, 30-minute time point during OPTT (Control n = 9, KSPAPN n = 8). D Tissue concentration of lactate and pyruvate in KSPAPN normalized to Control at 30-minute time point (Control n = 9, KSPAPN n = 8). E–F Mass isotopomer distribution (MID) of (E) blood pyruvate (with representative 40% enrichment of gavaged pyruvate) (Control n = 9, KSPAPN n = 8) and (F) blood lactate. M0 omitted for clarity of presentation (Control n = 9, KSPAPN n = 8). G Fractional contribution (FC) of gavaged pyruvate (40% tracer labeling in gavage solution) to blood lactate in control and KSPAPN plasma 30 minutes after the [U-13C3]pyruvate gavage FCLactate←Gavaged Pyruvate = [APELactate]/[APEGavaged Pyruvate]. (Control n = 9, KSPAPN n = 8). H Tissue concentration of metabolites in KSPAPN normalized to Control at 30-minute time point (Control n = 9, KSPAPN n = 8). I MID of blood glucose (carbons 4–6), M0 omitted for clarity of presentation (Control n = 9, KSPAPN n = 8). J The fractional contribution of gavaged-pyruvate, endogenous pyruvate and other carbon sources to the blood glucose (Control n = 9, KSPAPN n = 8). Data are mean ± SEM. Two-tailed unpaired Student’s t test was used from (D) to (J). ANOVA with 2-stage linear step-up procedure of BKY correction for multiple comparisons was performed to determine p-values for (B) and (C).
Fig. 5
Fig. 5. Renal lipid metabolism enhances renal gluconeogenesis.
A Blood TG level at different time point during TG clearance test (Control n = 6, KSPAPN n = 11). B Blood glycerol level at different time point during TG clearance test (Control n = 6, KSPAPN n = 11). C Blood-free fatty acid level at different time points during the TG clearance test (Control n = 6, KSPAPN n = 11). D 3H-triolein lipid oxidation in tissues, including cortex and medulla, under chow diet conditions (Control n = 7, KSPAPN n = 7). Multiple unpaired two-tailed t-tests with 2-stage linear step-up procedure of BKY correction for multiple comparisons were performed to determine p-values E and F Oxygen consumption rate (OCR) of KSPAPN kidney tissues at basal level and after oligomycin (Oligo), FCCP and rotenone/antimycin-A treatment (Control n = 9, KSPAPN n = 10). G and H Extracellular acidification rate (ECAR) of kidney tissues at basal level, Oligo, FCCP and rotenone/antimycin-A treatment (Control n = 9, KSPAPN n = 10). I and J OCR of KSPAPN kidney tissue in the presence of palmitate with or without etomoxir. (Control pal n = 9, Control pal eto40 n = 10, KSPAPN pal n = 9, KSPAPN pal eto40 n = 9) 1-way ANOVA with 2-stage linear step-up procedure of BKY correction for multiple comparisons were performed to determine p-values for (J). K The ratio of glucose production from primary cultured KSPAPN kidney cortex cells with or without etomoxir treatment (Control n = 5, KSPAPN n = 6). Unpaired two-tailed student’s t-test was performed for statistics. L Blood glucose levels during an OGTT upon 20 mg/kg bodyweight etomoxir treatment (Vehicle n = 8, Etomoxir n = 7). M Blood glucose level in Lactate/pyruvate tolerance test in KSPAPN mice (Control n = 11, KSPAPN n = 10). N Blood glucose levels during a lactate/pyruvate tolerance test in KSPAPN mice (Control n = 9, KSPAPN n = 10). Data are mean ± SEM. 2-way ANOVA with 2-stage linear step-up procedure of BKY correction for multiple comparisons were performed to determine p-values for (E), (F), (G), (H), (L) and (M).
Fig. 6
Fig. 6. Renal adiponectin KO mice exhibit an impaired gluconeogenic phenotype.
A Schematic illustration of the kidney-specific, doxycycline-inducible Adiponectin KO mouse model (KSPAKO). In this mouse model, KsprtTA expresses a rtTA specifically in kidney tubular cells. In the presence of Dox, rtTA activates the transcription of the TRE-Cre transgene. The Cre recombinase in turn clips the LoxP sites and converts the locus to the KO alleles. B Schematic representation of the time course of the experiment. Tolerance tests were performed 2 months after the start of HFD. Tissues were harvested after 10 months of HFD feeding. C Quantitation of adiponectin RNAscope signal in kidney tissues per mm2 (Control n = 4, KSPAKO n = 5). D Bodyweight of KSPAKO mice after 10 months of HFD dox600 (Control n = 7, KSPAKO n = 10). E Body composition measured by echo MRI (Control n = 7, KSPAKO n = 10). F Tissue weights of KSPAKO mice after 10 months of HFD dox600 (Control n = 6, KSPAKO n = 9). G Serum adiponectin levels in KSPAKO mice (Control n = 4, KSPAKO n = 7). H Blood Glucose levels at different time points during an OGTT (Control n = 7, KSPAKO n = 9). I Blood Glucose levels at different time points in ITT (Control n = 15, KSPAKO n = 12). J Blood glucose levels at different time points during an alanine tolerance test (Control n = 7, KSPAKO n = 10). K Blood glucose levels at different time points during a 3-hydroxybutyrate (3HB) tolerance test (Control n = 7, KSPAKO n = 10). L Blood glucose levels at different time points during a glutamine tolerance test (Control n = 7, KSPAKO n = 10). M Blood glucose levels at different time points during a pyruvate tolerance test (Control n = 10, KSPAKO n = 11). N Blood glucose levels at different time points during a glycerol tolerance test (Control n = 7, KSPAKO n = 10). O Representative trichrome staining images of the kidney. (Scale bar: 50 μm). P Gene expression of fibrosis markers (Control n = 6, KSPAKO n = 10). (Control n = 5, KSPAKO n = 10 for Acta2). Q Gene expression analysis of inflammation markers (Control n = 6, KSPAKO n = 10), (Control n = 3, KSPAKO n = 7 for Tnfα), (Control n = 5, KSPAKO n = 10 for Mrc1). R Gene expression analysis of gluconeogenesis markers (Control n = 6, KSPAKO n = 10), (Control n = 6, KSPAKO n = 10 for G6Pase). S Gene expression analysis of lipid uptake markers (Control n = 6, KSPAKO n = 8). Data are mean ± SEM. 2-way ANOVA with 2-stage linear step-up procedure of BKY correction for multiple comparisons were performed to determine p-values for (H), (I), (J) and (M). Multiple unpaired two-tailed t-tests with 2-stage linear step-up procedure of BKY correction for multiple comparisons were performed to determine p-values for (P), (Q), (R) and (S).
Fig. 7
Fig. 7. Adiponectin deficiency in renal tubular epithelial cells disrupts lipid uptake and alters lipid distribution.
A Blood TG levels at different time points during a TG clearance test (Control n = 8, KSPAKO n = 9). B 3H-triolein lipid incorporation into organs under chow diet conditions (Control n = 14, KSPAKO n = 7). Multiple unpaired two-tailed t-tests with 2-stage linear step-up procedure of BKY correction for multiple comparisons were performed to determine p-values. C and D OCR of KSPAKO kidney tissue at basal levels and after oligomycin (Oligo), FCCP and rotenone/antimycin-A treatment (Control n = 10, KSPAKO n = 9). E False color mass spectrometry image of m/z 764.523 depicting three main areas of the kidney; cortex, medulla and, cortex medulla transition area. For calculations, three regions of interest were selected in each main area of the kidney for each analyzed cryosection. The average intensity of each lipid specie was quantified by IMAGEREVEAL™ MS. (Scale bar: 750 μm) F m/z 760.513 lipid specie was increased in cortex, transition area and medulla. (n = 3) (Scale bar: 750 μm) G m/z 766.539 lipid specie was down-regulated in the cortex and transition area. (n = 3) H m/z 776.498 lipid specie was increased in the cortex and transition area. (n = 3). I The heatmap of the ratio of relative intensity of lipid species (KSPAKO/control and KSPAPN/control) in the cortex, transition area and medulla. (n = 9) The lipid species observed at each m/z value were annotated into Lyso Phosphatidylethanolamines (LPE), Acyl Ceramide (Cer) (ACer), Diglycerides (DG), Hexosyl-Cer (HexCer), Phosphatidylethanolamines (PE), Acyl carnitines (CAR), Cholesteryl ester (CE), Phosphatidic acids (PA), Phosphatidylinositol-Cer (PI-Cer), Triglycerides (TG), Phosphatidylglycerols (PG), Sulfatides (SHexCer), Mannosyl-inositolphosphoceramides (MIPC), Phosphatidylinositols (PI), Phosphatidylserines (PS), N-acyl ethanolamines (NAE), Lyso Phosphatidylglycerols (LPG), Monoglycerides (MG), Bisphosphates (BMP), Phosphatidylinositol-biphosphates (PIP2), Acyl CoAs (CoA), Phosphatidylinositol-triphosphates (PIP3), Sterols (ST), Fatty acids (FA) and Lyso Phosphatidylinositols (LPI). J The top10 lipid species up-regulated in KSPAPN transition area that are down-regulated less than 0.75-fold in KSPAKO transition area. K The top10 lipid species down-regulated in KSPAKO transition area that are upregulated more than 2-fold in KSPAKO transition area. The fold change was calculated from the relative intensity that was obtained from 3 different area in 3 of KSPAPN or KSPAKO mice. Data are mean ± SEM. 2-way ANOVA with 2-stage linear step-up procedure of BKY correction for multiple comparisons were performed to determine p-values for (A) and (D).

References

    1. Croset M, et al. Rat small intestine is an insulin-sensitive gluconeogenic organ. Diabetes. 2001;50:740–746. - PubMed
    1. Mather, A. & Pollock, C. Glucose handling by the kidney. Kidney Int Suppl, S1-S6. 10.1038/ki.2010.509, (2011). - PubMed
    1. Mithieux G, et al. Induction of control genes in intestinal gluconeogenesis is sequential during fasting and maximal in diabetes. Am. J. Physiol. Endocrinol. Metab. 2004;286:E370–E375. - PubMed
    1. Potts A, et al. Cytosolic phosphoenolpyruvate carboxykinase as a cataplerotic pathway in the small intestine. Am. J. Physiol. Gastrointest. Liver Physiol. 2018;315:G249–G258. - PMC - PubMed
    1. Meyer C, et al. Renal substrate exchange and gluconeogenesis in normal postabsorptive humans. Am. J. Physiol. Endocrinol. Metab. 2002;282:E428–E434. - PubMed

Publication types