. 2023 Dec 1;146(12):4916-4934.
doi: 10.1093/brain/awad303.

Microbiota from Alzheimer's patients induce deficits in cognition and hippocampal neurogenesis

Affiliations

Microbiota from Alzheimer's patients induce deficits in cognition and hippocampal neurogenesis

Stefanie Grabrucker et al. Brain. .

Erratum in

Abstract

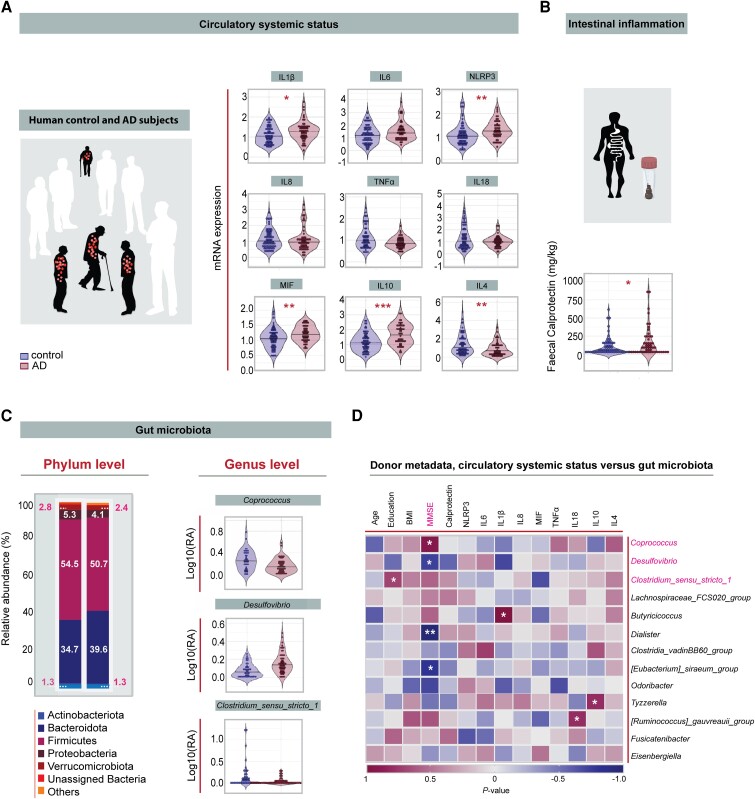
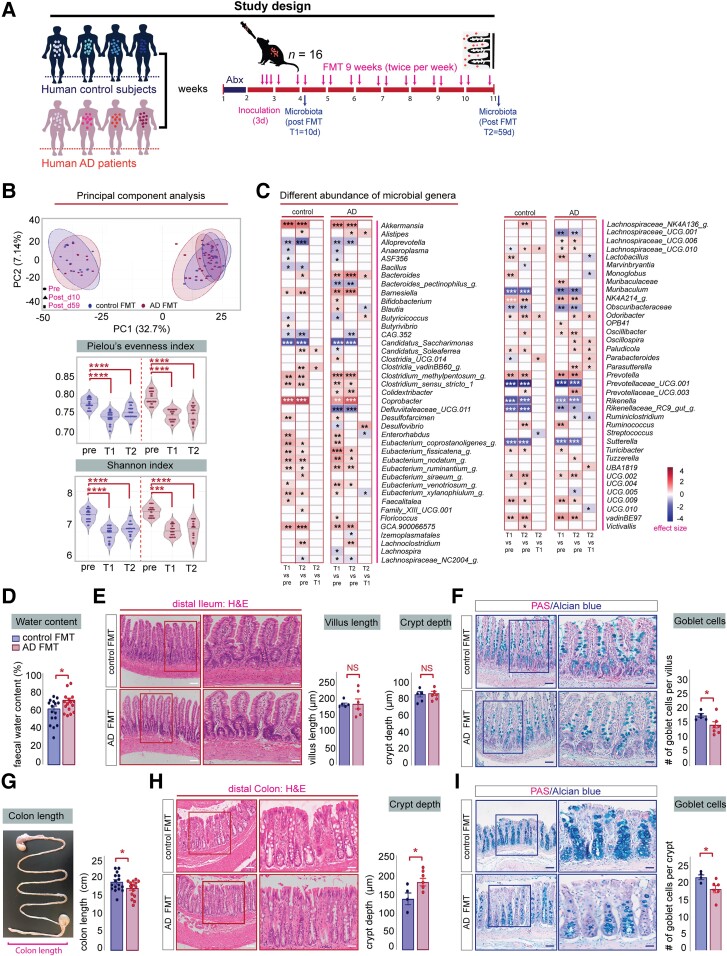
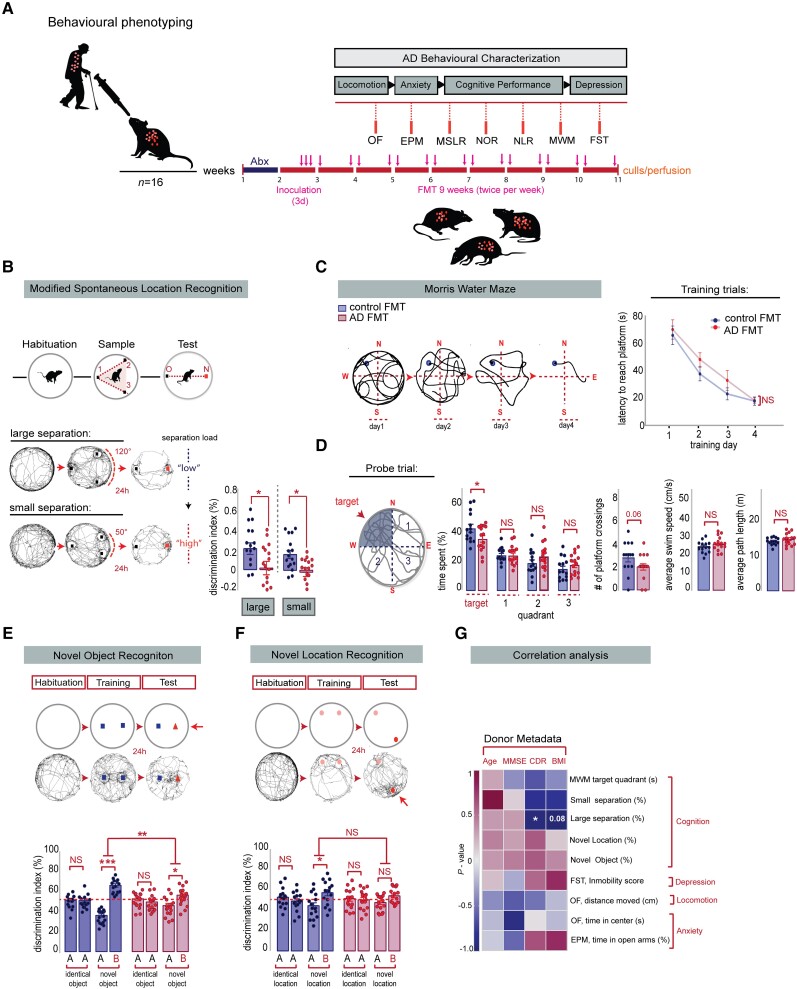
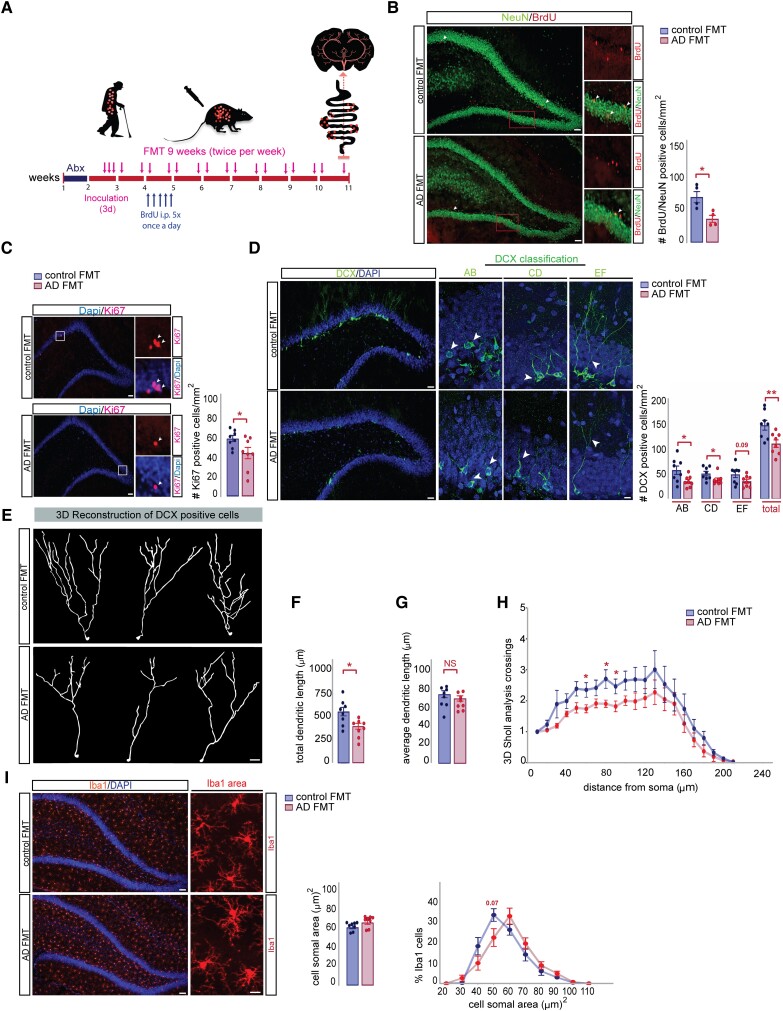
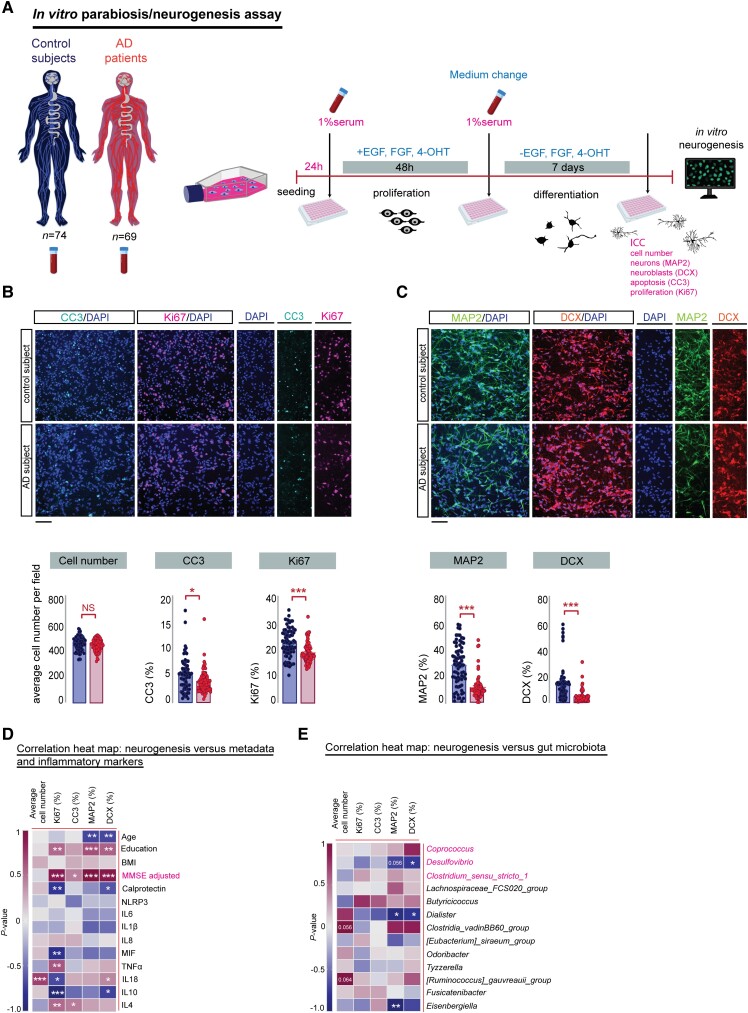
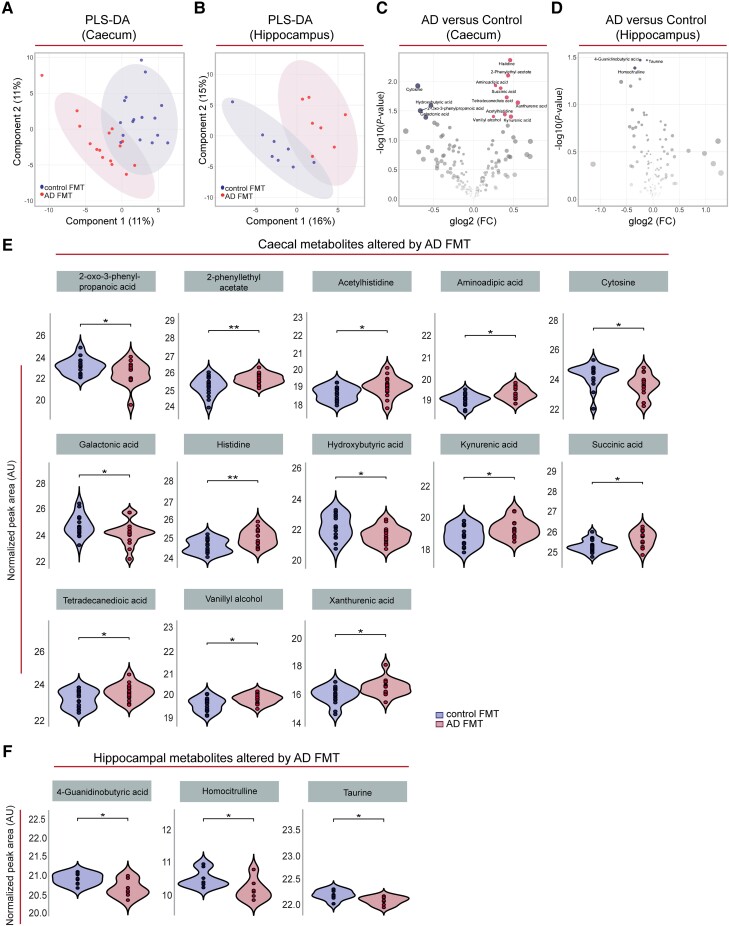
Alzheimer's disease is a complex neurodegenerative disorder leading to a decline in cognitive function and mental health. Recent research has positioned the gut microbiota as an important susceptibility factor in Alzheimer's disease by showing specific alterations in the gut microbiome composition of Alzheimer's patients and in rodent models. However, it is unknown whether gut microbiota alterations are causal in the manifestation of Alzheimer's symptoms. To understand the involvement of Alzheimer's patient gut microbiota in host physiology and behaviour, we transplanted faecal microbiota from Alzheimer's patients and age-matched healthy controls into microbiota-depleted young adult rats. We found impairments in behaviours reliant on adult hippocampal neurogenesis, an essential process for certain memory functions and mood, resulting from Alzheimer's patient transplants. Notably, the severity of impairments correlated with clinical cognitive scores in donor patients. Discrete changes in the rat caecal and hippocampal metabolome were also evident. As hippocampal neurogenesis cannot be measured in living humans but is modulated by the circulatory systemic environment, we assessed the impact of the Alzheimer's systemic environment on proxy neurogenesis readouts. Serum from Alzheimer's patients decreased neurogenesis in human cells in vitro and were associated with cognitive scores and key microbial genera. Our findings reveal for the first time, that Alzheimer's symptoms can be transferred to a healthy young organism via the gut microbiota, confirming a causal role of gut microbiota in Alzheimer's disease, and highlight hippocampal neurogenesis as a converging central cellular process regulating systemic circulatory and gut-mediated factors in Alzheimer's.

Keywords: Alzheimer’s disease; adult hippocampal neurogenesis; faecal microbiota transplantation; memory.


Conflict of interest statement

Y.M.N. and O.F.O. have received funding from Marigot Limited. O.F.O. has received funding for unrelated research from Alkermes plc. J.F.C. has received research funding from Mead Johnson, Cremo, Nutricia, Pharmavite, Reckitt, and DuPont; and has served as a consultant for Nestle. This support neither influenced nor constrained the contents of this article. All other authors report no competing interests.

Figures

Figure 1
Figure 1
Associations between circulatory systemic factors, gut microbiota and cognitive status of Alzheimer’s disease patients. (A) There was increased expression of the cytokines IL-1β (*P = 0.018), NLRP3 (**P = 0.003), MIF (**P = 0.008), IL-10 (***P < 0.001) and decreased expression of IL-4 (**P = 0.006) in Alzheimer’s disease patients (n = 52) compared to control subjects (n = 68), unpaired, two-tailed Student’s t-test for continuous Gaussian variables (or Mann-Whitney test for non-Gaussian variables). (B) Faecal calprotectin was significantly increased in Alzheimer’s patients (n = 64) compared to control subjects (n = 69), Mann-Whitney test. *P = 0.022. (C) Gut microbiota composition at phylum level from control (n = 41) and Alzheimer’s patients (n = 54). Alzheimer’s patients had higher abundance of phyla Bacteroides, and lower abundance of phyla Firmicutes and Verrucomicrobiota. Relative abundance of genera that differed significantly between controls and Alzheimer’s patients after batch correction using percentile-normalization. Mann-Whitney tests, multiple testing corrections using the Benjamini–Hochberg method, and FDR ≤ 0.1 was considered significant (Coprococcus, P = 0.099; Clostridium in sensu stricto 1, P = 0.099; Desulfovibrio, P = 0.006). (D) Correlation between human gut microbiota, human donor metadata, faecal calprotectin and serum markers. Heat map shows Spearman rank coefficients, with red indicating strong positive correlation, and blue indicating strong negative correlation. P-values for significant correlations (α < 0.05) are noted (*P < 0.05, **P < 0.01, ***P < 0.001). Black horizontal lines in violin plots indicate medians. *P < 0.05, **P < 0.01, ***P < 0.001. NS = not significant; AD = Alzheimer’s disease.
Figure 2
Figure 2
Adult rats colonized with faecal material from Alzheimer’s patients harbour different bacterial genera and display alterations in intestinal epithelial structure. (A) Schematic representation of the experimental procedure: microbiota-depleted young adult rats were colonized with human faecal samples from cognitively healthy control or Alzheimer’s donors (n = 4). One faecal sample from each human donor was used to colonize four microbiota-depleted rats (n = 16). Faecal pellets were collected at Day 0 (pre), 10 days after human donor colonization (10d; T1) and at the end of the study (T2 = 59 days). Vertical bars represent weekly intervals. (B) Top: Principal coordinate analysis showing the effects of FMT on faecal microbiome in rats in terms of β-diversity as measured by Bray-Curtis distance. Ellipses indicate 95% confidence intervals per group. Linear mixed-effects model, significant Time × FMT interaction effect (*P = 0.047). Bottom: Violin plots displaying the effects of FMT on rats in terms of α-diversity. Black horizontal lines in violin plots indicate medians. The Pielou’s evenness and Shannon index decreased following FMT, regardless of donor group (ANOVA with repeated measures *P < 0.05, ***P < 0.001, ****P < 0.0001). (C) Left: Heat map showing genera differentially altered by FMT. Colour depicts effect size, with blue (negative) indicating higher abundances pre-treatment and red (positive) indicating higher abundances post-treatment, Wilcoxon signed-rank test followed by Benjamini–Hochberg correction as per the ALDEx2 library, *q < 0.1, **q < 0.01, ***q < 0.001. (D) Alzheimer’s-FMT rats (n = 16) display a significant increase in faecal water content compared to control FMT rats (n = 16), unpaired, two-tailed Student’s t-test, *P = 0.0309. (E) Left: Representative images of haematoxylin and eosin stained sections of the distal ileum from control and Alzheimer’s-FMT rats. Scale bars = 200 µm (left magnification), 100 µm (right magnification). Right: Alzheimer’s colonized rats show no significant change in ileal villus length, unpaired, two-tailed Student’s t-test, P = 0.7749 and crypt depth, unpaired, two-tailed Student’s t-test, P = 0.9060. (F) Left: Representative PAS/Alcian blue staining of ileal sections. Scale bars = 200 µm (left magnification), 100 µm (right magnification). Right: Alzheimer’s-FMT rats display significant goblet cell loss in the ileum, unpaired, two-tailed Student’s t-test, *P = 0.0426. (G) Average colon length was significantly reduced in Alzheimer’s-FMT rats compared to control FMT rats, two-tailed Student’s t-test, *P = 0.0500. (H) Left: Representative images of haematoxylin and eosin stained sections of the proximal colon from control and Alzheimer’s-FMT rats. Scale bars = 200 µm (left magnification), 100 µm (right magnification). Right: Alzheimer’s-FMT rats displayed a significant increase in colonic crypt depth, two-tailed Student’s t-test, *P = 0.0356. (I) Left: Representative PAS/Alcian blue staining of colon sections. Right: Alzheimer’s-FMT rats display a significant goblet cell loss in the proximal colon, unpaired, two-tailed Student’s t-test, *P = 0.0403. Unless otherwise indicated, data are presented as mean ± SEM, *P < 0.05, **P < 0.01, ***P < 0.001, **** P < 0.0001. AD = Alzheimer’s disease; FMT= faecal microbiota transplantation; NS = not significant; PAS = periodic acid-Schiff.
Figure 3
Figure 3
Alzheimer’s-FMT induced cognitive deficits in hippocampal-neurogenesis dependent behaviours in young adult rats. (A) Overview of the Alzheimer’s-related behaviours. Vertical bars represent weekly intervals. Behaviours include: Open Field (OF), Elevated Plus Maze (EPM), Modified Spontaneous Location Recognition (MSLR), Novel Object Recognition (NOR), Novel Location Recognition (NLR), Morris Water Maze (MWM) and Forced Swim test (FST). (B) Top: Illustration of the MSLR task. Bottom: Alzheimer’s-FMT rats displayed a significant reduction in the discrimination index in the large separation task, two-tailed Student’s t-test, *P = 0.0353 and small separation task, Mann-Whitney U-test, *P = 0.0108. (C) Left: Representative tracings in platform trials in the MWM. Right: Escape latency during platform trials in MWM. No significant differences in learning were detected during the acquisition training days in the MWM test, two-way mixed ANOVA, effect of FMT: P = 0.2148, effect of time: ***P < 0.0001, FMT × Time interaction: P = 0.6672. (D) When challenged in the probe trial, Alzheimer’s-FMT rats spent significantly less time in the target quadrant, unpaired, two-tailed Student’s t-test, *P = 0.0498. Average number of platform crossings was reduced in Alzheimer’s-FMT rats compared to control FMT rats, Mann-Whitney test, P = 0.0670. Alzheimer’s-FMT colonized rats displayed no significant change in the locomotory parameters of the probe trial, as determined by average swim speed, unpaired, two-tailed Student’s t-test, P = 0.1582 and path length, unpaired, two-tailed Student’s t-test, P = 0.2246. (E) Top: Illustration of the NOR test. Bottom: In the training session, no significant difference was detected between the differentiation index of the two identical objects in the control FMT rats, two tailed paired Student’s t-test, P = 0.9859 and Alzheimer’s-FMT rats, P = 0.4149. In the test session, Alzheimer’s-FMT rats show a significant reduction in the discrimination index of the novel objects compared to control FMT rats, unpaired, two-tailed Student’s t-test, **P = 0.0019. (F) Top: Illustration of the NOL test. Bottom: In the training sessions, no significant difference was detected between the differentiation index of the two identical locations in the control FMT rats, two tailed paired Student’s t-test, P = 0.4244 and Alzheimer’s-FMT rats, P = 0.8267. In the test session, Alzheimer’s-FMT rats show no significant reduction in the discrimination index of the novel location compared to control FMT rats, unpaired, two-tailed Student’s t-test, P = 0.4032. (G) Spearman’s rank and Pearson correlation between rat behaviour and human donor metadata. Heat map showing Spearman p (rho) or Pearsons R correlation coefficients, with red indicating strong positive correlation, and blue indicating strong negative correlation. P-values for significant correlations (α<0.05) are noted. All data are presented as mean ± SEM, *P < 0.05, **P < 0.01, ***P < 0.001. AD = Alzheimer’s disease; BMI = body mass index; CDR = Clinical Dementia Rating; FMT= faecal microbiota transplantation; MMSE = Mini-Mental State Examination; NS = not significant.
Figure 4
Figure 4
Transplantation of gut microbiota from Alzheimer’s patients decreased neurogenesis and dendritogenesis of adult-born hippocampal neurons in rats. (A) Experimental timeline showing the effect of FMT on the survival of newborn neurons and microglia activation: rats were injected with BrdU (150 mg/kg) once per day for 5 days, 10 days post donor colonization and sacrificed 6 weeks later at Day 59. (B) Left: Representative images of BrdU/NeuN positive cells in DG of control and Alzheimer’s-FMT rats. Scale bars = 200 µm (left magnification), 50 µm (right magnification). Newborn neurons were analysed using double labelling for BrdU (red) and the neuronal marker NeuN (green). Arrowheads indicate double-positive cells (orange). Right: Alzheimer’s-FMT rats show a significant reduction in the number of BrdU/NeuN cells, two-tailed Student’s t-test, *P = 0.0159. (C) Left: Representative images of Ki67 positive cells in DG of control and Alzheimer’s-FMT rats. Scale bars = 200 µm (left magnification), 50 µm (right magnification). Right: A significant reduction in the number of Ki67 positive cells in rats after FMT from Alzheimer’s disease, two-tailed Student’s t-test, *P = 0.0411. (D) Left: Representative images of AB, CD and EF types of DCX-positive cells classified based on their dendritic tree morphology. Scale bars = 200 µm (left magnification), 40 µm (right magnification). Right: Alzheimer’s-FMT rats show a significant reduction in the number of AB type, two-tailed Student’s t-test, *P = 0.0290; CD type, Mann-Whitney test, *P = 0.0281 and total number of DCX-positive cells in the DG, two-tailed Student’s t-test, **P = 0.0099. (E) Representative 3D reconstructions of DCX-positive cells from the DG of young adult rats after control and Alzheimer’s-FMT. Scale bar = 20 μm. (F) Morphological analysis revealed a significant decrease in the total dendritic length of DCX-positive cells in Alzheimer’s-FMT treated rats, two-tailed Student’s t-test, *P = 0.0124 (G) The average dendritic length of DCX-positive cells was unaltered between control and Alzheimer’s-FMT rats, two-tailed Student’s t-test, P = 0.3533. (H) Sholl analysis revealed a reduction in dendritic complexity of DCX-positive cells in Alzheimer’s-FMT rats compared to control FMT rats, two-way mixed ANOVA, effect of FMT: *P = 0.0452, effect of distance from soma: ***P < 0.0001, FMT × Distance interaction: P = 0.9358. (I) Left: Representative images of Iba1 positive cells in the DG of control and Alzheimer’s-FMT rats. Scale bars = 200 µm (left magnification), 40 µm (right magnification). Right: Quantification of cell soma area of Iba1-positive cells in the DG of control and Alzheimer’s-FMT rats, Mann-Whitney test, P = 0.1605. Distribution analysis of soma area shows a shift from small to larger cell body sizes in Alzheimer’s-FMT colonized rats in comparison to control FMT colonized rats. Two-way mixed ANOVA, effect of FMT: P = 0.3154, effect of soma area: ***P < 0.0001, FMT × Soma area interaction: *P = 0.0240. All data are presented as mean ± SEM, *P < 0.05, **P < 0.01. AD = Alzheimer’s disease; DG = dentate gyrus; FMT = faecal microbiota transplantation; NS = not significant.
Figure 5
Figure 5
Serum from Alzheimer’s patients decreased neurogenesis in human hippocampal progenitor cells. (A) Experimental timeline of the in vitro parabiosis/neurogenesis assay: human hippocampal progenitor cells (HPCs) were cultured with 1% human serum from age-matched cognitively healthy and Alzheimer’s patients. Cellular readouts are expressed as percentage relative to neural cell number. Fifteen fields were analysed per well, n = 3 biological replicates. (B) Top: Representative confocal micrographs showing CC3-positive HPCs cells (green: CC3-positive cells, blue: DAPI) and Ki67-positive HPCs cells (red: DCX-positive cells, blue: DAPI) during the differentiation phase of the assay. Scale bar = 100 μm. Bottom: No significant change was detected in the average number of HPCs per field between control and Alzheimer’s patients during the differentiation phase of the human serum assay, unpaired, two-tailed Student’s t-test, P = 0.1855. Staining for the apoptotic marker CC3 revealed a significant decrease in cell death in HPCs cells receiving serum from Alzheimer’s patients compared to controls, Mann-Whitney test, *P = 0.0100. Serum from Alzheimer’s patients induced a significant reduction in the expression level of the proliferation cell marker Ki67, Mann-Whitney test, ***P < 0.0001. (C) Top: Immunofluorescence staining of MAP2-positive HPCs cells (green: MAP2-positive cells, blue: DAPI) and DCX-positive HPCs cells (red: DCX-positive cells, blue: DAPI) during the differentiation phase of the assay. Scale bar = 100 μm. Bottom: Serum from Alzheimer’s patients caused a significant reduction in the expression levels of neurons (MAP2), Mann-Whitney test, ***P < 0.0001 and neuroblasts (DCX), Mann-Whitney test, ***P < 0.0001. (D) Spearman’s rank correlation between in vitro cellular neurogenesis readouts, human donor metadata and serum inflammatory markers. Correlation heat maps showing Spearman’s rank coefficients, with red indicating strong positive correlation and blue indicating strong negative correlation. (E) Spearman correlation between in vitro cellular neurogenesis readouts and human donor gut microbiota. P-values for significant correlations (α < 0.05) are noted. Control serum n = 74, Alzheimer’s serum n = 69. All data are presented as mean ± SEM. Panel (A) was created with BioRender.com. *P < 0.05, **P < 0.01, ***P < 0.001. AD = Alzheimer’s disease; ICC = immunocytochemistry.
Figure 6
Figure 6
FMT from Alzheimer’s patients induced alterations in the caecal and hippocampal metabolomes of young adult rats. (A and B) Partial least squares discriminant analysis (PLS-DA) plot depicting the effect of control and Alzheimer’s-FMT on the caecal content (A) and hippocampal (B) metabolomes of young adult rats (with 95% concentration ellipses). Both models were non-significant (pQ2 > 0.05) by n = 1000 permutation tests. (C and D) Volcano plots of metabolites quantified in caecal content (n = 184 features) (C) and hippocampal tissue (n = 123 features) (D) of rats colonized with control and Alzheimer’s-FMT. Red dots represent metabolites nominally (P < 0.05) upregulated in Alzheimer’s-FMT rats, and blue dots represent metabolites nominally (P < 0.05) upregulated in control FMT rats. (E and F) Violin and box-and-whisker plot (median represented by horizontal line) of normalized peak area of the caecal (n = 15–16) and hippocampal (n = 7–8) metabolites differentially regulated between rats receiving human FMT from control subjects and Alzheimer’s patients, as depicted in C and D. *P < 0.05, **P < 0.01 (unadjusted P-values from moderated t-tests, Limma). Histidine, P = 0.0043; 2-phenylethyl acetate, P = 0.0079; aminoadipic acid, P = 0.012; cytosine, P = 0.012; succinic acid, P = 0.013; tetradecanedioic acid, P = 0.019; xanthurenic acid, P = 0.023; hydroxybutyric acid, P = 0.026; 2-oxo-3-phenylpropanoic acid, P = 0.031; acetylhistidine, P = 0.036; vanillyl alcohol, P = 0.039; kynurenic acid, P = 0.040; galactonic acid, P = 0.041. 4-guanidinobutyric acid, P = 0.034; taurine, P = 0.034; homocitrulline, P = 0.041. AD = Alzheimer’s disease; FC = fold change; FMT = faecal microbiota transplantation; glog2 = generalized logarithm base 2.

Comment in

References

    1. Blennow K, de Leon MJ, Zetterberg H. Alzheimer’s disease. Lancet. 2006;368:387–403. - PubMed
    1. Gaugler J, James B, Johnson T, Scholz K, Weuve J. 2016 Alzheimer’s disease facts and figures. Alzheimers Dement. 2016;12:459–509.
    1. Lyketsos CG, Carrillo MC, Ryan JM, et al. Neuropsychiatric symptoms in Alzheimer’s disease. Alzheimers Dement J Alzheimers Assoc. 2011;7:532–539. - PMC - PubMed
    1. Heneka MT, Carson MJ, Khoury JE, et al. Neuroinflammation in Alzheimer’s disease. Lancet Neurol. 2015;14:388–405. - PMC - PubMed
    1. Iqbal K, del Alonso AC, Chen S, et al. Tau pathology in Alzheimer disease and other tauopathies. Biochim Biophys Acta. 2005;1739:198–210. - PubMed

Publication types