Effects of reducing free sugars on 24-hour glucose profiles and glycemic variability in subjects without diabetes
- PMID: 37850088
- PMCID: PMC10577299
- DOI: 10.3389/fnut.2023.1213661
Effects of reducing free sugars on 24-hour glucose profiles and glycemic variability in subjects without diabetes
Abstract
Background: The Western diet, especially beverages and high processed food products, is high in sugars which are associated with the development of obesity and diabetes. The reduction of refined carbohydrates including free and added sugars improves glycemic control in individuals with diabetes, but the data regarding effects in subjects without diabetes are limited.
Objective: This study aimed to evaluate the effects of reducing free sugar intake on 24-h glucose profiles and glycemic variability using continuous glucose monitoring (CGM).
Methods: In the randomized controlled study, 21 normal weight and overweight/obese subjects (BMI 18-40 kg/m2) without diabetes were assigned to a 4-week reduced-sugar (RS) diet or control diet after a 2-week baseline phase. During the baseline phase, all participants were advised not to change their habitual diet. During the intervention phase, RS participants were asked to avoid added sugar and white flour products, whereas participants of the control group were requested to proceed their habitual diet. Anthropometric parameters and HbA1c were assessed before and at the end of the intervention phase. Interstitial glucose was measured using continuous glucose monitoring (CGM), and the food intake was documented by dietary records for 14 consecutive days during the baseline phase and for the first 14 consecutive days during the intervention phase. Mean 24-h glucose as well as intra- and inter-day indices of glucose variability, i.e., standard deviation (SD) around the sensor glucose level, coefficient of variation in percent (CV), mean amplitude of glucose excursions (MAGE), continuous overlapping net glycemic action (CONGA), and mean absolute glucose (MAG), were calculated for the baseline and intervention phases.
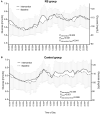
Results: During the intervention, the RS group decreased the daily intake of sugar (i.e., -22.4 ± 20.2 g, -3.28 ± 3.61 EN %), total carbohydrates (-6.22 ± 6.92 EN %), and total energy intake (-216 ± 108 kcal) and increased the protein intake (+2.51 ± 1.56 EN %) compared to the baseline values, whereby this intervention-induced dietary changes differed from the control group. The RS group slightly reduced body weight (-1.58 ± 1.33 kg), BMI, total fat, and visceral fat content and increased muscle mass compared to the baseline phase, but these intervention-induced changes showed no differences in comparison with the control group. The RS diet affected neither the 24-h mean glucose levels nor intra- and inter-day indices of glucose variability, HbA1c, or diurnal glucose pattern in the within- and between-group comparisons.
Conclusion: The dietary reduction of free sugars decreases body weight and body fat which may be associated with reduced total energy intake but does not affect the daily mean glucose and glycemic variability in individuals without diabetes.
Clinical trial registration: German Clinical Trials Register (DRKS); identifier: DRKS00026699.
Keywords: continuous glucose monitoring; free sugar reduction; glucose metabolism; glycemic variability; obesity.
Copyright © 2023 Pappe, Peters, Dommisch, Woelber and Pivovarova-Ramich.
Conflict of interest statement
The authors declare that the research was conducted in the absence of any commercial or financial relationships that could be construed as a potential conflict of interest.
Figures


References
LinkOut - more resources
Full Text Sources
Research Materials

