. 2023 Nov 7;148(19):1459-1478.
doi: 10.1161/CIRCULATIONAHA.123.064794. Epub 2023 Oct 18.

Cellular Heterogeneity of Activated Primary Human Macrophages and Associated Drug-Gene Networks: From Biology to Precision Therapeutics

Affiliations

Cellular Heterogeneity of Activated Primary Human Macrophages and Associated Drug-Gene Networks: From Biology to Precision Therapeutics

Julius L Decano et al. Circulation. .

Abstract

Background: Interferon-γ (IFNγ) signaling plays a complex role in atherogenesis. IFNγ stimulation of macrophages permits in vitro exploration of proinflammatory mechanisms and the development of novel immune therapies. We hypothesized that the study of macrophage subpopulations could lead to anti-inflammatory interventions.

Methods: Primary human macrophages activated by IFNγ (M(IFNγ)) underwent analyses by single-cell RNA sequencing, time-course cell-cluster proteomics, metabolite consumption, immunoassays, and functional tests (phagocytic, efferocytotic, and chemotactic). RNA-sequencing data were analyzed in LINCS (Library of Integrated Network-Based Cellular Signatures) to identify compounds targeting M(IFNγ) subpopulations. The effect of compound BI-2536 was tested in human macrophages in vitro and in a murine model of atherosclerosis.

Results: Single-cell RNA sequencing identified 2 major clusters in M(IFNγ): inflammatory (M(IFNγ)i) and phagocytic (M(IFNγ)p). M(IFNγ)i had elevated expression of inflammatory chemokines and higher amino acid consumption compared with M(IFNγ)p. M(IFNγ)p were more phagocytotic and chemotactic with higher Krebs cycle activity and less glycolysis than M(IFNγ)i. Human carotid atherosclerotic plaques contained 2 such macrophage clusters. Bioinformatic LINCS analysis using our RNA-sequencing data identified BI-2536 as a potential compound to decrease the M(IFNγ)i subpopulation. BI-2536 in vitro decreased inflammatory chemokine expression and secretion in M(IFNγ) by shrinking the M(IFNγ)i subpopulation while expanding the M(IFNγ)p subpopulation. BI-2536 in vivo shifted the phenotype of macrophages, modulated inflammation, and decreased atherosclerosis and calcification.

Conclusions: We characterized 2 clusters of macrophages in atherosclerosis and combined our cellular data with a cell-signature drug library to identify a novel compound that targets a subset of macrophages in atherosclerosis. Our approach is a precision medicine strategy to identify new drugs that target atherosclerosis and other inflammatory diseases.

Keywords: atherosclerosis; inflammation; macrophages; multiomics; phagocytosis; systems biology.


Conflict of interest statement

Disclosures Drs Yanagihara and Asano are employees of Kowa and were visiting scientists at Brigham and Women’s Hospital when the study was conducted. Kowa was not involved in the study design, data acquisition or analysis, or preparation of the manuscript.

Figures

Figure 1.
Figure 1.
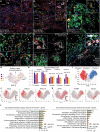
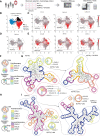
Heterogeneity of human primary macrophages. A, Immunohistochemistry on human atherosclerotic plaque with abundant CD68+ (red) macrophages showing some that are CCL2+ (green) and others that are CXCL9+ (white). DAPI-stained nuclei are in blue. B, Another donor plaque showing similar heterogeneous staining. Scale bar, 200 μm. C, Another donor plaque with CD68+ (green) macrophages showing colocalization of CD68+ TNF-α (tumor necrosis factor α)+ (orange) staining. Scale bar, 50 μm. D, Other plaque regions (representative) with LipidSpot 550+ staining of lipid droplets phagocytosed by CD68+ (green) macrophages. Scale bar, 50 μm. E, Other donor plaques show CD68+ (green) macrophages phagocytosing LipidSpot-stained bodies (red) and some microcalcification debris (Osteosense 680 [OS], white). F, Similar staining was seen in another donor plaque. Scale bar, 200 μm. G, T-distributed stochastic neighbor embedding (tSNE) plot of batch-corrected single-cell RNA-sequencing data from 4 donors; macrophages activated by interferon-γ (M(IFNγ)) stimulated for 12 hours (~1000 cells/donor). H, Adjusted Rand Index assessment of single-cell consensus clustering using 6 iterations using k = 2, 3, 4, 5, and 6 showing that k = 3 or 3 clusters division is most stable on average and consistent with donors. I, Single-cell consensus clustering at k-means = 3, 3 clusters. J, CCL2 (C-C motif chemokine ligand 2), CXCL9 (C-X-C motif chemokine ligand 9), and CXCL10 high expression mostly in cluster 2. K, CHIT1 (chitinase 1), IGF2R (insulin-like growth factor 2 receptor), and CCL22 high expression mostly in cluster 1. L, Top 10 enriched process networks for cluster 1 genes and cluster 2 genes. ECM indicates extracellular matrix; and FDR, false discovery rate.
Figure 2.
Figure 2.
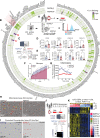
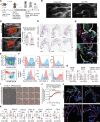
Surface protein profiling, functional profiling, and proteomics of M(IFNγ) clusters 1 and 2. A, Macrophages activated by interferon-γ (M(IFNγ)) from 3 donors are fluorescence-activated cell sorted (FACS) using the surface markers IGF2R (insulin-like growth factor 2 receptor; cluster 1) and HLA-DR (human leukocyte antigen–DR; cluster 2) queried against 242 panel markers (BD Lyoplate Human). The IGF2R+HLA-DR population represents cluster 1 or phagocytotic (M(IFNγ)p) cells; the IGF2RHLA-DR+ population represents cluster 2 or inflammatory (M(IFNγ)i) cells. Each population is queried against each of the 242 CD(n) at the AF647 channel. Isotype controls were used for thresholding (see histogram). B, Circular heatmap of CD(n) percentage positive staining (median normalized) for M(IFNγ)p and M(IFNγ)i populations. C, M(IFNγ) cells FACS for IGF2R and HLA-DR markers and tested for downstream assays. D, Quantitative polymerase chain reaction of proinflammatory genes CCL2, CXCL9, CXCL10, and CXCL11 (n = 6 donors with technical duplicates). *P<0.05, **P<0.01, ***P<<0.001. E, Quantitative polymerase chain reaction of non-proinflammatory (atheroprotective) genes CCL22, CHI3L1, APOE, and CHIT1 (n = 6 donors with technical duplicates). F, Efferocytosis assay comparing IGF2R+HLA-DR and IGF2RHLA-DR+ sorted cells in M(IFNγ). G, Chemotaxis assay (Incucyte modified Boyden chamber) with C5a as chemoattractant (n = 4 samples). Measurement of transmigrated (chemotaxis) cells is by phase-contrast focus differential and time series automated detection (Incucyte software) of cells in the lower and upper chambers. H, Apoptotic THP-1 cells prelabeled with pHrodo red increase fluorescence when phagocytosed by macrophages and fuse with the lysosome, whereas non-phagocytosed THP-1 cells exhibit a weaker fluorescence signal. Increased pHrodo red fluorescence: efferocytosis (yellow arrowheads); pHrodo red–labeled apoptotic THP-1 cells (white arrowheads; n = 4 samples). I, Representative images focused on the underside of the membrane barrier from the lower chamber side of M(IFNγ)p cells and M(IFNγ)i cells. Cells exiting pores are in focus under the barrier (blue arrowheads). Out-of-focus cells appear above the barrier (red arrowheads). J, Schema of time course proteomics for FACS M(IFNγ) clusters. K, Two-group comparison of M(IFNγ)i and M(IFNγ)p proteome represented as z score normalized heatmap. Unpaired nonparametric Mann-Whitney t test. DEP indicates differentially enriched protein; FDR, false discovery rate; and LC/MS/MS, liquid chromatography with tandem mass spectrometry.
Figure 3.
Figure 3.
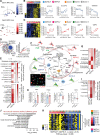
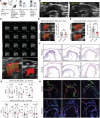
Kinetic proteometabolic profiling of M(IFNγ)i and M(IFNγ)p. A, Principal component analysis (PCA) of sample time points of phagocytotic macrophages activated by interferon-γ (M(IFNγ)p)–predominant set A (blues) and inflammatory macrophages activated by interferon-γ (M(IFNγ)i)–predominant set B (reds) using the proteins from Figure 2K filtered through rank regression (RR) where r≠0 on the basis of time of IFNγ exposure. The color legends for macrophage population, donor, and hour are used for the entire Figure 2K. B, Heatmap of RRtime-derived M(IFNγ)p-predominant proteins where r≠0 (false discovery rate–Benjamini Hochberg correction [FDR-BH] <0.2). In the RR analysis, RRtime-derived M(IFNγ)p-predominant proteins where r>0, FDR-BH<0.1 (increasing in time) are represented by LPCAT3 (lysophosphatidylcholine acyltransferase 3) and SLC27A3 (solute carrier family 27 member 3). M(IFNγ)p-predominant proteins that are decreasing in time (RRtime, r<0, FDR-BH<0.1) are represented by TGM2 (transglutaminase 2) and TOMM40 (translocase of outer mitochondrial membrane 40). C, M(IFNγ)i-predominant proteins heatmap after RRtime filtering where r>0, FDR-BH<0.1 (increasing in time). This list includes inflammation-related proteins represented by P2RX7 (purinergic receptor P2X 7), MX1 (MX dynamin-like GTPase 1), GBP1 (guanylate-binding protein 1), and GBP2 (guanylate-binding protein 2). D, OmniLog assay: Substrates are consumed together with intracellular NAD(P)H and FADH2, and a purple redox dye product is formed as a reporter molecule. Colorimetric measurements of dye accumulation are measured every 15 minutes (q15) for 8 hours where optical density measurements against time are used to derive the maximum slope or metabolic reaction rate for each substrate ~ Vmax. E, G, I, Normalized Vmax measurements for M(IFNγ)i and M(IFNγ)p populations from pooled donor macrophages (n=3) group into metabolic consumption patterns for tricarboxylic acid (TCA) cycle and fatty acid oxidation (FAO; E), glucose consumption (G), and amino acid and pyruvate consumption (aa turnover and pyruvate metabolism; I). F, Summary of TCA cycle in the mitochondria for the 2 clusters with immunocytochemistry showing heterogeneity of M(IFNγ) in vitro before fluorescence-activated cell sorting and metabolic consumption assay. H, A comparison between M(IFNγ)i and M(IFNγ)p for enzymes quantified in global proteomics representing glucose consumption (PFKL [phosphofructokinase] and PGM2 [phosphoglucomutase 2]) and TCA-related succinate consumption (SDHB [succinate dehydrogenase complex iron-sulfur subunit B] and SDHA [succinate dehydrogenase complex flavoprotein subunit A]). *P<0.05, **P<0.01, ***P<0.001, ****P<0.0001. J, Gene ontology (GO) molecular functions enrichment of M(IFNγ)i-predominant genes (single-cell RNA sequencing–derived). K, A 2-group comparison between M(IFNγ)i and M(IFNγ)p (time points, 2 to 10 hours IFNγ stimulation) shows ribosomal proteins are enriched in M(IFNγ)i samples (n=3 donors for each condition). OD indicates optical density.
Figure 4.
Figure 4.
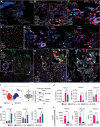
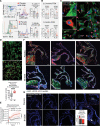
M(IFNγ)i and M(IFNγ)p in human atherosclerotic plaques: pharmacogenomic and translational implications. A, Atherosclerotic plaque at low magnification (500-μm scale) showing intraplaque vessels (i.v.) marked by αSMA from smooth muscle cells. B, Inset corresponds to the yellow region in A, but at higher magnification (200-μm scale), with inflammatory macrophages activated by interferon-γ (M(IFNγ)i) and phagocytotic macrophages activated by interferon-γ (M(IFNγ)p) antibody markers HLA-DR (human leukocyte antigen–DR) and IGF2R (insulin-like growth factor 2 receptor), respectively. Yellow signals may be lipid artifacts taking up both antibodies (green and red). C, Inset corresponds to the orange region in B, but at higher magnification (50-μm scale), showing distinct signals for HLA-DR and IGF2R and not overlapping with αSMA. D, In vitro modeled M(IFNγ) showing distinct signals for HLA-DR and IGF2R. E, Individual channels from C showing αSMA, IGF2R, and HLA-DR (50-μm scale). F, Similar staining patterns in another plaque. Vessels (i.v.) are identified by the surrounding smooth muscle cells (αSMA; 200-μm scale). G, Region of interest (ROI) at higher magnification (200-μm scale). H, The same region in the adjacent tissue section shows matching locations of the CD68+ macrophages and areas of smooth muscle cells (smc, 200-μm scale). I, Differentially expressed genes used in L1000 to produce drug candidates such as BI-2536 that mimic M(IFNγ)p while neutralizing M(IFNγ)i gene expression. J, Bulk quantitative polymerase chain reaction of CCL2, CXCL9, and CXCL10. *P<0.05, **P<0.01, ***P<0.001, ****P<0.0001. K, Bulk quantitative polymerase chain reaction of CCL22, CHI3L1, and MMP9. L, ELISA to measure secretion of CXCL9, CXCL10, and CXCL11.
Figure 5.
Figure 5.
L1000-derived drug perturbation causing a phenotypic shift of single-cell heterogeneity in M(IFNγ). A, Schematic workflow for targeted single-cell RNA sequencing profiling of proinflammatory macrophages with subsequent perturbation of L1000-derived small molecule compound BI-2536. B, UMAP projection of M(−), macrophages activated by interferon-γ (M(IFNγ)), and M(IFNγ)+BI-2536 cells (n=4 donors). Vehicle, PBS. C, D, Gene expression of proinflammatory chemokines CCL2, CXCL9, CXCL10, and CXCL11. Gates show the decrease in gene expression of inflammatory cells (M(IFNγ)i; and cells expressing) from M(IFNγ) to M(IFNγ)+BI-2536 condition. E, Gene expression of atheroprotective phagocytotic (M(IFNγ)p) genes CCL22, APOE, and CHI3L1. Gates show an increase in gene expression and cells expressing from M(IFNγ) to M(IFNγ)+BI-2536 condition. F, FlowSOM single-cell data visualization showing BI-2536 can shrink the M(IFNγ)i population and expand the M(IFNγ)p population: legend for metaclusters in the panel. Each metacluster is composed of cells with very similar expressions for the given genes analyzed (pie chart). Wedge sizes are proportional to the amount of gene expression. G, FlowSOM tree using CCL2, CXCL9, CXCL10, CHI3L1, CCL22, and IL1RN shows transition to an increased prevalence of an M(IFNγ)p metacluster (blue hashed outline) and a decreased prevalence of the M(IFNγ)i metacluster (red hashed outline) when cells are treated with IFNγ and BI-2536. Transition branches can be followed by hashed metaclusters from one state to the other. H, Legend for metaclusters in panel I. FlowSOM tree using the different panels of proinflammatory and non-proinflammatory genes GBP1, CCL2, CXCL11, CXCL9, CHI3L1, CCL22, and APOE (n=4 donors, pooled). scRNAseq indicates single-cell RNA sequencing.
Figure 6.
Figure 6.
Effect of IFNγ neutralization on atherosclerosis and macrophage heterogeneity. A, Schematic workflow for the in vivo study of interferon-γ (IFNγ) neutralization on an accelerated atherosclerosis model. B, Representative B-mode images of the aortic arch (ascending and transverse segments) between the 2 groups. C, Three-dimensional wall volume (ascending aorta; P=0.0002). *P<0.05, **P<0.01, ***P<0.001, ****P<0.0001. D, Hematoxylin & eosin histology. E, Flow cytometry of macrophages from peritoneal lavage; representative plot for markers IGF2R (insulin-like growth factor 2 receptor) and CD74, showing that IGF2R+CD74 macrophages (blue) and IGF2RCD74+ macrophages (red) have consistent expression patterns for the aforementioned markers (F) of phagocytic M(IFNγ)p-like cells CD11c, CD49e, and CD36 and markers of proinflammatory signaling CCR5 (CCL2 receptor), MHC II (major histocompatibility complex II; similar to HLA-DR [human leukocyte antigen–DR] in humans), and Ly6C high expression. G, Flow cytometry–derived proportion of IGF2R+CD74, IGF2RCD74+ macrophages among F4/80+CD68+ cells, and Mertk+ cells among the IGF2R+CD74 subpopulation. H, Representative images of macrophage heterogeneity in the atherosclerotic plaque isotype and anti-IFNγ group show no difference. I, Efferocytosis assay using apoptotic Jurkat cells (representative images of time lapse monitoring from 0 to 6.5 hours using the Incucyte S3) for peritoneal macrophages shows no difference between the groups (J). K, ELISA of plasma samples. L, Representative images of immunohistologic staining for CD68 and αSMA on aortic arches from the 2 groups. Scale bar, 500 μm. αIFNγ indicates anti–interferon-γ antibody treatment; αSMA, α–smooth muscle actin; IgG, immunoglobulin G; Iso, isotype immunoglobulin G control treatment; and USG, ultrasonography.
Figure 7.
Figure 7.
Effect of BI-2536 on atherosclerotic burden and inflammation. A, Schematic workflow for the in vivo study of BI-2536 on an accelerated atherosclerosis model. B, Body weight progression in the placebo and BI-2536 groups. Representative B-mode images of the aortic arch (ascending and transverse segments) between the 2 groups. C, Lower left panel shows how 3-dimensional volume render was derived from successive inner and outer wall tracings of consecutive 2-dimensional short-axis slices at ~0.05-mm intervals (upper panel, array). Lower right panel shows stacked slice measurement disks (red). D and E, Three-dimensional wall volume (ascending aorta [Ao]): early (D; P=0.7890) and late (E; P=0.0001). F, Hematoxylin & eosin histology, representative images. Scale bar, 1 mm. G, ELISA of plasma samples from early and late subsets of animals. *P<0.05, **P<0.01, ***P<0.001, ****P<0.0001. H, Immunofluorescent histology of aortic arches from the 3-month time point, placebo versus BI-2536, representative images, showing plaque burden. Scale bar, 500 μm. BI indicates BI-2536; IL, interleukin; PL, placebo; and USG, ultrasonography.
Figure 8.
Figure 8.
Effect of BI-2536 on macrophage heterogeneity, function, and plaque composition. A, Flow cytometry of peritoneal monocytes and macrophages; representative plot for Ly6G/Ly6C high (Ly6C++) CD14+F4/80 monocytes in BI-2536 (BI-2536; blue) and placebo (PL; red) groups. Mertk+ among IGF2R+CD74 fraction (green histogram) of F4/80+ macrophages is shown. *P<0.05, **P<0.01, ***P<0.001, ****P<0.0001. B, Flow cytometry (FCM) of IGF2R+CD74 and IGF2RCD74+ peritoneal macrophages from placebo and BI-2536 groups in the early (after 1 week of treatment, 2.2 months high-fat diet feeding) and late (after 4 weeks of treatment, 3.0 months high-fat diet feeding) groups. C, Escherichia coli phagocytosis assay (scale bar, 50 μm) in the (D) early subset, 5 technical replicates per biological replicate, 5 biological replicates per treatment group, with representative images shown. Scale bar, 50 μm. E, Efferocytosis assay using apoptotic Jurkat cells for peritoneal macrophages, P<0.0001. F, Immunofluorescent histology of aortic arches from the 3-month time point, placebo versus BI-2536, representative images; IGF2R (insulin-like growth factor 2 receptor), phagocytotic macrophages activated by interferon-γ (M(IFNγ)p) marker; CD74, inflammatory macrophages activated by interferon-γ (M(IFNγ)i) marker; αSMA, vascular smooth muscle cell marker, showing macrophage heterogeneity in the plaque. Inset shows the magnified region. Scale bar, 500 μm. G, Calcification staining with representative images from the placebo and BI-2536 groups (microcalcification and macrocalcification, using IVISense Osteo 680.

References

    1. Decano JL, Aikawa M. Dynamic macrophages: understanding mechanisms of activation as guide to therapy for atherosclerotic vascular disease. Front Cardiovasc Med. 2018;5:97. doi: 10.3389/fcvm.2018.00097 - PMC - PubMed
    1. Moore KJ, Sheedy FJ, Fisher EA. Macrophages in atherosclerosis: a dynamic balance. Nat Rev Immunol. 2013;13:709–721. doi: 10.1038/nri3520 - PMC - PubMed
    1. Decano JL, Singh SA, Gasparotto Bueno C, Ho Lee L, Halu A, Chelvanambi S, Matamalas JT, Zhang H, Mlynarchik AK, Qiao J, et al. . Systems approach to discovery of therapeutic targets for vein graft disease: PPARα pivotally regulates metabolism, activation, and heterogeneity of macrophages and lesion development. Circulation. 2021;143:2454–2470. doi: 10.1161/circulationaha.119.043724 - PMC - PubMed
    1. Nakano T, Katsuki S, Chen M, Decano JL, Halu A, Lee LH, Pestana DVS, Kum AST, Kuromoto RK, Golden WS, et al. . Uremic toxin indoxyl sulfate promotes proinflammatory macrophage activation via the interplay of OATP2B1 and Dll4-Notch signaling. Circulation. 2019;139:78–96. doi: 10.1161/circulationaha.118.034588 - PMC - PubMed
    1. Ridker PM, Everett BM, Thuren T, MacFadyen JG, Chang WH, Ballantyne C, Fonseca F, Nicolau J, Koenig W, Anker SD, et al. . Antiinflammatory therapy with canakinumab for atherosclerotic disease. N Engl J Med. 2017;377:1119–1131. doi: 10.1056/nejmoa1707914 - PubMed

Publication types