. 2023 Nov 15;12(11):bio059968.
doi: 10.1242/bio.059968. Epub 2023 Nov 29.

Mitochondrial metabolism in Drosophila macrophage-like cells regulates body growth via modulation of cytokine and insulin signaling

Affiliations

Mitochondrial metabolism in Drosophila macrophage-like cells regulates body growth via modulation of cytokine and insulin signaling

Shrivani Sriskanthadevan-Pirahas et al. Biol Open. .

Abstract

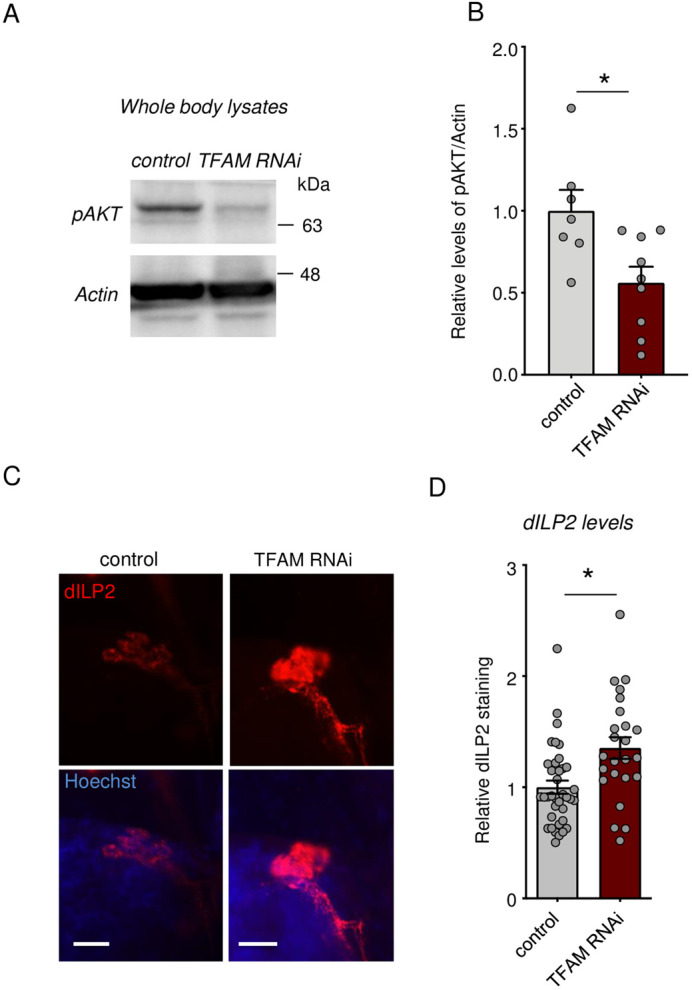
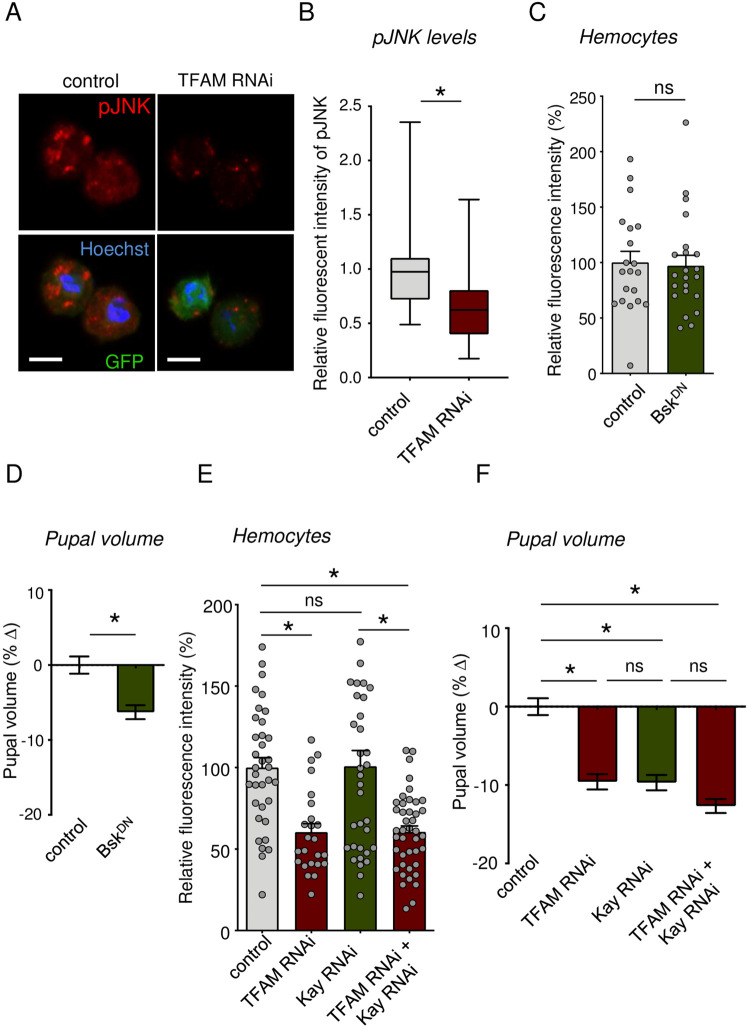
Macrophages play critical roles in regulating and maintaining tissue and whole-body metabolism in normal and disease states. While the cell-cell signaling pathways that underlie these functions are becoming clear, less is known about how alterations in macrophage metabolism influence their roles as regulators of systemic physiology. Here, we investigate this by examining Drosophila macrophage-like cells called hemocytes. We used knockdown of TFAM, a mitochondrial genome transcription factor, to reduce mitochondrial OxPhos activity specifically in larval hemocytes. We find that this reduction in hemocyte OxPhos leads to a decrease in larval growth and body size. These effects are associated with a suppression of systemic insulin, the main endocrine stimulator of body growth. We also find that TFAM knockdown leads to decreased hemocyte JNK signaling and decreased expression of the TNF alpha homolog, Eiger in hemocytes. Furthermore, we show that genetic knockdown of hemocyte JNK signaling or Eiger expression mimics the effects of TFAM knockdown and leads to a non-autonomous suppression of body size without altering hemocyte numbers. Our data suggest that modulation of hemocyte mitochondrial metabolism can determine their non-autonomous effects on organismal growth by altering cytokine and systemic insulin signaling. Given that nutrient availability can control mitochondrial metabolism, our findings may explain how macrophages function as nutrient-responsive regulators of tissue and whole-body physiology and homeostasis.

Keywords: Drosophila; Cytokine TNF-α/Eiger; Hemocytes; Insulin signaling; JNK signaling; Metabolism; Mitochondria; OxPhos; Systemic growth; TFAM.


Conflict of interest statement

Competing interests The authors declare no competing or financial interests.

Figures

Fig. 1.
Fig. 1.
Low bioenergetic activity in hemocytes leads to reduced hemocyte proliferation. (A) Representative confocal micrographs of hemocyte mitochondria from control (hml>+) versus TFAM RNAi (hml>UAS-TFAM-RNAi) larvae at 96 h AEL stained with MitoTracker Red. Scale bars: 10 µm. (B) Quantification of MitoTracker Red staining intensity in A. Data are presented as box plots (25%, median and 75% values) with error bars indicating the minimum and maximum values (*P<0.05, unpaired t-test). Number (n) of samples: 21 (control) and 25 (TFAM-RNAi). (C) Representative images of hemocytes labeled with GFP from control (hml>UAS-GFP) versus TFAM RNAi (hml>UAS-GFP, UAS-TFAM-RNAi) larvae at wandering stage (∼144 h AEL). Scale bars: 100 µm. (D) Quantification of GFP fluorescent intensity in C. Data are represented as mean±s.e.m., with individual data points plotted as symbols (*P<0.05, unpaired t-test). n of samples: 21 (control) and 27 (TFAM-RNAi). See also Fig. S1A. (E) Quantification of relative fluorescent intensity of GFP-labelled hemocytes in control (hml >UAS-GFP) versus RafGOF (hml>UAS-GFP, UAS-RafGOF) and control (hml>UAS-GFP) versus RafGOF combined with TFAM-RNAi (hml>UAS-GFP, UAS TFAM-RNAi, UAS-RafGOF). Data are represented as mean±s.e.m., with individual data points plotted as symbols (*P<0.05 and ns, not significant, unpaired t-test). n of samples: 14 (control) versus 12 (RafGOF) and 26 (control) versus 21 (TFAM-RNAi+RafGOF).
Fig. 2.
Fig. 2.
Hemocyte TFAM knock down suppresses systemic growth and development. (A) Relative change in pupal volume was calculated based on the average value of control (hml>+) animals. Data are presented as mean±s.e.m. (*P<0.05, Mann–Whitney U-test) for controls and two different TFAM RNAi lines (hml>TFAM-RNAi). Number (n) of pupae: 183 (control) versus 195 (TFAM RNAi#1) and 199 (control) versus 179 (TFAM RNAi#2). See also Fig. S1B. (B) Time to pupation was measured in control (hml>+) larvae versus larvae expressing one of two different TFAM RNAi transgenes (hml>UAS- TFAM RNAi). Data are presented as mean time to pupation±s.e.m. (*P<0.05, Mann–Whitney U-test). n of pupae: 171 (control) versus 135 (TFAM RNAi#1) and 179 (control) versus 107 (TFAM RNAi#2). See also Fig. S1C.
Fig. 3.
Fig. 3.
Hemocyte TFAM knock suppresses systemic insulin signaling by inhibiting dILP2 secretion from brain IPCs. (A) Western blots of whole-body samples from control (hml>+) versus TFAM RNAi (hml>UAS-TFAM-RNAi) larvae at 96 h AEL analyzed using Phospho-Akt and actin antibodies. (B) Quantification of Western blots from A. Data are relative levels of phospho-Akt band intensity corrected for actin band intensity. Data are presented as box plots (25%, median and 75% values) with error bars indicating the minimum and maximum values [*P<0.05 unpaired t-test, n=7 (control) and 9 (TFAM RNAi) groups per condition with 20 larvae in each group]. (C) Representative images for brain IPCs stained with dILP2 in control (hml>+) versus TFAM RNAi (hml>UAS-TFAM-RNAi) larvae at 96 h AEL larvae. Scale bars: 20 µm. (D) Quantification of relative dILP2 fluorescent intensity in (C). Data are represented as mean±s.e.m., with individual data points plotted as symbols (*P<0.05, unpaired t-test). n of samples: 37 (control) and 24 (TFAM-RNAi).
Fig. 4.
Fig. 4.
Hemocyte specific knock down of JNK signaling suppresses systemic growth. (A) Representative images for hemocytes stained with phospho-JNK (pJNK) in control (hml>+) versus TFAM RNAi (hml>UAS-TFAM-RNAi) larvae at 96 h AEL larvae. The scale bars represent 5 µm. (B) Quantification of relative pJNK fluorescent intensity in hemocytes (A). Data are presented as box plots (25%, median and 75% values) with error bars indicating the minimum and maximum values (*P<0.05, unpaired t-test). n (# of hemocytes)=36 (control) and 36 (TFAM-RNAi). (C) Quantification of relative fluorescent intensity of GFP-labelled hemocytes in control (hml>+) versus BskDN (hml>BskDN). Data are represented as mean±s.e.m., with individual data points plotted as symbols (*P<0.05 and ns, not significant, unpaired t-test). Number (n) of samples: 20 (control) and 22 (BskDN). (D) Relative change in pupal volume was calculated based on the average value of control (hml>+) animals. Data are presented as mean±s.e.m. (*P<0.05 and ns, not significant, Mann–Whitney U-test) for control (hml>+) versus BskDN (hml>BskDN) animals. n of pupae: 206 (control), 206 (BskDN). (E) Quantification of relative fluorescent intensity of GFP-labelled hemocytes in control (hml>+), TFAM RNAi (hml>UAS-TFAM RNAi), Kay RNAi (hml>UAS-Kay RNAi) and TFMA RNAi+Kay RNAi (hml>UAS-TFAM RNAi+UAS-Kay RNAi) larvae. Data are represented as mean±s.e.m., with individual data points plotted as symbols (*P<0.05 and ns, not significant, unpaired t-test). n of samples: 35 (control), 35 (TFAM RNAi), 24 (Kay RNAi), and 42 (TFAM RNAi+Kay RNAi). (F) Relative change in pupal volume was calculated based on the average value of control (hml>+) animals. Pupal volume data analysis in control (hml>+), TFAM RNAi (hml>UAS-TFAM RNAi), Kay RNAi (hml>UAS-Kay RNAi) and TFMA RNAi+Kay RNAi (hml>UAS-TFAM RNAi+UAS-Kay RNAi) larvae. Data are represented as mean±s.e.m., with individual data points plotted as symbols (*P<0.05 and ns, not significant, unpaired t-test). n of samples: 180 (control), 202 (TFAM RNAi), 213 (Kay RNAi), and 200 (TFAM RNAi+Kay RNAi).
Fig. 5.
Fig. 5.
Hemocyte specific cytokine knock down suppresses body growth. (A) Hemocyte specific Eiger mRNA levels measured by qRT-PCR in control (hml>+) versus TFAM RNAi (hml>UAS-TFAM-RNAi) larvae at 120 h AEL. Data are represented as mean±s.e.m., with individual data points plotted as symbols (*P<0.05 and ns, not significant, unpaired t-test). Number (n) of samples: 7 (control) and 13 (TFAM RNAi). (B) Relative change in pupal volume of control (hml>+) versus Eiger RNAi (hml>UAS-Eiger RNAi) larvae. Data are presented as mean±s.e.m. (*P<0.05 and ns, not significant, Mann–Whitney U-test). n of pupae: 187 (control), 165 (Eiger RNAi). (C) Quantification of relative fluorescent intensity of GFP-labelled hemocytes in control (hml>+) versus Eiger RNAi (hml>UAS-Eiger RNAi) larvae. Data are represented as mean±s.e.m., with individual data points plotted as symbols (*P<0.05 and ns, not significant, unpaired t-test). n of samples: 25 (control) and 24 (Eiger RNAi).
Fig. 6.
Fig. 6.
Low bioenergetic mitochondrial activity in hemocyte leads to suppression of systemic insulin signaling. When hemocyte mitochondrial OxPhos activity is low (for example following TFAM knockdown), expression of Eiger and the activity of the JNK pathway are reduced. Under these conditions, dILP2 secretion from the brain IPC cells and systemic insulin signaling are reduced leading to reduced animal growth and development.

References

    1. Agrawal, N., Delanoue, R., Mauri, A., Basco, D., Pasco, M., Thorens, B. and Leopold, P. (2016). The Drosophila TNF eiger is an adipokine that acts on insulin-producing cells to mediate nutrient response. Cell Metab. 23, 675-684. 10.1016/j.cmet.2016.03.003 - DOI - PubMed
    1. Andersen, D. S., Colombani, J. and Leopold, P. (2013). Coordination of organ growth: principles and outstanding questions from the world of insects. Trends Cell Biol. 23, 336-344. 10.1016/j.tcb.2013.03.005 - DOI - PubMed
    1. Andersen, D. S., Colombani, J., Palmerini, V., Chakrabandhu, K., Boone, E., Rothlisberger, M., Toggweiler, J., Basler, K., Mapelli, M., Hueber, A. O.et al. (2015). The Drosophila TNF receptor Grindelwald couples loss of cell polarity and neoplastic growth. Nature 522, 482-486. 10.1038/nature14298 - DOI - PubMed
    1. Arefin, B., Kucerova, L., Krautz, R., Kranenburg, H., Parvin, F. and Theopold, U. (2015). Apoptosis in hemocytes induces a shift in effector mechanisms in the Drosophila immune system and leads to a pro-inflammatory state. PLoS One 10, e0136593. 10.1371/journal.pone.0136593 - DOI - PMC - PubMed
    1. Bakopoulos, D., Beadle, L. F., Esposito, K. M., Mirth, C. K., Warr, C. G. and Johnson, T. K. (2020). Insulin-like signalling influences the coordination of larval hemocyte number with body size in Drosophila melanogaster. G3 (Bethesda) 10, 2213-2220. 10.1534/g3.120.401313 - DOI - PMC - PubMed

Publication types