. 2023 Dec 1;211(11):1669-1679.
doi: 10.4049/jimmunol.2300305.

Tr1 Cells Emerge and Suppress Effector Th17 Cells in Glomerulonephritis

Affiliations

Tr1 Cells Emerge and Suppress Effector Th17 Cells in Glomerulonephritis

Shiwa Soukou-Wargalla et al. J Immunol. .

Abstract

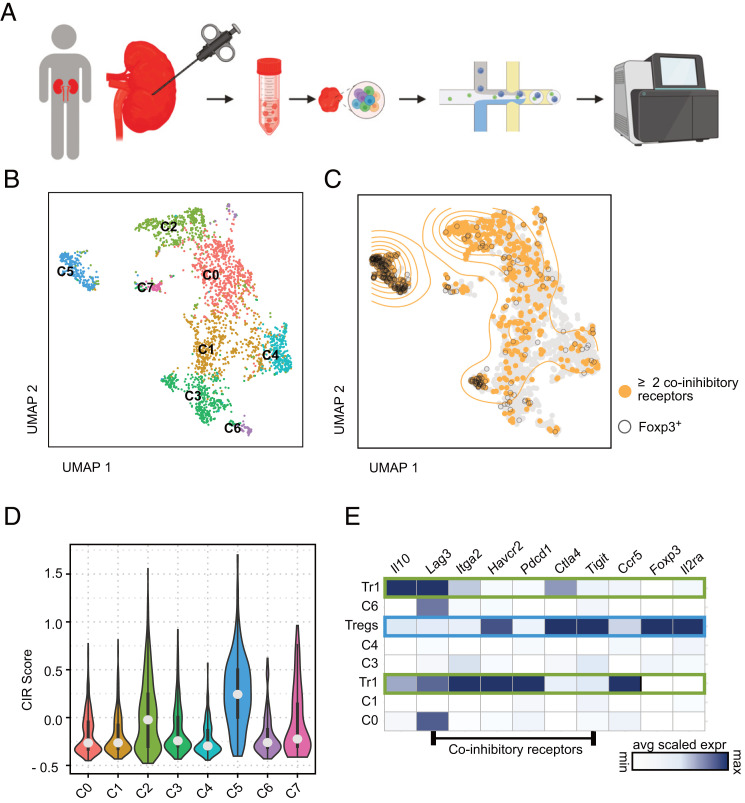
T regulatory type 1 (Tr1) cells, which are defined by their regulatory function, lack of Foxp3, and high expression of IL-10, CD49b, and LAG-3, are known to be able to suppress Th1 and Th17 in the intestine. Th1 and Th17 cells are also the main drivers of crescentic glomerulonephritis (GN), the most severe form of renal autoimmune disease. However, whether Tr1 cells emerge in renal inflammation and, moreover, whether they exhibit regulatory function during GN have not been thoroughly investigated yet. To address these questions, we used a mouse model of experimental crescentic GN and double Foxp3mRFP IL-10eGFP reporter mice. We found that Foxp3neg IL-10-producing CD4+ T cells infiltrate the kidneys during GN progression. Using single-cell RNA sequencing, we could show that these cells express the core transcriptional factors characteristic of Tr1 cells. In line with this, Tr1 cells showed a strong suppressive activity ex vivo and were protective in experimental crescentic GN in vivo. Finally, we could also identify Tr1 cells in the kidneys of patients with antineutrophil cytoplasmic autoantibody-associated GN and define their transcriptional profile. Tr1 cells are currently used in several immune-mediated inflammatory diseases, such as T-cell therapy. Thus, our study provides proof of concept for Tr1 cell-based therapies in experimental GN.


Conflict of interest statement

The authors have no financial conflicts of interest.

Figures

FIGURE 1.
FIGURE 1.
Emergence of IL-10–producing T cells in GN. (A) Experimental cGN was induced in Foxp3mRFP IL10eGFP IL17AKatushka IL17ACre Rosa26YFP (Fate+) mice. Animals were sacrificed under steady-state conditions and on days 3, 7, and 10 after disease induction. Cells were isolated from the kidneys. (B) Representative periodic acid-Schiff staining of paraffin-embedded kidney cross-sections. (C) Percentage of crescent formation. (D) Representative dot plots and gating strategy. (E and F) Bar graphs depicting the percentage of (E) IL-10+ Foxp3+ Tregs and (F) IL-10+ Foxp3neg cells within total CD4+ T cells. (G) Bar graph depicting the percentage of YFP+ Foxp3neg cells within IL-10+ CD4+ T cells. Data in (C) are cumulative of two independent experiments. Day 0, n = 7; day 3, n = 8; day 7, n = 8; day 10, n = 8. Data in (E)–(G) are cumulative of three independent experiments. Day 0, n = 9; day 3, n = 11; day 7, n = 11; day 10, n = 11. Lines indicate mean ± SEM. For statistical analysis, a Kruskal–Wallis with Dunn multiple comparison test was used. Statistical significance was set at p < 0.05.
FIGURE 2.
FIGURE 2.
Expansion of IL-10–producing T cells in GN upon CD3-specific Ab treatment. (A) Experimental cGN was induced in Foxp3mRFP IL10eGFP IL17AKatushka IL17ACre Rosa26YFP (Fate+) mice separated into two groups. One group received an additional 15 µg of anti-CD3 specific Ab on days 8 and 10 after disease induction. The control group received PBS. Mice were sacrificed 4 h after the last Ab or PBS injection. Cells were isolated from the kidneys. (B) Representative dot plots and gating strategy. (CF) Bar graphs depicting the numbers of IL-10+ cells within (C) Foxp3+ Tregs, (D) Foxp3neg YFPneg, (E) Foxp3neg YFP+ IL17A+, and (F) Foxp3neg YFP+ IL17Aneg cells. Data in (C)–(F) are cumulative of four independent experiments. Control, n = 11; anti-CD3, n = 11. Lines indicate mean ± SEM. For statistical analysis, a Wilcoxon–Mann–Whitney test was used. Statistical significance was set at p < 0.05.
FIGURE 3.
FIGURE 3.
A subset of IL-10–producing T cells in the kidney expresses the core transcriptional program of Tr1 cells. (A) Experimental cGN was induced in Foxp3mRFP IL10eGFP IL17AKatushka mice. On days 8 and 10 after disease induction, mice were injected either with PBS or anti-CD3 Ab. Cells were isolated 4 h after the last injection from the kidneys of nephritic mice. (B) UMAP and cluster identification within IL-10+ CD4+ T cells. (C) UMAP and relative frequency of clusters 1–7 from control group and anti-CD3–treated mice. (D) Heat UMAP and violin plot of Tr1 signature score in clusters 1–7 in control group and anti-CD3–treated mice. (E) Tr1 score comparison in control and anti-CD3–treated groups. Tr1 score is based on the expression of Il10, Lag3, Havcr2, Pdcd1, Ctla4, Itga2, and Tigit. (F) Volcano plot of differentially expressed genes comparing clusters 3 and 4 versus the rest. For statistical analysis, a Wilcoxon rank-sum test was used. ****p < 0.0001.
FIGURE 4.
FIGURE 4.
Identification of Tr1 cells within the IL-10–producing T cell subset on the basis of extracellular markers. (A) Experimental cGN was induced in Foxp3mRFP IL10eGFP IL17AKatushka mice. On days 8 and 10 after disease induction, mice were injected either with PBS or with anti-CD3 Ab. Cells were isolated 4 h after the last injection from the kidneys of nephritic mice. Analysis of IL-10 and CIR (CD49b, LAG-3, TIM-3, TIGIT) in Foxp3neg CD4+ T cells was performed. (B) Pie chart depicting the percentage of IL-10+ versus IL-10neg Foxp3neg CD4+ T cells. (C) t-Distributed stochastic neighbor embedding graphs showing the Foxp3neg CD4+ population in PBS versus anti-CD3 conditions. The circles mark the position of Tr1 cells. (D) t-Distributed stochastic neighbor embedding graphs showing the expression of IL-10 or costimulatory surface markers gated on Foxp3neg CD4+ T cells. The circles mark the position of Tr1 cells. (E) Bar charts showing the distribution of stated marker combinations gated on Foxp3neg IL-10–producing CD4+ T cells. Data in (B)–(E) are representative of three independent experiments. PBS, n = 11; anti-CD3, n = 6. For statistical analysis, a Wilcoxon–Mann–Whitney test was used. Statistical significance was set at p < 0.05.
FIGURE 5.
FIGURE 5.
Tr1 cells from the kidney have in vitro suppressive activity. (A) Experimental cGN was induced in Foxp3mRFP IL10eGFP mice. On days 8 and 10 after disease induction, mice were injected either with PBS or with anti-CD3 Ab. Suppressor cells were isolated 4 h after the last injection from the kidneys of nephritic mice. A total of 1.5 × 10⁴ CD4+ T cells (responder cells) were plated per well. An additional 7.5 × 10⁴ irradiated APCs served the purpose of cell activation. A total of 1 × 10⁴ suppressor cells were added to each well. CellTrace Violet dye intensity was measured via flow cytometry. (B and C) Representative histograms and bar graphs showing the suppression of renal Tr1 cells and Foxp3+ Tregs. Data in (B) and (C) are representative of three independent experiments. Responder + responder, n = 3; responder + Tr1, n = 4; responder + Foxp3+ Tregs, n = 4. Lines indicate mean ± SEM. For statistical analysis, one-way ANOVA with Tukey multiple comparisons test was used. Statistical significance was set at p < 0.05.
FIGURE 6.
FIGURE 6.
Tr1 cells suppress experimental GN in vivo. (A) Th17 and Tr1 cells were differentiated in vitro from CD45.1/2 or CD45.2 mice, respectively. Foxp3+ Treg cells were isolated from spleens of CD45.2 mice at steady state. After differentiation, cells were sorted, and Th17 cells were transferred into Rag1−/− mice either alone or in combination with Tr1 cells or Foxp3+ Treg cells as a control. Experimental cGN was induced 24 h after the cell transfer. Animals were sacrificed 10 d after disease induction. (B) Representative dot plots and gating strategy of the sorted T cell populations. (C) Survival curve. (D) Representative periodic acid-Schiff staining of paraffin-embedded kidney cross-sections. Arrowheads point to Bowman’s capsule. (E) Percentage of crescent formation. Data in (C)–(E) are cumulative of five independent experiments. Th17 only, n = 12; Th17 + Foxp3+ Treg cells, n = 7; Th17 + Tr1, n = 17. Lines indicate mean ± SEM. For statistical analysis, Kruskal–Wallis with Dunn multiple comparison test was used. Statistical significance was set at p < 0.05.
FIGURE 7.
FIGURE 7.
Tr1 cells in patients with ANCA-associated GN. (A) Kidney biopsies were isolated from a patient with ANCA. Biopsies were reduced to a single-cell suspension. Cells were barcoded, and single-cell sequencing was performed. (B) UMAP and cluster identification within CD4+ T cells. (C) UMAP of single cells expressing Foxp3 (black circles) and two or more CIRs (orange color). (D) Violin plot of clusters 0–7 indicating the CIR score in each cluster. (E) Heat map of expression of indicated genes in clusters 0–7. Data correspond to n = 8.

References

    1. Krebs, C. F., Turner J.-E., Paust H.-J., Kapffer S., Koyro T., Krohn S., Ufer F., Friese M. A., Flavell R. A., Stockinger B., et al. . 2016. Plasticity of Th17 cells in autoimmune kidney diseases. J. Immunol. 197: 449–457. - PubMed
    1. Tipping, P. G., Holdsworth S. R.. 2006. T cells in crescentic glomerulonephritis. J. Am. Soc. Nephrol. 17: 1253–1263. - PubMed
    1. Paust, H.-J., Turner J.-E., Riedel J.-H., Disteldorf E., Peters A., Schmidt T., Krebs C., Velden J., Mittrücker H.-W., Steinmetz O. M., et al. . 2012. Chemokines play a critical role in the cross-regulation of Th1 and Th17 immune responses in murine crescentic glomerulonephritis. Kidney Int. 82: 72–83. - PubMed
    1. Steinmetz, O. M., Summers S. A., Gan P.-Y., Semple T., Holdsworth S. R., Kitching A. R.. 2011. The Th17-defining transcription factor RORγt promotes glomerulonephritis. J. Am. Soc. Nephrol. 22: 472–483. - PMC - PubMed
    1. Summers, S. A., Steinmetz O. M., Li M., Kausman J. Y., Semple T., Edgtton K. L., Borza D. B., Braley H., Holdsworth S. R., Kitching A. R.. 2009. Th1 and Th17 cells induce proliferative glomerulonephritis. J. Am. Soc. Nephrol. 20: 2518–2524. - PMC - PubMed

Publication types