Contrasting genes conferring short- and long-term biofilm adaptation in Listeria
- PMID: 37850975
- PMCID: PMC10634452
- DOI: 10.1099/mgen.0.001114
Contrasting genes conferring short- and long-term biofilm adaptation in Listeria
Abstract
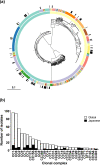
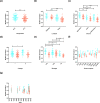
Listeria monocytogenes is an opportunistic food-borne bacterium that is capable of infecting humans with high rates of hospitalization and mortality. Natural populations are genotypically and phenotypically variable, with some lineages being responsible for most human infections. The success of L. monocytogenes is linked to its capacity to persist on food and in the environment. Biofilms are an important feature that allow these bacteria to persist and infect humans, so understanding the genetic basis of biofilm formation is key to understanding transmission. We sought to investigate the biofilm-forming ability of L. monocytogenes by identifying genetic variation that underlies biofilm formation in natural populations using genome-wide association studies (GWAS). Changes in gene expression of specific strains during biofilm formation were then investigated using RNA sequencing (RNA-seq). Genetic variation associated with enhanced biofilm formation was identified in 273 genes by GWAS and differential expression in 220 genes by RNA-seq. Statistical analyses show that the number of overlapping genes flagged by either type of experiment is less than expected by random sampling. This novel finding is consistent with an evolutionary scenario where rapid adaptation is driven by variation in gene expression of pioneer genes, and this is followed by slower adaptation driven by nucleotide changes within the core genome.
Keywords: Listeria; RNAseq; biofilm; genome-wide association study; genomics.
Conflict of interest statement
The authors declare no conflicts of interest
Figures


Similar articles
-
Biofilm formation and genomic features of Listeria monocytogenes strains isolated from meat and dairy industries located in Piedmont (Italy).Int J Food Microbiol. 2022 Oct 2;378:109784. doi: 10.1016/j.ijfoodmicro.2022.109784. Epub 2022 Jun 10. Int J Food Microbiol. 2022. PMID: 35749910
-
The role of the Listeria monocytogenes surfactome in biofilm formation.Microb Biotechnol. 2021 Jul;14(4):1269-1281. doi: 10.1111/1751-7915.13847. Epub 2021 Jun 9. Microb Biotechnol. 2021. PMID: 34106516 Free PMC article. Review.
-
Stress survival islet 1 contributes to serotype-specific differences in biofilm formation in Listeria monocytogenes.Lett Appl Microbiol. 2018 Dec;67(6):530-536. doi: 10.1111/lam.13072. Epub 2018 Oct 18. Lett Appl Microbiol. 2018. PMID: 30218533
-
Novel Cadmium Resistance Determinant in Listeria monocytogenes.Appl Environ Microbiol. 2017 Feb 15;83(5):e02580-16. doi: 10.1128/AEM.02580-16. Print 2017 Mar 1. Appl Environ Microbiol. 2017. PMID: 27986731 Free PMC article.
-
[Advances on the mechanisms regulating the formation of the biofilm of Listeria monocytogenes].Sheng Wu Gong Cheng Xue Bao. 2021 Sep 25;37(9):3151-3161. doi: 10.13345/j.cjb.200734. Sheng Wu Gong Cheng Xue Bao. 2021. PMID: 34622624 Review. Chinese.
Cited by
-
Genome-wide association analysis provides insights into the genomics and extracellular expression of Staphylococcus aureus proteases.Virulence. 2025 Dec;16(1):2543116. doi: 10.1080/21505594.2025.2543116. Epub 2025 Aug 14. Virulence. 2025. PMID: 40754679 Free PMC article.
-
High-throughput phenotype-to-genotype testing of meningococcal carriage and disease isolates detects genetic determinants of disease-relevant phenotypic traits.mBio. 2024 Dec 11;15(12):e0305924. doi: 10.1128/mbio.03059-24. Epub 2024 Oct 30. mBio. 2024. PMID: 39475240 Free PMC article.
-
Bacterial genome-wide association studies: exploring the genetic variation underlying bacterial phenotypes.Appl Environ Microbiol. 2025 Jun 18;91(6):e0251224. doi: 10.1128/aem.02512-24. Epub 2025 May 16. Appl Environ Microbiol. 2025. PMID: 40377303 Free PMC article. Review.
References
-
- Murray EGD, Webb RA, Swann MBR. A disease of rabbits characterised by a large mononuclear leucocytosis, caused by a hitherto undescribed bacillus Bacterium monocytogenes (n.sp.) J Pathol. 1926;29:407–439. doi: 10.1002/path.1700290409. - DOI
Publication types
MeSH terms
Grants and funding
LinkOut - more resources
Full Text Sources
Molecular Biology Databases

