. 2023 Nov 6;222(11):e202303052.
doi: 10.1083/jcb.202303052. Epub 2023 Oct 18.

JNK regulates ciliogenesis through the interflagellar transport complex and actin networks

Affiliations

JNK regulates ciliogenesis through the interflagellar transport complex and actin networks

Maria Chatzifrangkeskou et al. J Cell Biol. .

Abstract

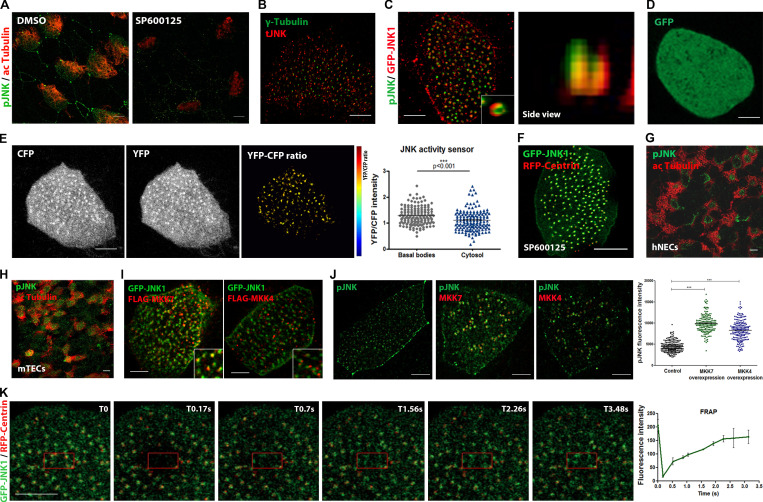
The c-Jun N-terminal kinase (JNK) regulates various important physiological processes. Although the JNK pathway has been under intense investigation for over 20 yr, its complexity is still perplexing, with multiple protein partners underlying the diversity of its activity. We show that JNK is associated with the basal bodies in both primary and motile cilia. Loss of JNK disrupts basal body migration and docking and leads to severe ciliogenesis defects. JNK's involvement in ciliogenesis stems from a dual role in the regulation of the actin networks of multiciliated cells (MCCs) and the establishment of the intraflagellar transport-B core complex. JNK signaling is also critical for the maintenance of the actin networks and ciliary function in mature MCCs. JNK is implicated in the development of diabetes, neurodegeneration, and liver disease, all of which have been linked to ciliary dysfunction. Our work uncovers a novel role of JNK in ciliogenesis and ciliary function that could have important implications for JNK's role in the disease.


Conflict of interest statement

Disclosures: The authors declare no competing interests exist.

Figures

Figure 1.
Figure 1.
JNK is closely associated with the BBs of both motile and primary cilia. (A) Immunostaining of stage 32 Xenopus embryos with anti-phospho-JNK (pJNK) and anti-acetylated-α-tubulin (ac Tubulin) to visualize cilia. pJNK is localized at the base of motile cilia. Scale bars, 10 μm. (B–B’’) Higher magnification images of pJNK at the base of cilia. Scale bars, 1 μm. (C) GFP-JNK and RFP-Centrin mRNA were injected into the ventral marginal region of two blastomeres at the four-cell stage, and the embryos were observed at stage 32. JNK forms a ring around basal bodies Scale bars, 5 μm. (D) GRP ciliated cells of a stage 17 embryo expressing RFP-Centrin and GFP-JNK1, immunostained for acetylated tubulin. GFP-JNK1 is associated with the basal bodies in GRP ciliated cells. Scale bar, 5 μm. (E) Neural tube cross section of a stage 22 embryo coexpressing GFP-JNK1 and centrin2 RFP and immunostained for acetylated tubulin. Scale bar, 5 μm. (E’) The right panels represent magnified insets marked by white squares. Scale bar, 2 μm. (F) Confocal immunofluorescence images of serum-starved HeLa cells showing that pJNK is localized at the base of primary cilia. Scale bar, 2 μm. (G) Immunofluorescent images of human nasal MCCs showing anti-acetylated tubulin and anti-pJNK showing that pJNK is localized at the base of motile cilia. Scale bar, 2 μm. (H) Immunofluorescent images of human nasal MCCs showing anti-acetylated tubulin and anti-tJNK. Scale bar, 2 μm. (I–I’’) Representative confocal images of endogenous localization of acetylated tubulin and JNK (tJNK) in mouse tracheal MCCs showing apical enrichment of JNK. Scale bar, 5 μm. (J) Western blot analysis showing elevated pJNK and JNK protein levels in skin lysates from embryos overexpressing multicilin and controls. Quantification shows the normalized ratio of pJNK/GAPDH intensity. Data represent mean ± SEM from three independent experiments. ***, P < 0.001, unpaired two-tailed t test. (K) Optical section of an intercalating multiciliated cell expressing GFP-JNK1 and RFP-Centrin and stained for actin. GFP-JNK1 is associated with the basal bodies during the early stages of ciliogenesis. Scale bar, 20 μm. Source data are available for this figure: SourceData F1.
Figure S1.
Figure S1.
Active JNK is localized at the base of motile cilia. (A) Immunofluorescence images of DMSO- and SP600125-treated embryos stained with pJNK and acetylated tubulin to mark MCCs. Scale bars, 5 μm. (B) Multiciliated cells stained for total JNK (tJNK) and γ-tubulin that marks the basal foot. (C) Multiciliated cells expressing GFP-JNK stained with an antibody against pJNK. Side view (XZ projection) shows an overlap of the two signals. Scale bars, 10 μm. (D) Confocal images of Xenopus epidermal MCCs injected with GFP displaying a diffuse cytosolic pattern. Scale bars, 10 µm. (E) Color-coded images of the YFP/CFP intensity ratio of the JNK biosensor showing higher ratio at the basal bodies. Graph shows the quantification of the YFP to CFP intensity ratio of the JNK FRET sensor at the basal bodies and cytosol. YFP/CFP ratio at the BBs is higher than in the cytosol. Data represent ± SEM from two experiments (n = 159 BBs, and n = 156 cytosolic regions from 4 embryos), ***, P < 0.001, unpaired two-tailed t test. Scale bars, 5 μm. (F) Representative confocal images of SP600125-treated embryos injected with GFP-JNK and RFP-Centrin. JNK localization is not dependent on its kinase activity. Scale bars, 5 µm. (G) Representative images of human nasal epithelial cells (hNECs) grown at ALI after 21–25 d. Staining with acetylated tubulin and pJNK show apical enrichment of pJNK. Scale bars, 5 µm. (H) Representative confocal images of endogenous localization of acetylated tubulin and pJNK in mouse tracheal epithelial cells (mTECs). Scale bars, 5 µm. (I) Confocal images of MCCs expressing GFP-JNK coinjected with FLAG-MKK7 show partial colocalization with JNK. Expression of FLAG-MKK4 show apical enrichment. Scale bars, 5 µm. (J) Representative images of pJNK staining in Flag-MKK7 and Flag-MKK4 overexpressing MCCs. Quantification of BB-associated fluorescence signal of pJNK shows enhanced phosphorylation in MKK7- and MKK4-overexpressing cells compared to controls (n = 205 controls, n = 179 MKK7-overexpressing cells, n = 192 MKK4-overexpressing cells). Data represent ± SEM from three experiments. ***, P < 0.001, unpaired two-tailed t test. (K) Image sequence of a MCC expressing GFP-JNK/RFP-Centrin upon photobleaching of a region of interest (red square). T0 indicates the time of photobleaching. Normalized fluorescence intensity of GFP-JNK displays a highly dynamic association of JNK with the basal bodies with t1/2 = 0.4 s (n = 11 controls and n = 11 JNK MO from 3 embryos). Scale bars, 10 μm.
Figure 2.
Figure 2.
Super-resolution imaging combined with intermolecular FRET reveals that JNK is localized at the transition fibers of MCCs and interacts with TF components. (A) A Xenopus epidermal MCC expressing RFP-Centrin stained for pJNK and acetylated tubulin. Scale bars, 5 µm. Top-down higher magnification view is shown. Scale bars, 1 µm. Side view (XZ projection) showing that pJNK is localized distally from the basal bodies. Fluorescence intensity profile along the white arrow. (B) (I) Representative Z-stack images of embryos injected with GFP-Chibby and stained for pJNK. (II) Images of embryos injected with GFP-IFT52 and stained for pJNK. (III) Images of embryos injected with GFP-CEP83 and stained for pJNK. (IV) Images of embryos injected with GFP-CEP123 and stained for pJNK. (V and III) Images of embryos injected with GFP-JNK and stained for CEP164. Scale bars, 5 µm. High-magnification top views and fluorescence intensity profiles are shown. Scale bars, 0.5 µm. Side views show XZ projection. (C) Quantification of the mean diameters of the rings of JNK (n = 39 BBs), Chibby (n = 63 BBs), IFT52 (n = 63 BBs from 4 MCCs), CEP83 (n = 57 BBs from 3 MCCs), CEP123 (n = 60 BBs from 4 MCCs), and CEP164 (n = 40 BBs from 3 MCCs) show that JNK’s ring has approximately the same diameter as IFT52, CEP83, CEP123, and CEP164. Bars represent mean ± SEM from two experiments. ***, P < 0.001, unpaired two-tailed t test. (D) Schematic diagram depicting JNK localization in relation to other markers. TZ, transition zone; BB, basal body; TF, transition fiber. (E) Multiciliated cell expressing mScarlet JNK (acceptor) and GFP-CEP123 (donor), before and after acceptor photobleaching. GFP intensity rises, showing that FRET is taking place between GFP and mScarlet and suggesting that JNK is interacting with CEP123. Data represent mean ± SEM (n = 5 MCCs from three embryos).
Figure S2.
Figure S2.
Map of TZ and TF components of epidermal motile cilia. (A) Airyscan super-resolution Z-stack images of MCCs expressing the transition zone proteins (i) mTagBFP2-Centrin and mCherry-CEP290, (ii) mEmerald-B9D1 and mCherry-CEP290, (iii) mTagBFP2-Centrin, mEmerald-B9D1 and mCherry-CEP290, (iv) mEmerald-NPHP1 and mCherry-CEP290, (v) mEmerald-MKS1 and mCherry-CEP290, (vi) mEmerald-MKS1 and mCherry-TMEM216, and (vii) mCherry-TMEM216 and stained for CEP164. Scale bars, 5 μm. (B) Representative Z-stack images of MCCs expressing the transition fiber proteins (i) GFP-Chibby and mCherry-CEP290, (ii) GFP-Chibby stained for CEP164, (iii) GFP-CEP123 and mCherry-CEP290, (iv) GFP-CEP123 stained for CEP164, (v) GFP-IFT52 stained for CEP164, (vi) GFP-CEP83 stained for CEP164, and (vii) GFP-CEP83 and mCherry-CEP290. Scale bars, 5 μm. (C) Airyscan super-resolution Z-stack images of MCCs expressing (i) GFP-JNK1 and mCherry-TMEM216, (ii) mEmerald-MKS1 stained for pJNK, (iii) GFP-JNK1 and mCherry-CEP290, and (iv) mEmerald-B9D1 stained for pJNK. Scale bars, 5 μm. (D) Multiciliated cell expressing mScarlet JNK (acceptor) and GFP-Chibby. GFP intensity remains unchanged suggesting that JNK is not associated with Chibby. Data represent mean ± SEM (n = 6 MCCs from three embryos). Scale bars, 5 μm. (E) Western blot showing that immunoprecipitated GFP-JNK from uninjected and Multicilin overexpressing skin lysates interacts with CEP164. Source data are available for this figure: SourceData FS2.
Figure S3.
Figure S3.
Inhibition of JNK activity affects primary and motile ciliogenesis. (A) Western blot analysis of protein extracts from control and JNK morphants. 40 ng of JNK MO was injected into both blastomeres of two-cell stage embryos. Quantification shows the normalized ratio of pJNK/GAPDH intensity. Data represent mean ± SEM from three independent experiments. **, P < 0.01, unpaired two-tailed t test. (B) Representative images of GFP-Centrin expressing embryos injected with high dose MO (80 ng/cell) and stained with acetylated tubulin. Scale bars, 5 µm. (C) Immunofluorescence images of control and JNK MO embryos stained for acetylated tubulin and ZO-1 shows apical enrichment of ZO-1 and absence of signal at the basal region. Scale bars, 10 μm. (D) Representative images of control and JNK MO (low and high dose) embryos injected with GFP-Dishevelled shows an association of Dishevelled with the basal bodies, suggesting that JNK is not involved in the PCP polarity. Scale bars, 5 μm. (E) Western blotting of pJNK protein levels in DMSO- or SP600125-treated epidermal lysates. Quantification shows the normalized ratio of pJNK/GAPDH intensity. Data represent mean ± SEM from three independent experiments, ***, P < 0.001, unpaired two-tailed t test. (F) Immunofluorescence images of DMSO- and BI-78D3 embryos stained for pJNK and acetylated Tubulin. Fluorescence intensity of pJNK in BI-78D3-treated embryos is dramatically decreased compared with DMSO. Scale bars, 5 µm. (G) Immunofluorescence images of DMSO- and BI-78D3 embryos stained for Centrin and acetylated tubulin. Scale bars, 10 µm. Quantification shows decreased acetylated-tubulin fluorescence intensity in BI-78D3-treated MCCs compared to DMSO. Data represent mean ± SEM from three independent experiments, ***, P < 0.001, unpaired two-tailed t test. (H) HeLa cells were serum-starved for 24 h and stained for acetylated α-tubulin in the presence of DMSO or SP600125. DNA was counterstained with Hoechst. Scale bars, 20 µm. Primary cilia were manually counted by scanning through all focal planes. Approximately 700 cells for each condition were scored from three replicates for the presence of a primary cilium. The percentage of primary cilia in SP600125-treated cells is decreased as shown in the graph. Data represent mean ± SEM from three independent experiments, *, P < 0.05, unpaired two-tailed t test. Source data are available for this figure: SourceData FS3.
Figure 3.
Figure 3.
JNK activity is necessary for ciliogenesis. (A) Velocity of fluorescent beads in micrometers per second of control Xenopus embryos and embryos injected with JNK MO. MO (40 ng per cell) was injected into the ventral blastomeres at the four-cell stage. Scale bar, 500 μm. Quantification of the bead velocity shows impaired fluid flow in JNK morphants. Error bars indicate ± SEM from two experiments, n = 5 embryos (stage 29–30) per group. ***, P < 0.001, unpaired two-tailed t test. (B) Control embryos or JNK MO-injected embryos were fixed at stage 31/32 and stained for ac-tubulin and centrin. Coinjection of JNK MO with mScarlet-JNK1 rescued the ciliary defects. Scale bar, 10 μm. Quantifications of the acetylated tubulin intensity, percentage of ciliated, partially ciliated and non-ciliated cells (n = 305 control cells from three embryos, n = 398 JNK MO MCCs from four embryos, n = 431 from three embryos), and the percentage of cells displaying trapped basal bodies within the cytoplasm in controls (n = 203 MCCs from three embryos), JNK morphants (n = 580 from two embryos), and JNK MO/mScarlet JNK (n = 154 from three embryos) injected embryos. Apical cell surface area of epidermal MCCs is decreased in JNK MO-injected embryos. Error bars indicate ± SEM. **, P < 0.01, ***, P < 0.001, unpaired two-tailed t test. (C) Representative images of stage 30 control embryos or embryos injected with Flag-JBD under α-tubulin promoter. Embryos were either stained for acetylated tubulin or coinjected with RFP-Centrin to mark basal bodies. The graph shows a higher percentage of partially ciliated and non-ciliated cells (n = 288 MCCs from three embryos) as well as MCCs with defective BB migration in embryos injected with Flag-JBD compared with controls (n = 309 MCCs from three embryos). Error bars indicate ± SEM from three experiments. **, P < 0.01, ***, P < 0.001, unpaired two-tailed t test. Scale bar, 10 μm. (D) Quantification of the fluid flow with fluorescent beads shows decreased bead velocity in SP600125-treated embryos compared to DMSO. Error bars indicate ± SEM, n = 5 embryos (stage 29–30) per group. ****, P < 0.0001, unpaired two-tailed t test. Scale bar, 500 μm. (E) Confocal imaging of cilia in DMSO- and SP600125-treated stained with anti-acetylated tubulin and of basal bodies stained with anti-Centrin. Scale bars, 20 µm. Graph showing a higher percentage of partially ciliated and non-ciliated MCCs (n = 272 control cells from 5 embryos, n = 259 SP600125-treated cells from 6 embryos) and cells displaying defective basal body migration in SP600125-treated embryos (n = 118 from 5 embryos) compared with control (n = 120 from 5 embryos). Error bars indicate ± SEM from three experiments. *, P < 0.05, **, P < 0.01, unpaired two-tailed t test. (F) Western blot showing phospho-JUN levels in skin lysates from uninjected, multicilin overexpressing, and multicilin/JNK MO coinjected embryos. Quantification shows the normalized ratio of pJUN/GAPDH intensity. Data represent mean ± SEM from two independent experiments. *, P < 0.05, **, P < 0.01, unpaired two-tailed t test. Source data are available for this figure: SourceData F3.
Figure S4.
Figure S4.
JNK is involved in the association of IFT-52 with the basal bodies and apical actin network establishment. (A) (I) Representative images of embryos injected with GFP-CEP83 and RFP-Centrin in control and JNK MO embryos. (II) Images of embryos injected with GFP-CEP123 and RFP-Centrin in control and JNK MO embryos. (III) Control and JNK morphants stained with Phalloidin and CEP164. (IV) Representative image of MCC injected with mCherry-IFT46 and stained for Centrin. The association of CEP83, CEP123, CEP164 and IFT46 with the basal bodies is not affected in JNK morphants. Scale bars, 10 µm. (B) Representative confocal images of stage 19 embryos coinjected with GFP-IFT52 and RFP-Centrin. IFT52 is associated with the basal bodies during the early stages of ciliogenesis. Scale bars, 5 µm. (C) MCCs of DMSO- and SP600125-treated embryos stained with phalloidin to visualize apical and subapical actin networks. Single optical sections show impaired apical and subapical actin networks in SP600125-treated embryos. Scale bars, 5 µm. (D) Quantification of the half-time of recovery (t1/2) of apical actin in control and JNK morphant MCCs. Error bars indicate ± SEM. ***, P < 0.001, unpaired two-tailed t test. (E) Optical sections of a Xenopus epidermal MCC expressing GFP-JNK and RFP-Utrophin. A second region of JNK enrichment in close association with the subapical actin is occasionally detected. Scale bars, 5 μm. (F) Multiciliated cell expressing GFP-JNK (donor) and mKate2 Actin (acceptor) showing the apical actin network, before and after acceptor photobleaching (n = 5 from 3 embryos). GFP intensity rises, showing that FRET is taking place between GFP and mKate2 suggesting that JNK interacts with actin. Scale bars, 10 μm.
Figure 4.
Figure 4.
Loss of JNK impacts the IFT-B complex and destabilizes the actin network of multiciliated cells. (A) Representative images from control and JNK morphant embryos injected with RFP-Centrin and GFP-IFT52. Scale bars, 10 µm. Quantification of the fluorescence intensity ratio of GFP-IFT52 shows impaired recruitment of IFT52 on basal bodies in JNK MO MCCs. Data represent mean ± SEM from three independent experiments. ****, P < 0.0001, unpaired two-tailed t test. (B) Immunofluorescence showing Xenopus epidermal MCCs labeled for F-actin (Phalloidin) in controls, embryos injected with JNK MO, or JNK MO/mScarlet JNK. Membrane-mCherry mRNA was used as a lineage tracer. Single optical sections at the level of apical and subapical actin layers show defective networks in JNK morphants. Scale bars, 10 µm. (C) Fluorescence recovery after photobleaching (FRAP) experiment on a stage 33 embryo with docked basal bodies, expressing either mKate2-actin alone or mKate2-actin with JNK MO. Normalized graph of FRAP experiment depicting signal intensity of bleached region over time shows faster recovery of apical actin and decreased immobile fraction in JNK MO (n = 8 MCCs from four embryos) MCCs compared with controls (n = 6 MCCs from three embryos). Error bars indicate ± SEM from two experiments. ***, P < 0.001, unpaired two-tailed t test. Scale bars, 10 µm. (D) Intercalating ciliated cells of stage 17 from control or JNK MO-injected embryos were stained for Phalloidin and centrin to label actin network and basal bodies, respectively. MCCs of JNK morphants show a defective association of basal bodies with the actin network. (E) Immunofluorescence image showing MCCs labeled for F-actin (Phalloidin) and pJNK. Scale bars, 10 µm. High-magnification top view and fluorescence intensity profile along the white line show that pJNK is interwoven within the apical actin network. Scale bars, 2 µm.
Figure S5.
Figure S5.
Inhibition of JNK in mature MCCs leads to defects in CBF and apical actin without affecting rotational polarity. (A) Western blot analysis of pJNK protein levels in tadpoles’ skin lysate from DMSO- or SP600125-treated embryos. *, P < 0.05, data represent mean ± SEM from three independent experiments, unpaired two-tailed t test. (B) Ciliary beat frequency in hertz (beats per second) of motile cilia in DMSO- or SP600125-treated Xenopus epidermal MCCs. Error bars indicate ± SEM, ***, P < 0.001 (n = 5 embryos for each condition), unpaired two-tailed t test. (C) Immunofluorescence images of DMSO- and BI-78D3 embryos labeled for F-actin and acetylated tubulin. Scale bars, 10 µm. Quantification shows decreased acetylated tubulin intensity (n = 23 DMSO-treated MCCs and n = 28 BI-78D3-treated MCCs) and apical cell surface (n = 33 DMSO-treated MCCs, n = 57 BI-78D3-treated MCCs) in BI-78D3-treated embryos compared to DMSO. Error bars indicate ± SEM from three experiments, ***, P < 0.001, unpaired two-tailed t test. (D) Representative higher-magnification immunofluorescence images of MCC treated with DMSO or BI-78D3 for 2 h and stained with Phalloidin. Fluorescence intensity profiles along the lines show an impaired apical actin network in BI-78D3-treated MCCs. Scale bars, 10 µm. (E) Immunofluorescence images of MCCs treated with SP600125 for 2 h at stage 30 followed by drug washout and subsequent imaging of the apical actin network 0, 1, 2, and 3 h after washout. Scale bars, 10 μm. (F) Representative images of DMSO- and SP600125-treated embryos injected with GFP-Clamp as a marker of rootlets and RFP-Centrin to monitor cilia orientation. Circular diagrams of mean cilia orientation from polarized embryos treated at stage 30 with either DMSO or SP600125 for 2 h (n = 212 BB from four DMSO-treated embryos, n = 243 BBs from 4 SP600125-treated embryos). Rotational polarity is not affected in SP600125-treated embryos as reflected by the similar circular standard deviation (CSD). Scale bars, 10 µm. (G) Quantification of the number of basal bodies in DMSO- (n = 63 MCCs from three embryos) and SP60125-treated stage 30 embryos (n = 61 from 3 embryos). Error bars indicate ± SEM from two experiments, unpaired two-tailed t test. (H) Confocal images of stage 30 embryos coinjected with GFP-IFT52 and RFP-Centrin. The association of IFT52 with the basal bodies is not affected in 2 h SP600125-treated embryos. Scale bars, 10 µm. Source data are available for this figure: SourceData FS5.
Figure 5.
Figure 5.
JNK activity is necessary for ciliary function. (A) Quantification of the fluid flow with fluorescent beads in DMSO- and SP600125-treated (2 h) embryos. SP600125 was added into the media of embryos after MCC differentiation was completed, at stages 31–34. Error bars indicate ± SEM from two independent experiments, n = 5 embryos per group, ***, P < 0.001, unpaired two-tailed t test. Scale bar, 500 μm. (B) Immunofluorescence images showing Xenopus epidermal MCCs labeled for F-actin (Phalloidin) and cilia (anti-acetylated α-tubulin) after exposure to DMSO or SP600125 for 2 h. Scale bars, 20 µm. Quantification shows decreased acetylated tubulin intensity (n = 63 DMSO, n = 70 SP600125) and apical cell surface in SP600125-treated embryos (n = 107 MCCs) compared with DMSO (n = 87). Error bars indicate ± SEM from three experiments. ***, P < 0.001, unpaired two-tailed t test. (C) Higher magnification images of 2 h DMSO- and SP600125-treated MCCs stained for Phalloidin and acetylated α-tubulin. The apical and subapical actin networks in SP600125-treated embryo are impaired. Scale bars, 10 µm. (D) RFP-Centrin injected embryos were treated for 2 h at stage 30 with either DMSO- or SP600125. Quantification of basal body distribution by measuring the distance of individual basal bodies relative to their nearest neighbors (n = 140 basal bodies for each condition from three embryos). Error bars indicate ± SEM from three experiments. ***, P < 0.001, unpaired two-tailed t test.

Similar articles

Cited by

References

    1. Antoniades, I., Stylianou P., and Skourides P.A.. 2014. Making the connection: Ciliary adhesion complexes anchor basal bodies to the actin cytoskeleton. Dev. Cell. 28:70–80. 10.1016/j.devcel.2013.12.003 - DOI - PubMed
    1. Awata, J., Takada S., Standley C., Lechtreck K.F., Bellvé K.D., Pazour G.J., Fogarty K.E., and Witman G.B.. 2014. NPHP4 controls ciliary trafficking of membrane proteins and large soluble proteins at the transition zone. J. Cell Sci. 127:4714–4727. 10.1242/jcs.155275 - DOI - PMC - PubMed
    1. Barr, R.K., Kendrick T.S., and Bogoyevitch M.A.. 2002. Identification of the critical features of a small peptide inhibitor of JNK activity. J. Biol. Chem. 277:10987–10997. 10.1074/jbc.M107565200 - DOI - PubMed
    1. Benoit, B., Baillet A., and Poüs C.. 2021. Cytoskeleton and associated proteins: Pleiotropic JNK substrates and regulators. Int. J. Mol. Sci. 22:8375. 10.3390/ijms22168375 - DOI - PMC - PubMed
    1. Björkblom, B., Padzik A., Mohammad H., Westerlund N., Komulainen E., Hollos P., Parviainen L., Papageorgiou A.C., Iljin K., Kallioniemi O., et al. . 2012. c-Jun N-terminal kinase phosphorylation of MARCKSL1 determines actin stability and migration in neurons and in cancer cells. Mol. Cell. Biol. 32:3513–3526. 10.1128/MCB.00713-12 - DOI - PMC - PubMed

Publication types

MeSH terms

Substances