Observational Study
. 2023 Nov;49(11):1360-1369.
doi: 10.1007/s00134-023-07239-w. Epub 2023 Oct 18.

Uncovering heterogeneity in sepsis: a comparative analysis of subphenotypes

Collaborators, Affiliations
Observational Study

Uncovering heterogeneity in sepsis: a comparative analysis of subphenotypes

Rombout B E van Amstel et al. Intensive Care Med. 2023 Nov.

Abstract

Purpose: The heterogeneity in sepsis is held responsible, in part, for the lack of precision treatment. Many attempts to identify subtypes of sepsis patients identify those with shared underlying biology or outcomes. To date, though, there has been limited effort to determine overlap across these previously identified subtypes. We aimed to determine the concordance of critically ill patients with sepsis classified by four previously described subtype strategies.

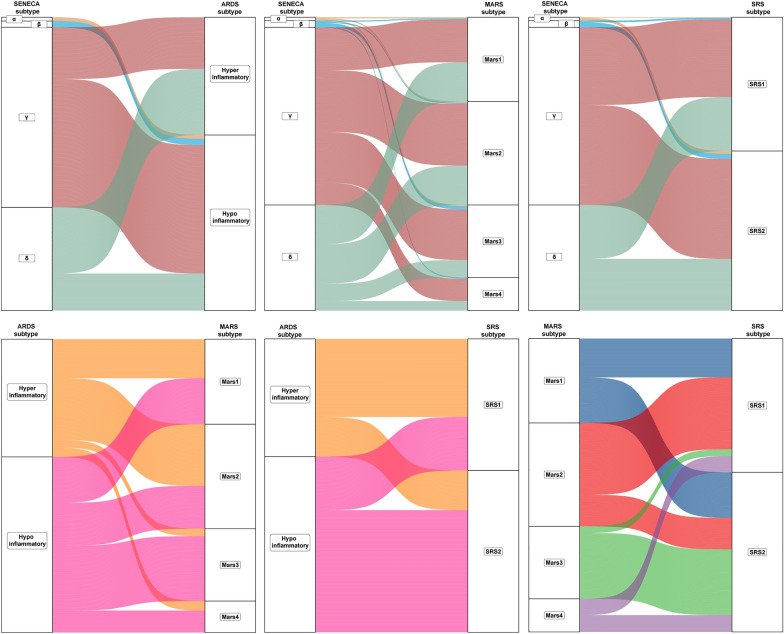
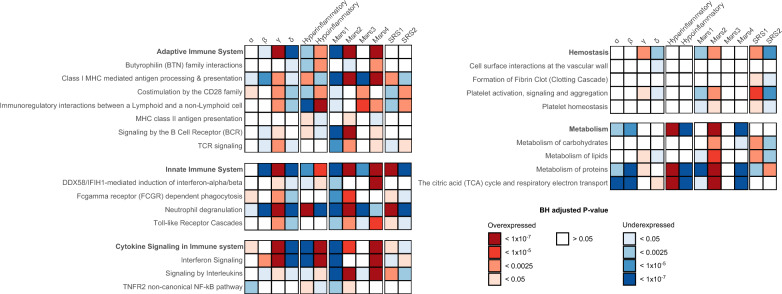
Methods: This secondary analysis of a multicenter prospective observational study included 522 critically ill patients with sepsis assigned to four previously established subtype strategies, primarily based on: (i) clinical data in the electronic health record (α, β, γ, and δ), (ii) biomarker data (hyper- and hypoinflammatory), and (iii-iv) transcriptomic data (Mars1-Mars4 and SRS1-SRS2). Concordance was studied between different subtype labels, clinical characteristics, biological host response aberrations, as well as combinations of subtypes by sepsis ensembles.

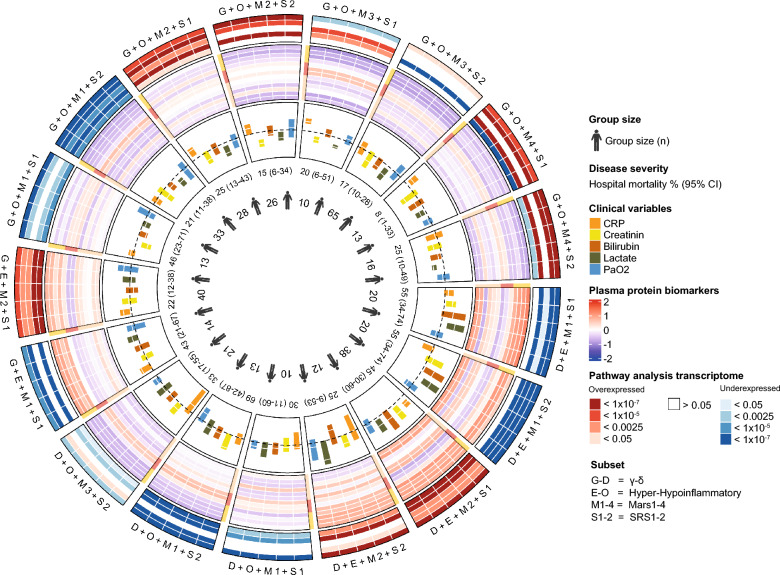
Results: All four subtype labels could be adjudicated in this cohort, with the distribution of the clinical subtype varying most from the original cohort. The most common subtypes in each of the four strategies were γ (61%), which is higher compared to the original classification, hypoinflammatory (60%), Mars2 (35%), and SRS2 (54%). There was no clear relationship between any of the subtyping approaches (Cramer's V = 0.086-0.456). Mars2 and SRS1 were most alike in terms of host response biomarkers (p = 0.079-0.424), while other subtype strategies showed no clear relationship. Patients enriched for multiple subtypes revealed that characteristics and outcomes differ dependent on the combination of subtypes made.

Conclusion: Among critically ill patients with sepsis, subtype strategies using clinical, biomarker, and transcriptomic data do not identify comparable patient populations and are likely to reflect disparate clinical characteristics and underlying biology.

Keywords: ARDS; Intensive care; Phenotype; Precision medicine; Sepsis.


Conflict of interest statement

The authors disclose that they do not have any potential conflicts of interest.

Figures

Fig. 1
Fig. 1
Distribution of SENECA, ARDS, MARS, or SRS subtypes across each other in the MARS cohort. Visualization of concordance between subtype labels with alluvial plots in patients with sepsis in the MARS cohort
Fig. 2
Fig. 2
Host response biomarkers classified by sepsis subtype. Boxplots displaying biomarker concentrations (pg/ml), after log10 transformation. Horizontal line is the median concentration of healthy volunteers (n = 25). Biomarkers are grouped by domain (Inflammation, Coagulation, and Endothelial dysfunction). IL Interleukin, MMP matrix metalloproteinase, ICAM intercellular adhesion molecule, ANG angiopoietin
Fig. 3
Fig. 3
Blood transcriptional responses between subtypes for targeted pathways. Heatmaps showing the Benjamini–Hochberg adjusted P value correcting for all existing Reactome database pathways, and direction using the Normalized Enrichment Score (red =  + NES, blue = − NES). Canonical signaling pathways were grouped into major pathways, indicated in bold
Fig. 4
Fig. 4
Circular visualization of sepsis ensembles. Circle plot, where each section represents a patient subset of at least 10 patients. From in to out, group size, hospital mortality, boxplot of clinical variables, heatmap of plasma protein biomarkers and a heatmap of pathway analysis of the transcriptome are displayed. In the boxplot, the variables are scaled and the horizontal dotted line is 0. Each row in the heatmap represents a biomarker, ordered and colored according to Fig. 2. The pathways are the 5 major pathways in Fig. 3

References

    1. Singer M, Deutschman CS, Seymour CW, Shankar-Hari M, Annane D, Bauer M, et al. The third international consensus definitions for sepsis and septic shock (Sepsis-3) JAMA. 2016;315(8):801–810. doi: 10.1001/jama.2016.0287. - DOI - PMC - PubMed
    1. Rudd KE, Johnson SC, Agesa KM, Shackelford KA, Tsoi D, Kievlan DR, et al. Global, regional, and national sepsis incidence and mortality, 1990–2017: analysis for the Global Burden of Disease Study. Lancet. 2020;395(10219):200–211. doi: 10.1016/S0140-6736(19)32989-7. - DOI - PMC - PubMed
    1. Angus DC, Linde-Zwirble WT, Lidicker J, Clermont G, Carcillo J, Pinsky MR. Epidemiology of severe sepsis in the United States: analysis of incidence, outcome, and associated costs of care. Crit Care Med. 2001;29(7):1303–1310. doi: 10.1097/00003246-200107000-00002. - DOI - PubMed
    1. Vincent JL, Marshall JC, Namendys-Silva SA, Francois B, Martin-Loeches I, Lipman J, et al. Assessment of the worldwide burden of critical illness: the Intensive Care Over Nations (ICON) audit. Lancet Respir Med. 2014;2(5):380–386. doi: 10.1016/S2213-2600(14)70061-X. - DOI - PubMed
    1. Yende S, Austin S, Rhodes A, Finfer S, Opal S, Thompson T, et al. Long-term quality of life among survivors of severe sepsis: analyses of two international trials. Crit Care Med. 2016;44(8):1461–1467. doi: 10.1097/CCM.0000000000001658. - DOI - PMC - PubMed

Publication types